| Param | Original file | Final file |
|---|---|---|
| Filename | modeM0/AS1A06_005T09_9000003168_21468cztM0_level2.evt | modeM0/AS1A06_005T09_9000003168_21468cztM0_level2_quad_clean.evt |
| Size (bytes) | 499,697,280 | 92,808,000 |
| Size | 476.5 MB | 88.5 MB |
| Events in quadrant A | 3,344,609 | 590,961 |
| Events in quadrant B | 3,472,386 | 604,266 |
| Events in quadrant C | 3,354,652 | 581,790 |
| Events in quadrant D | 4,508,931 | 568,500 |
| Mode SS | |||
|---|---|---|---|
| Quadrant | BADHDUFLAG | Total packets | Discarded packets |
| A | 0 | 136 | 0 |
| B | 0 | 136 | 0 |
| C | 0 | 136 | 0 |
| D | 0 | 136 | 0 |
| Mode M9 | |||
|---|---|---|---|
| Quadrant | BADHDUFLAG | Total packets | Discarded packets |
| A | 0 | 12 | 0 |
| B | 0 | 13 | 0 |
| C | 0 | 13 | 0 |
| D | 0 | 13 | 0 |
| Mode M0 | |||
|---|---|---|---|
| Quadrant | BADHDUFLAG | Total packets | Discarded packets |
| A | 0 | 13921 | 3 |
| B | 0 | 14186 | 2 |
| C | 0 | 14021 | 2 |
| D | 0 | 17885 | 2 |
| Quadrant | Total seconds | Saturated seconds | Saturation percentage |
|---|---|---|---|
| A | 6669 | 105 | 1.574449% |
| B | 6669 | 135 | 2.024291% |
| C | 6669 | 157 | 2.354176% |
| D | 6669 | 173 | 2.594092% |
Noise dominated data is calculated using 1-second bins in cleaned event files. If a bin has >2000 counts, and if more than 50% of those come from <1% of pixels, then it is considered to be noise-dominated and hence unusable.
| Quadrant | # 1 sec bins | Bins with >0 counts | Bins with >2000 counts | High rate bins dominated by noise | Noise dominated (total time) | Noise dominated (detector-on time) | Marked lightcurve |
|---|---|---|---|---|---|---|---|
| A | 7594 | 6669 | 0 | 0 | 0.00% | 0.00% | 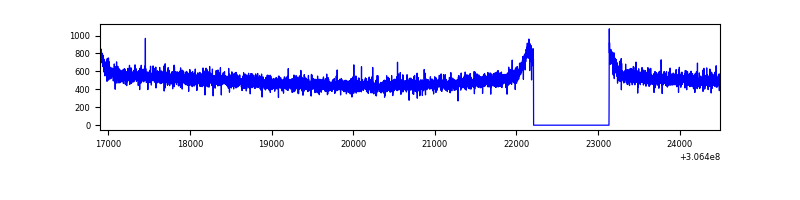 |
| B | 7594 | 6669 | 2 | 2 | 0.03% | 0.03% | 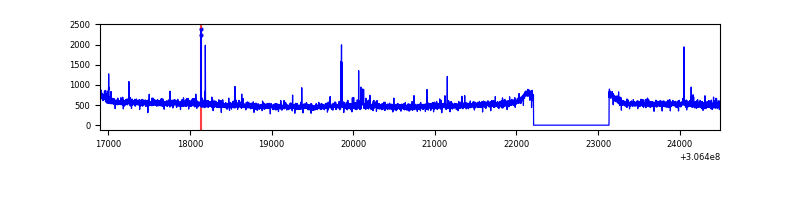 |
| C | 7594 | 6669 | 0 | 0 | 0.00% | 0.00% | 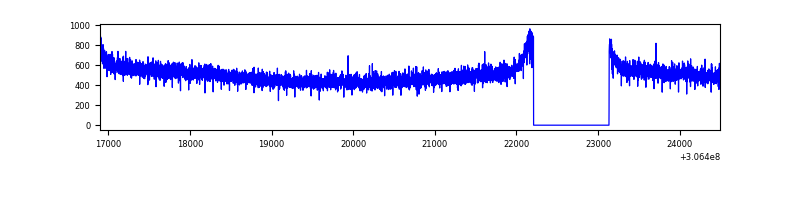 |
| D | 7594 | 6669 | 51 | 51 | 0.67% | 0.76% | 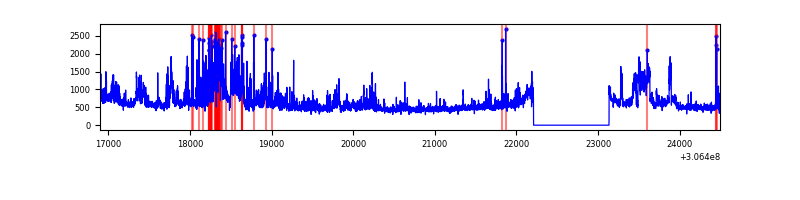 |
Top three noisy pixels from each quadrant. If the there are fewer than three noisy pixels in the level2.evt file, extra rows are filled as -1
| Pixel properties | Quadrant properties | ||||||
|---|---|---|---|---|---|---|---|
| Quadrant | DetID | PixID | Counts | Sigma | Mean | Median | Sigma |
| A | 13 | 254 | 8759 | 45.6 | 866 | 851 | 173.4 |
| A | 11 | 47 | 8557 | 44.44 | 866 | 851 | 173.4 |
| A | 0 | 226 | 7582 | 38.82 | 866 | 851 | 173.4 |
| B | 0 | 230 | 38637 | 228.81 | 862 | 839 | 165.2 |
| B | 3 | 64 | 30475 | 179.4 | 862 | 839 | 165.2 |
| B | 12 | 111 | 19739 | 114.41 | 862 | 839 | 165.2 |
| C | 14 | 238 | 131360 | 676.47 | 826 | 831 | 193.0 |
| C | 13 | 61 | 5793 | 25.72 | 826 | 831 | 193.0 |
| C | 4 | 175 | 2436 | 8.32 | 826 | 831 | 193.0 |
| D | 13 | 174 | 554737 | 2722.91 | 841 | 818 | 203.4 |
| D | 1 | 20 | 546161 | 2680.75 | 841 | 818 | 203.4 |
| D | 14 | 35 | 101139 | 493.15 | 841 | 818 | 203.4 |
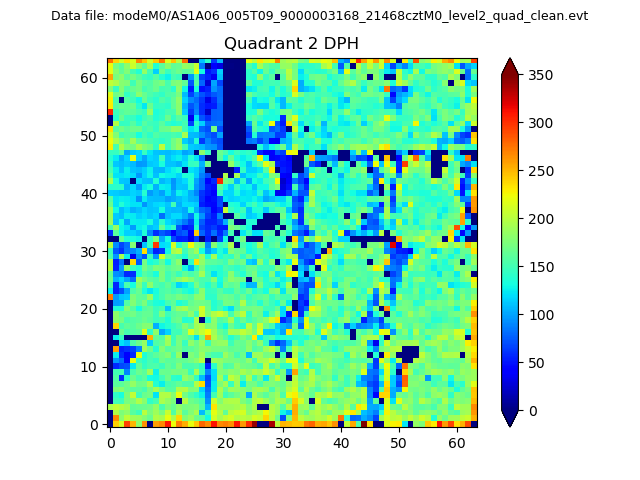
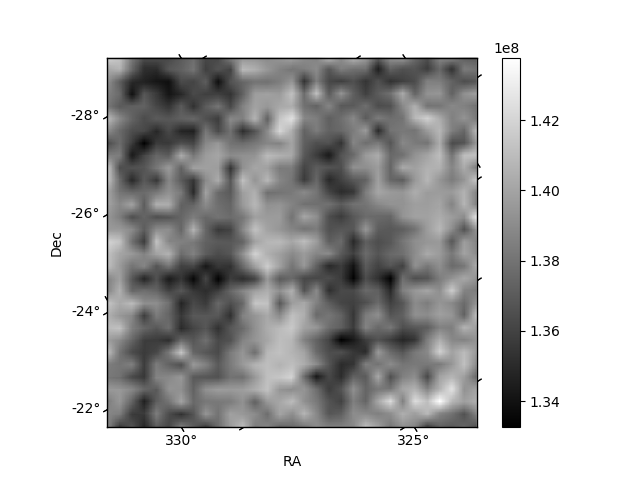
Histogram calculated using DETX and DETY for each event in the final _common_clean file
| Quadrant A | 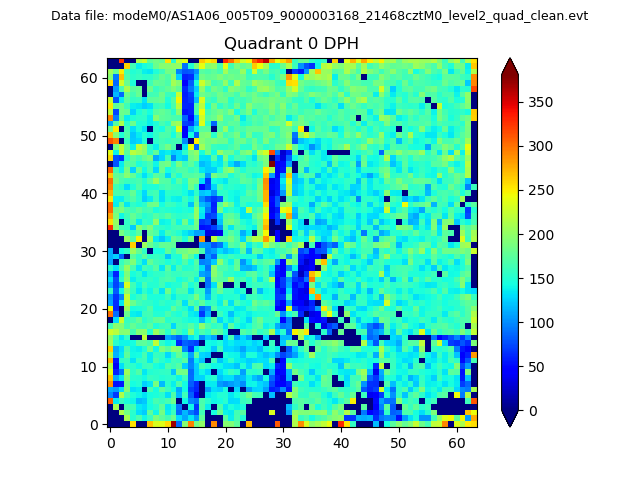 |
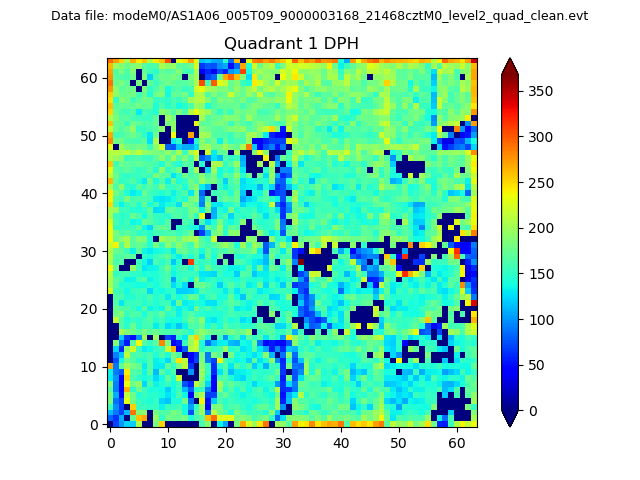 |
Quadrant B |
|---|---|---|---|
| Quadrant D | 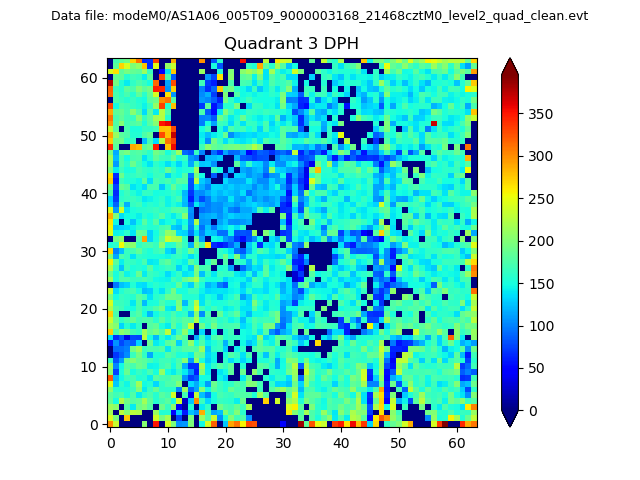 |
 |
Quadrant C |
| Plot type | Count rate plots | Images |
|---|---|---|
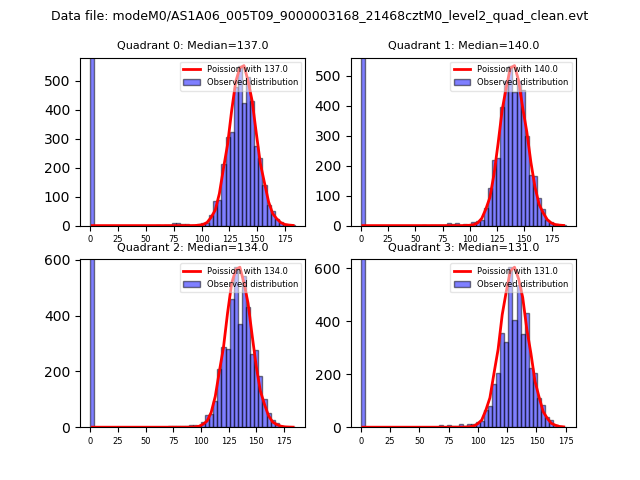
| Comparison with Poisson distribution Blue bars denote a histogram of data divided into 1 sec bins. Red curve is a Poisson curve with rate = median count rate of data. |
 |
 |
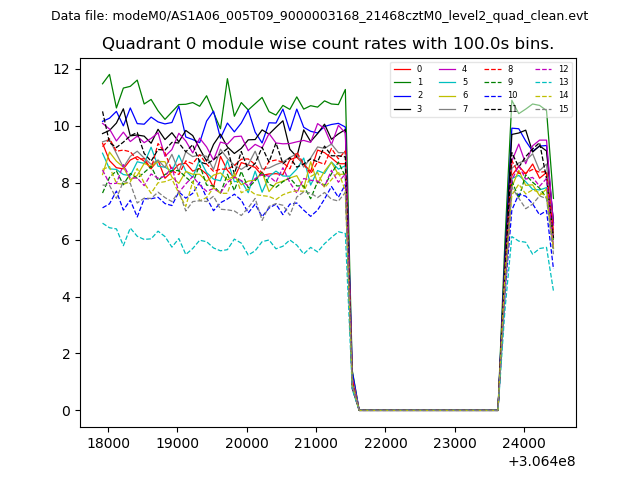
| Quadrant-wise count rates Data is divided into 100 sec bins |
 |
|
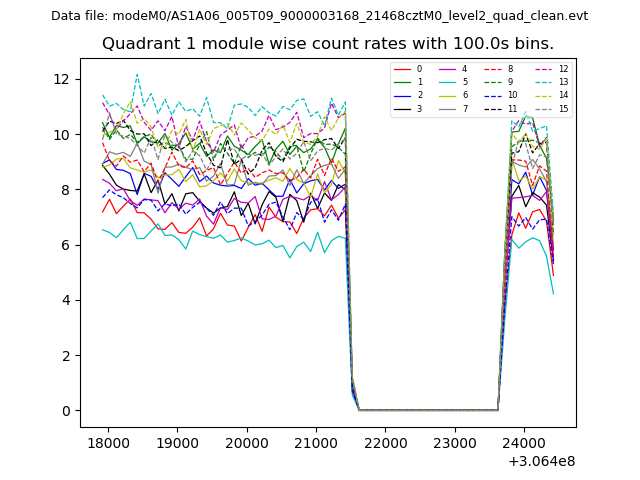
| Module-wise count rates for Quadrant A Data is divided into 100 sec bins |
 |
 |
| Module-wise count rates for Quadrant B Data is divided into 100 sec bins |
 |
 |
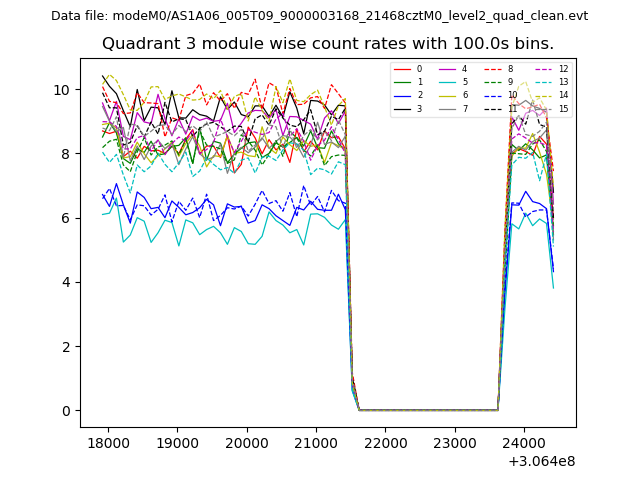
| Module-wise count rates for Quadrant C Data is divided into 100 sec bins |
 |
 |
| Module-wise count rates for Quadrant D Data is divided into 100 sec bins |
 |
 |
| Parameter | Plot |
|---|---|
| CZT HV Monitor |  |
| D_VDD | 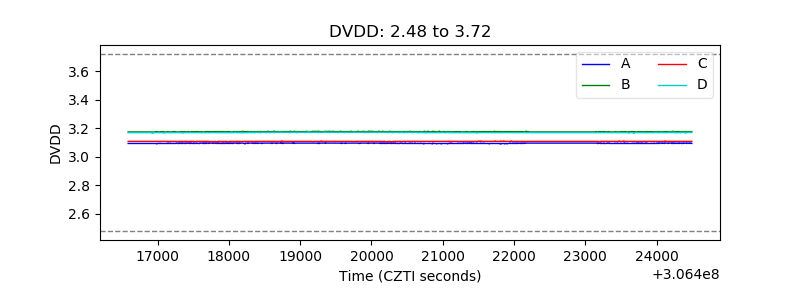 |
| Temperature 1 | 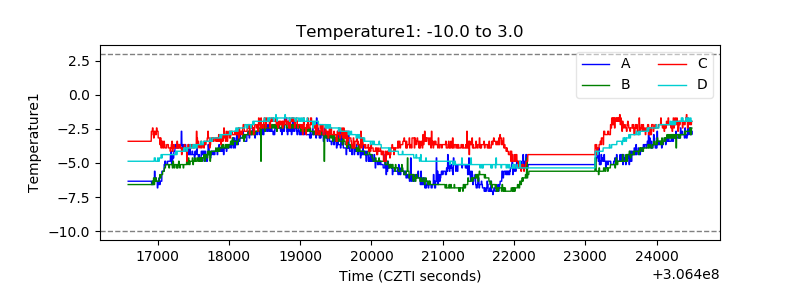 |
| Veto HV Monitor | 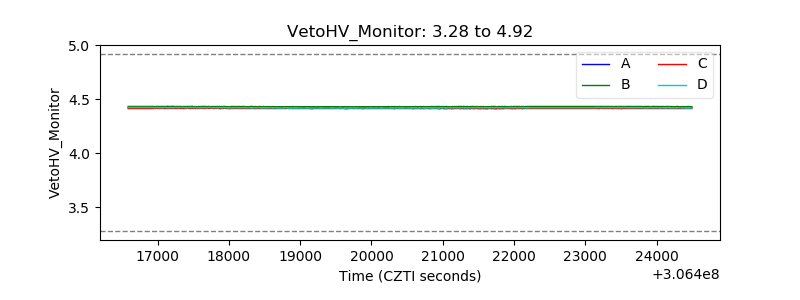 |
| Veto LLD | 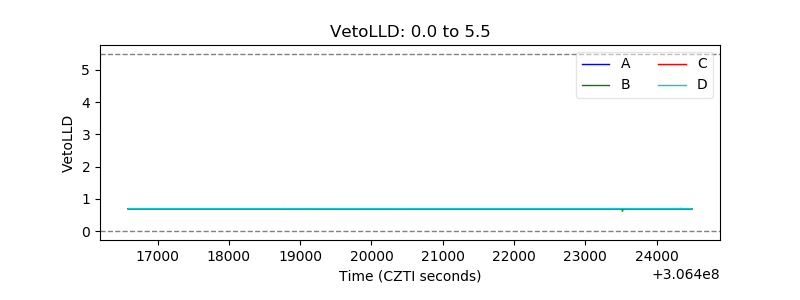 |
| Alpha Counter | 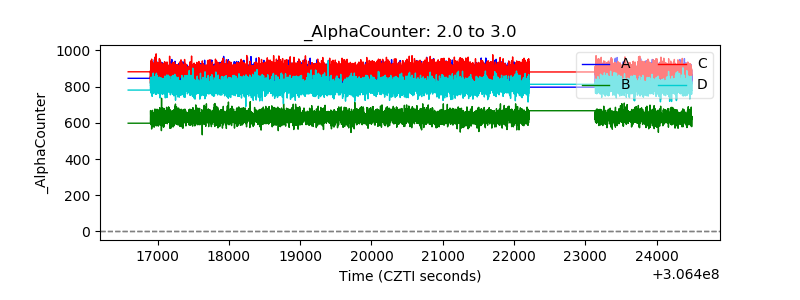 |
| _CPM_Rate | 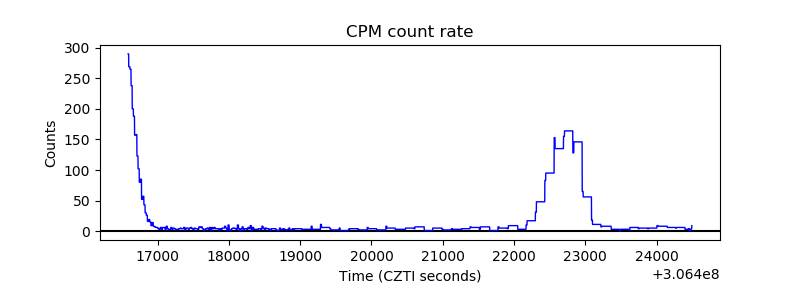 |
| CZT Counter | 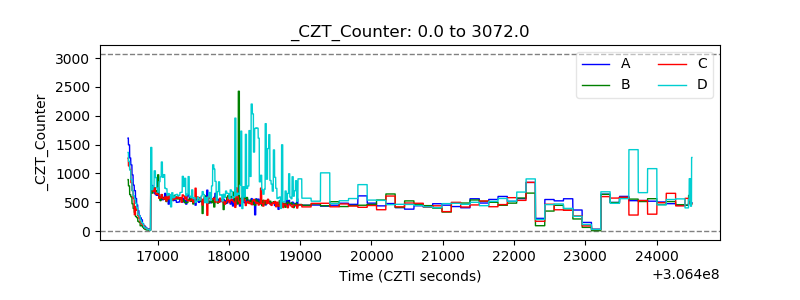 |
| +2.5 Volts monitor |  |
| +5 Volts monitor |  |
| _ROLL_ROT | 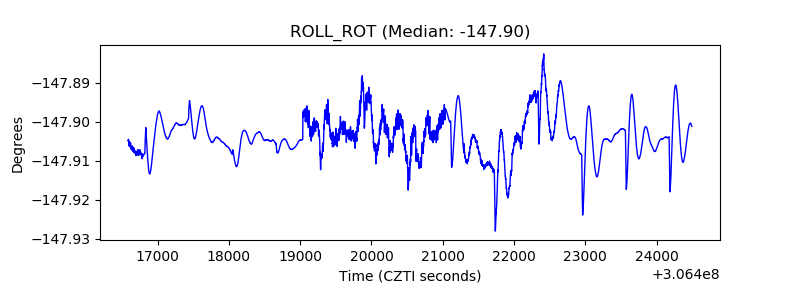 |
| _Roll_DEC | 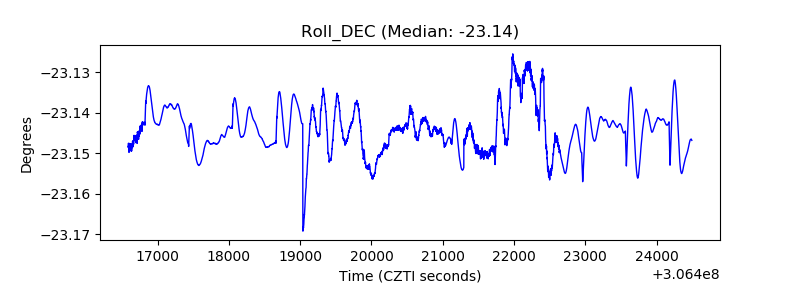 |
| _Roll_RA | 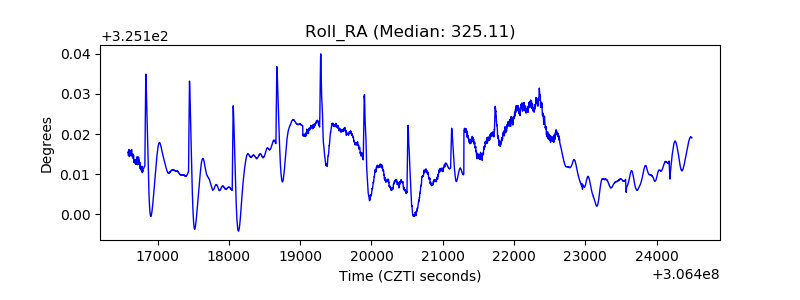 |
| Veto Counter | 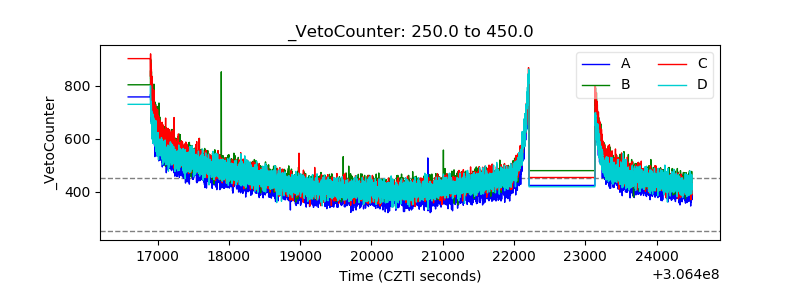 |