| Param | Original file | Final file |
|---|---|---|
| Filename | modeM0/AS1A06_005T09_9000003168_21469cztM0_level2.evt | modeM0/AS1A06_005T09_9000003168_21469cztM0_level2_quad_clean.evt |
| Size (bytes) | 517,075,200 | 98,786,880 |
| Size | 493.1 MB | 94.2 MB |
| Events in quadrant A | 3,543,670 | 626,063 |
| Events in quadrant B | 3,649,373 | 638,417 |
| Events in quadrant C | 3,562,546 | 618,910 |
| Events in quadrant D | 4,412,364 | 604,201 |
| Mode SS | |||
|---|---|---|---|
| Quadrant | BADHDUFLAG | Total packets | Discarded packets |
| A | 0 | 150 | 0 |
| B | 0 | 150 | 0 |
| C | 0 | 150 | 0 |
| D | 0 | 150 | 0 |
| Mode M9 | |||
|---|---|---|---|
| Quadrant | BADHDUFLAG | Total packets | Discarded packets |
| A | 0 | 14 | 0 |
| B | 0 | 14 | 0 |
| C | 0 | 14 | 0 |
| D | 0 | 14 | 0 |
| Mode M0 | |||
|---|---|---|---|
| Quadrant | BADHDUFLAG | Total packets | Discarded packets |
| A | 0 | 15100 | 2 |
| B | 0 | 15252 | 2 |
| C | 0 | 15172 | 2 |
| D | 0 | 17838 | 2 |
| Quadrant | Total seconds | Saturated seconds | Saturation percentage |
|---|---|---|---|
| A | 7236 | 177 | 2.446103% |
| B | 7235 | 213 | 2.944022% |
| C | 7235 | 245 | 3.386317% |
| D | 7236 | 204 | 2.819237% |
Noise dominated data is calculated using 1-second bins in cleaned event files. If a bin has >2000 counts, and if more than 50% of those come from <1% of pixels, then it is considered to be noise-dominated and hence unusable.
| Quadrant | # 1 sec bins | Bins with >0 counts | Bins with >2000 counts | High rate bins dominated by noise | Noise dominated (total time) | Noise dominated (detector-on time) | Marked lightcurve |
|---|---|---|---|---|---|---|---|
| A | 8686 | 7236 | 0 | 0 | 0.00% | 0.00% | 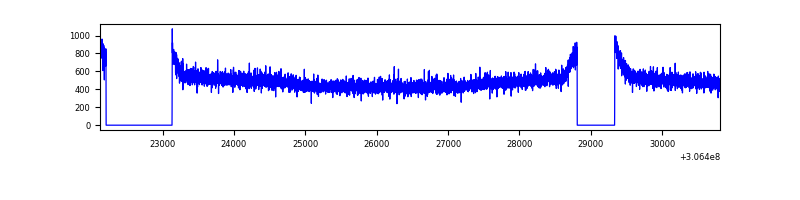 |
| B | 8685 | 7235 | 4 | 4 | 0.05% | 0.06% | 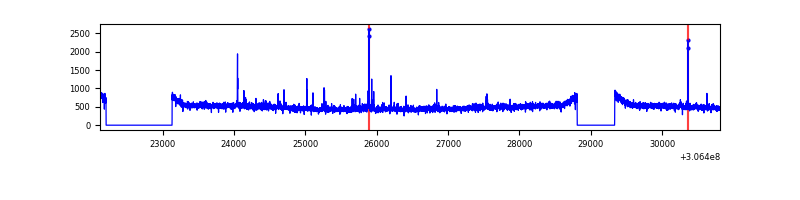 |
| C | 8685 | 7235 | 0 | 0 | 0.00% | 0.00% | 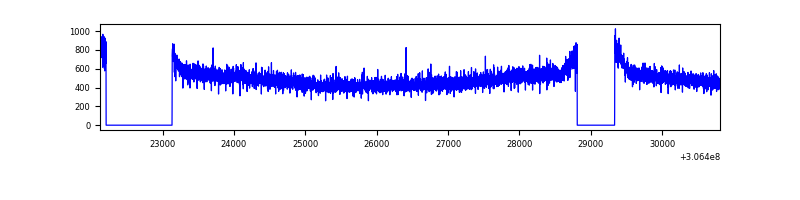 |
| D | 8686 | 7236 | 72 | 72 | 0.83% | 1.00% | 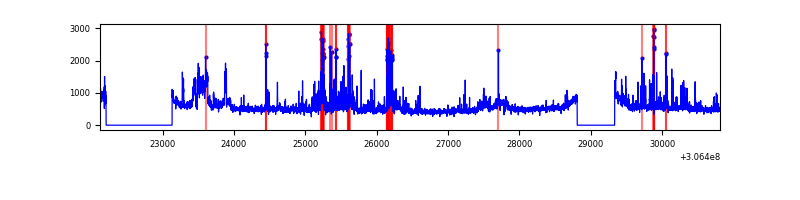 |
Top three noisy pixels from each quadrant. If the there are fewer than three noisy pixels in the level2.evt file, extra rows are filled as -1
| Pixel properties | Quadrant properties | ||||||
|---|---|---|---|---|---|---|---|
| Quadrant | DetID | PixID | Counts | Sigma | Mean | Median | Sigma |
| A | 13 | 254 | 10842 | 53.5 | 919 | 901 | 185.8 |
| A | 3 | 137 | 7909 | 37.71 | 919 | 901 | 185.8 |
| A | 0 | 226 | 7765 | 36.94 | 919 | 901 | 185.8 |
| B | 0 | 230 | 27442 | 151.59 | 911 | 888 | 175.2 |
| B | 12 | 111 | 21819 | 119.49 | 911 | 888 | 175.2 |
| B | 3 | 64 | 20480 | 111.85 | 911 | 888 | 175.2 |
| C | 14 | 238 | 138357 | 666.7 | 879 | 885 | 206.2 |
| C | 13 | 61 | 5909 | 24.36 | 879 | 885 | 206.2 |
| C | 3 | 202 | 2036 | 5.58 | 879 | 885 | 206.2 |
| D | 1 | 20 | 554984 | 2542.8 | 895 | 871 | 217.9 |
| D | 13 | 174 | 245961 | 1124.71 | 895 | 871 | 217.9 |
| D | 14 | 35 | 102230 | 465.13 | 895 | 871 | 217.9 |
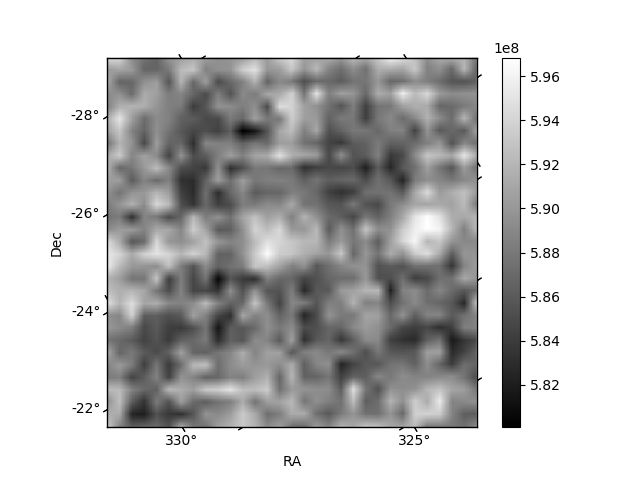
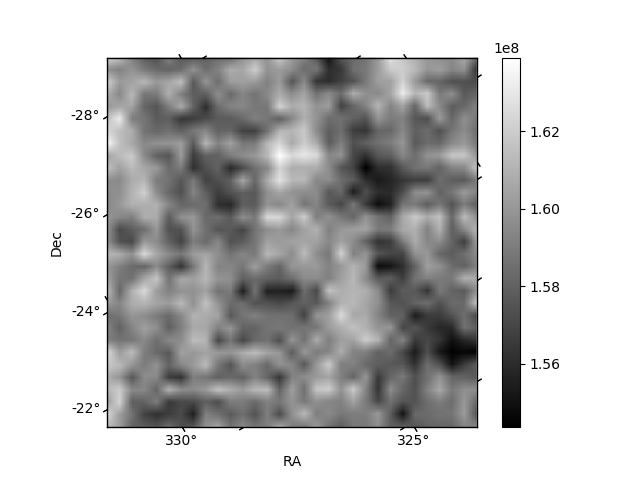
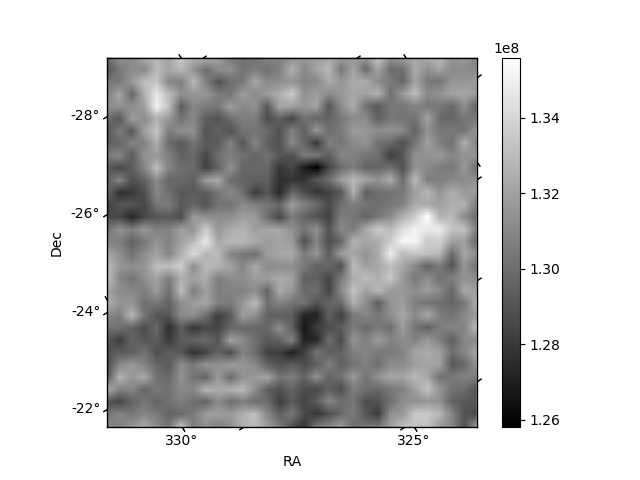
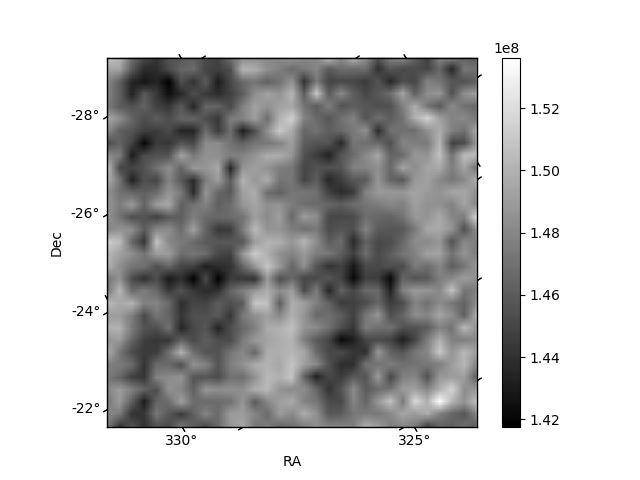
Histogram calculated using DETX and DETY for each event in the final _common_clean file
| Quadrant A | 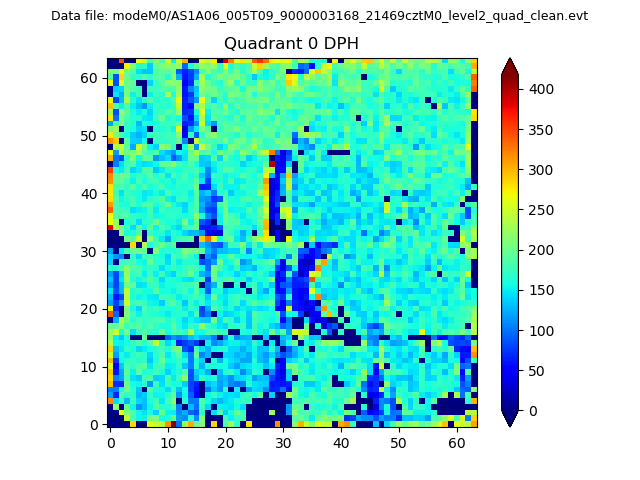 |
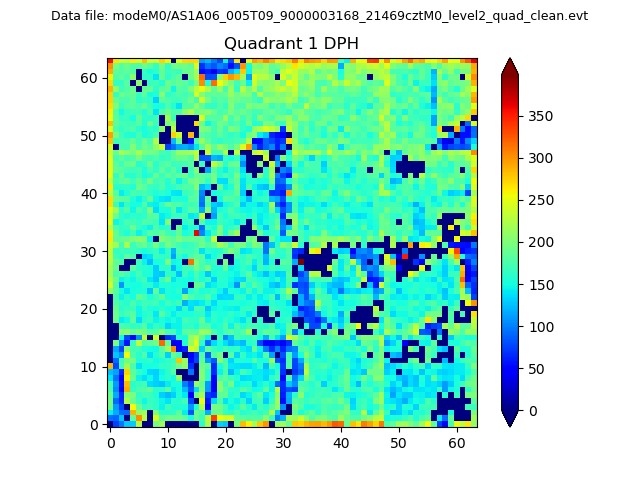 |
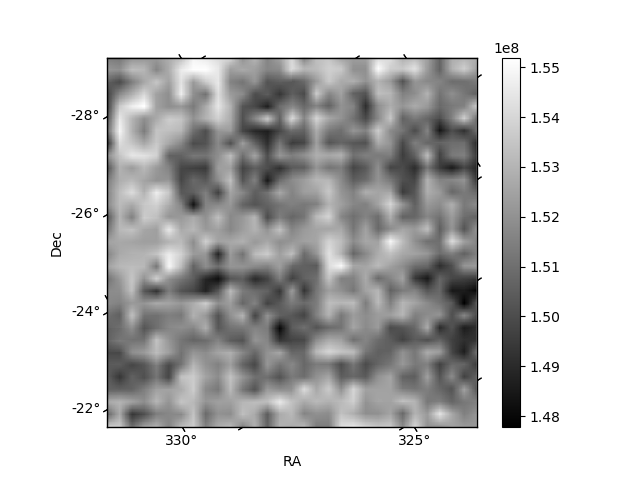
Quadrant B |
|---|---|---|---|
| Quadrant D | 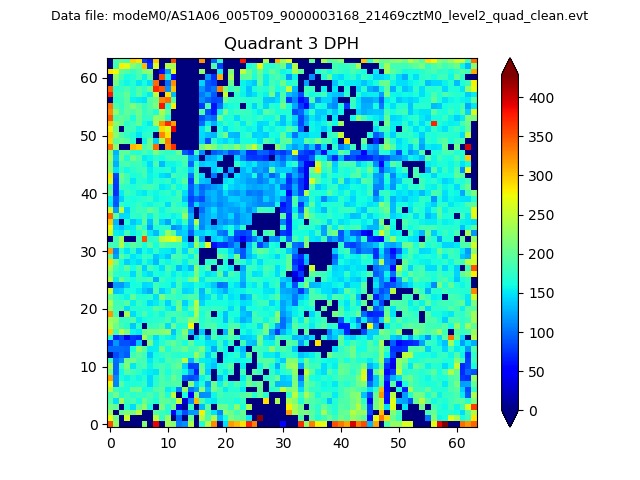 |
 |
Quadrant C |
| Plot type | Count rate plots | Images |
|---|---|---|
| Comparison with Poisson distribution Blue bars denote a histogram of data divided into 1 sec bins. Red curve is a Poisson curve with rate = median count rate of data. |
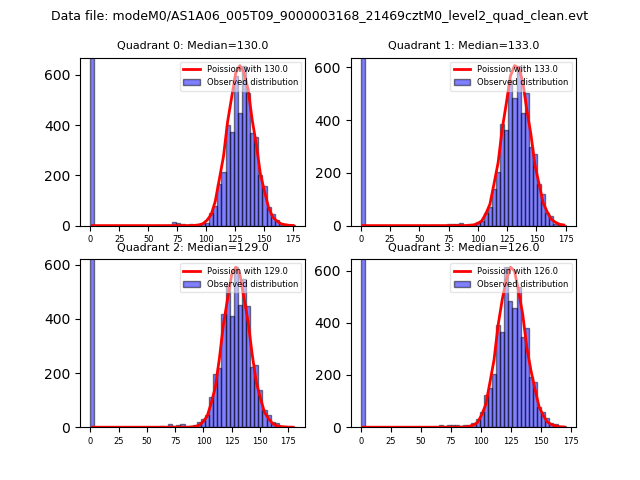 |
 |
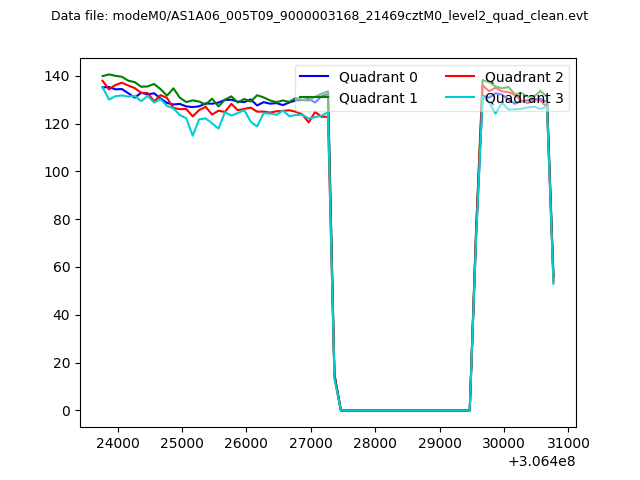
| Quadrant-wise count rates Data is divided into 100 sec bins |
 |
|
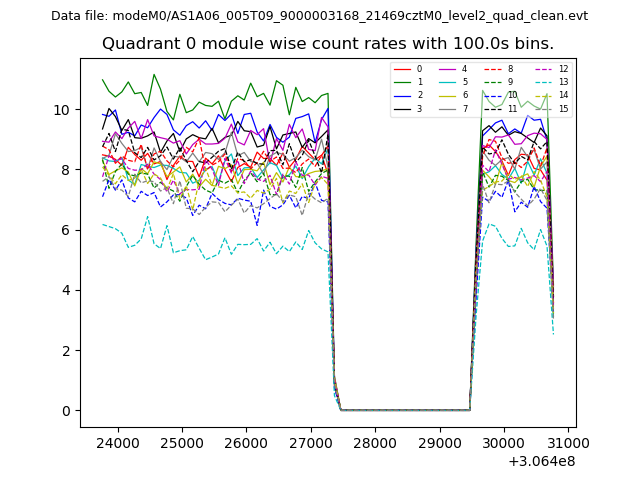
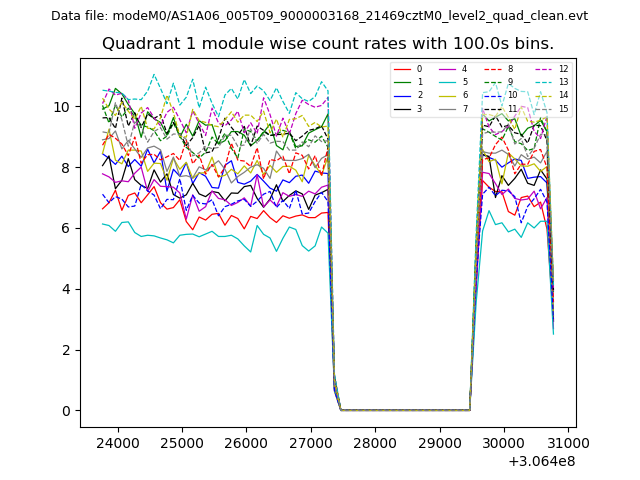
| Module-wise count rates for Quadrant A Data is divided into 100 sec bins |
 |
 |
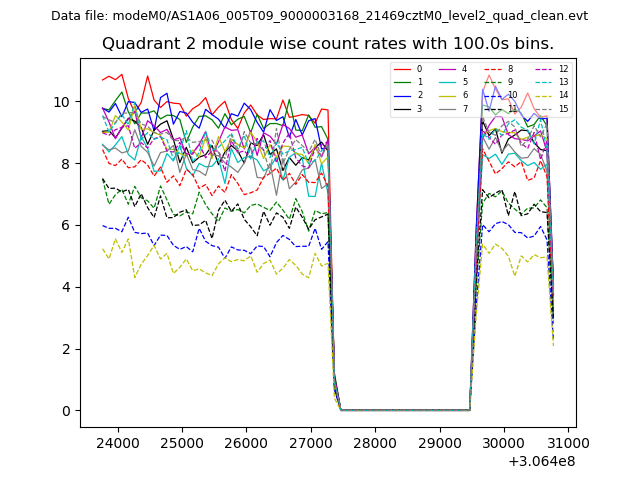
| Module-wise count rates for Quadrant B Data is divided into 100 sec bins |
 |
 |
| Module-wise count rates for Quadrant C Data is divided into 100 sec bins |
 |
 |
| Module-wise count rates for Quadrant D Data is divided into 100 sec bins |
 |
 |
| Parameter | Plot |
|---|---|
| CZT HV Monitor | 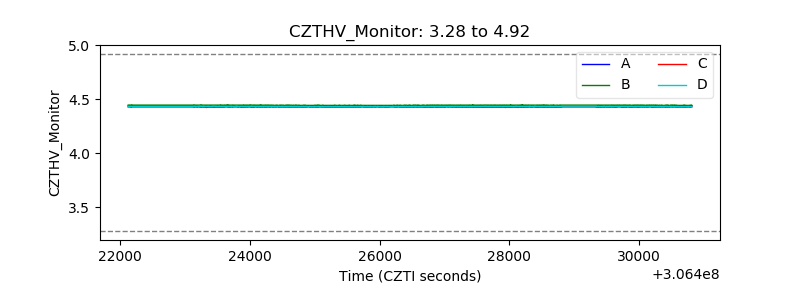 |
| D_VDD | 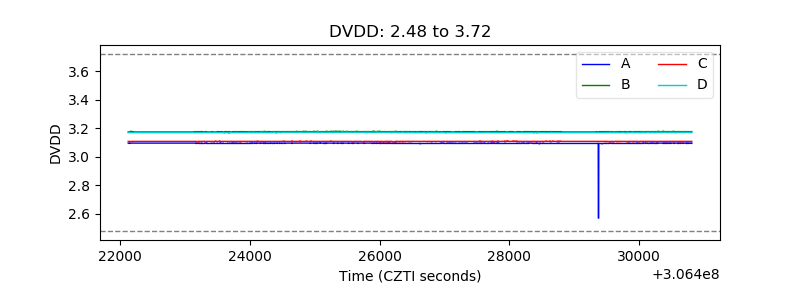 |
| Temperature 1 | 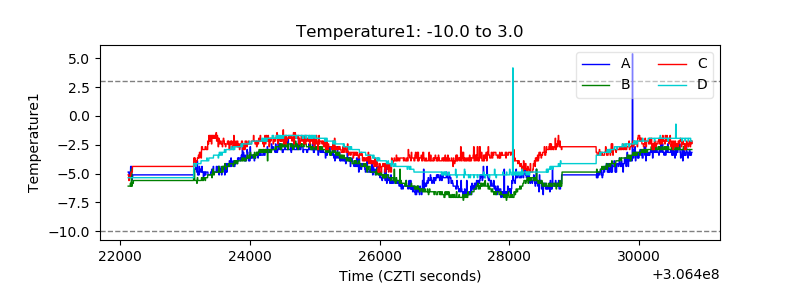 |
| Veto HV Monitor | 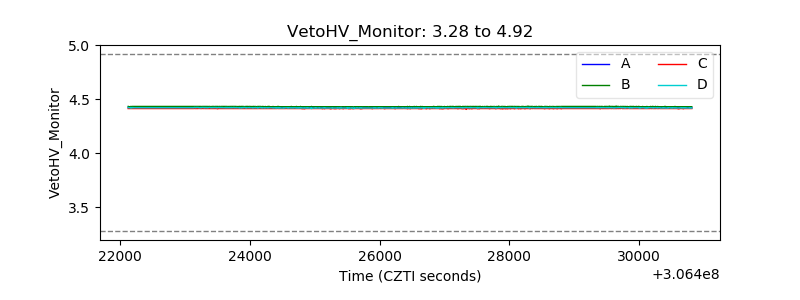 |
| Veto LLD | 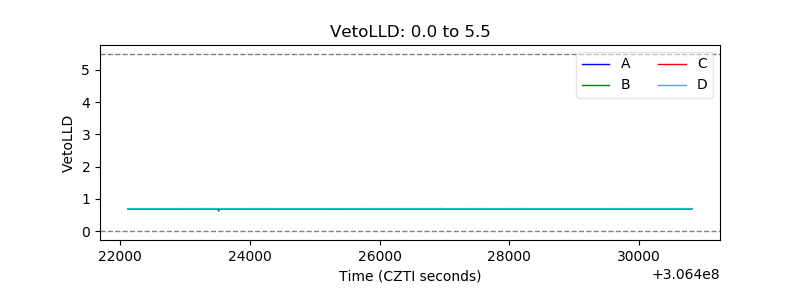 |
| Alpha Counter | 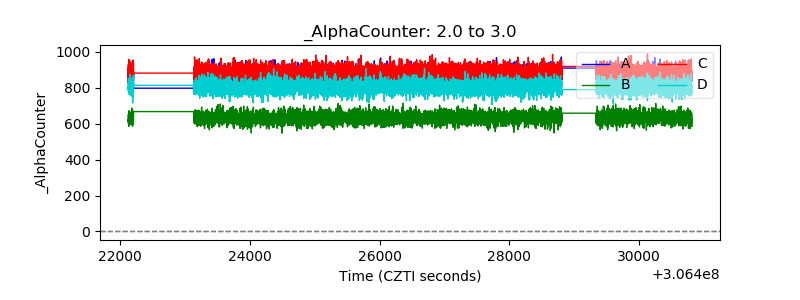 |
| _CPM_Rate | 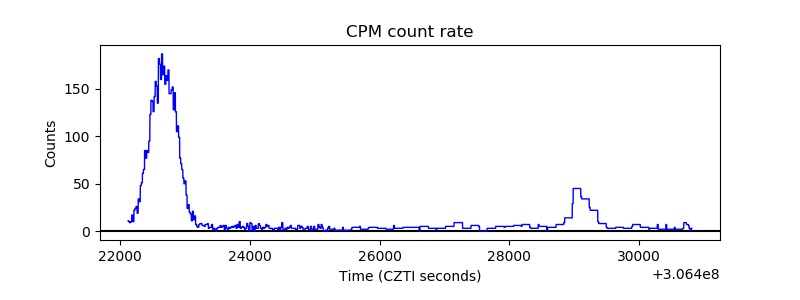 |
| CZT Counter | 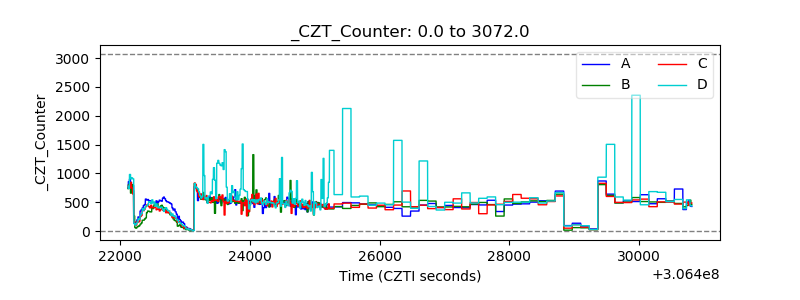 |
| +2.5 Volts monitor | 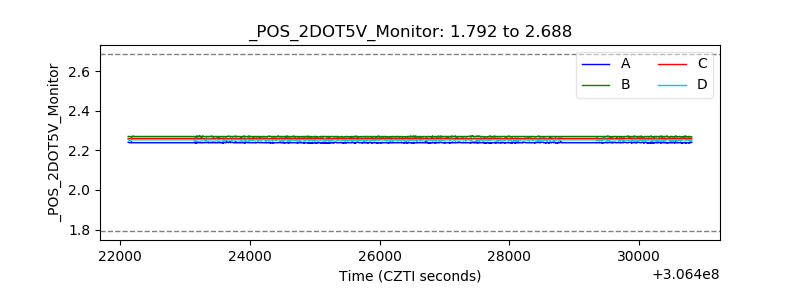 |
| +5 Volts monitor | 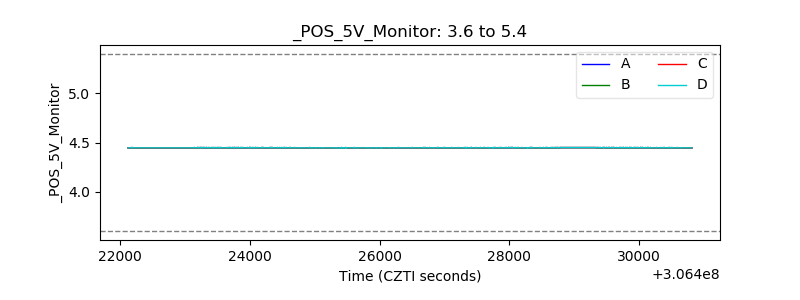 |
| _ROLL_ROT | 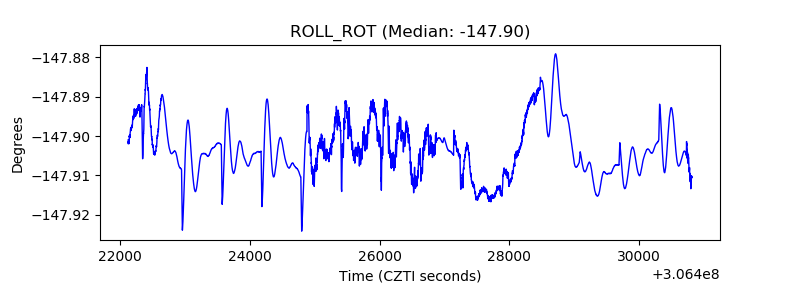 |
| _Roll_DEC |  |
| _Roll_RA | 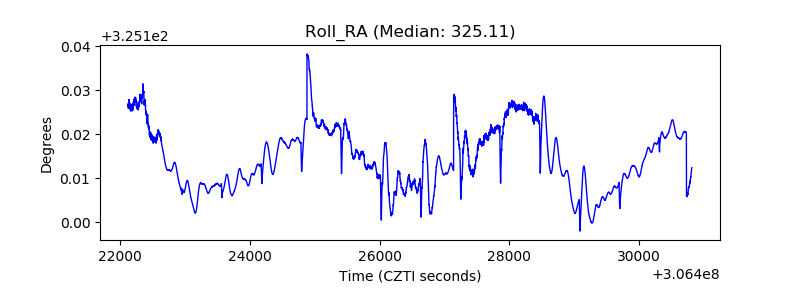 |
| Veto Counter | 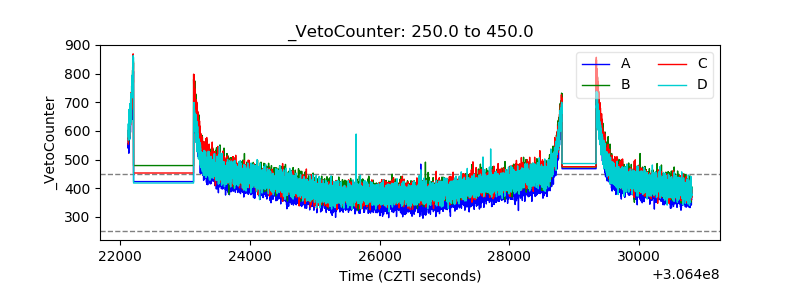 |