| Param | Original file | Final file |
|---|---|---|
| Filename | modeM0/AS1A06_005T09_9000003168_21471cztM0_level2.evt | modeM0/AS1A06_005T09_9000003168_21471cztM0_level2_quad_clean.evt |
| Size (bytes) | 547,220,160 | 105,877,440 |
| Size | 521.9 MB | 101.0 MB |
| Events in quadrant A | 3,623,111 | 679,577 |
| Events in quadrant B | 3,764,335 | 690,994 |
| Events in quadrant C | 3,633,122 | 667,781 |
| Events in quadrant D | 5,038,838 | 642,145 |
| Mode SS | |||
|---|---|---|---|
| Quadrant | BADHDUFLAG | Total packets | Discarded packets |
| A | 0 | 154 | 0 |
| B | 0 | 154 | 0 |
| C | 0 | 154 | 0 |
| D | 0 | 154 | 0 |
| Mode M9 | |||
|---|---|---|---|
| Quadrant | BADHDUFLAG | Total packets | Discarded packets |
| A | 0 | 3 | 0 |
| B | 0 | 3 | 0 |
| C | 0 | 3 | 0 |
| D | 0 | 3 | 0 |
| Mode M0 | |||
|---|---|---|---|
| Quadrant | BADHDUFLAG | Total packets | Discarded packets |
| A | 0 | 15747 | 3 |
| B | 0 | 16049 | 3 |
| C | 0 | 15807 | 3 |
| D | 0 | 20007 | 3 |
| Quadrant | Total seconds | Saturated seconds | Saturation percentage |
|---|---|---|---|
| A | 7555 | 117 | 1.548643% |
| B | 7556 | 160 | 2.117522% |
| C | 7556 | 137 | 1.813129% |
| D | 7555 | 363 | 4.804765% |
Noise dominated data is calculated using 1-second bins in cleaned event files. If a bin has >2000 counts, and if more than 50% of those come from <1% of pixels, then it is considered to be noise-dominated and hence unusable.
| Quadrant | # 1 sec bins | Bins with >0 counts | Bins with >2000 counts | High rate bins dominated by noise | Noise dominated (total time) | Noise dominated (detector-on time) | Marked lightcurve |
|---|---|---|---|---|---|---|---|
| A | 7855 | 7556 | 0 | 0 | 0.00% | 0.00% | 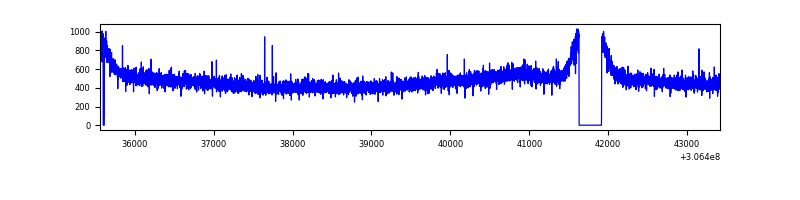 |
| B | 7856 | 7557 | 5 | 5 | 0.06% | 0.07% | 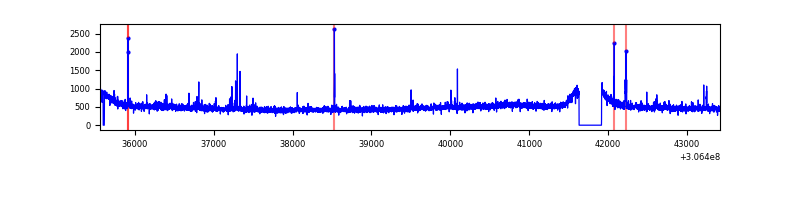 |
| C | 7856 | 7556 | 0 | 0 | 0.00% | 0.00% | 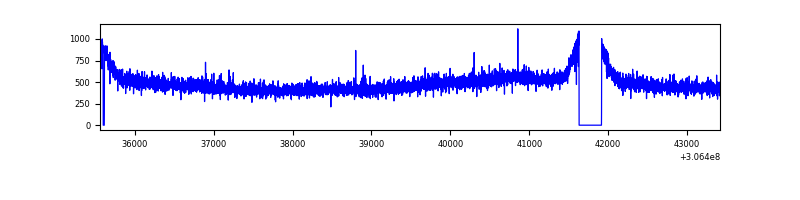 |
| D | 7855 | 7555 | 194 | 194 | 2.47% | 2.57% | 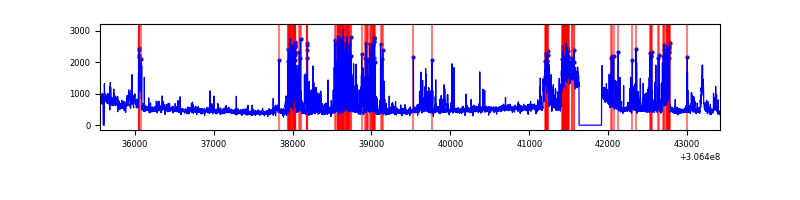 |
Top three noisy pixels from each quadrant. If the there are fewer than three noisy pixels in the level2.evt file, extra rows are filled as -1
| Pixel properties | Quadrant properties | ||||||
|---|---|---|---|---|---|---|---|
| Quadrant | DetID | PixID | Counts | Sigma | Mean | Median | Sigma |
| A | 13 | 254 | 10066 | 48.04 | 940 | 920 | 190.4 |
| A | 3 | 137 | 8356 | 39.06 | 940 | 920 | 190.4 |
| A | 0 | 226 | 8119 | 37.81 | 940 | 920 | 190.4 |
| B | 0 | 190 | 44902 | 242.35 | 932 | 908 | 181.5 |
| B | 0 | 230 | 29146 | 155.56 | 932 | 908 | 181.5 |
| B | 12 | 111 | 22816 | 120.69 | 932 | 908 | 181.5 |
| C | 14 | 238 | 138418 | 648.81 | 897 | 904 | 211.9 |
| C | 13 | 61 | 6168 | 24.84 | 897 | 904 | 211.9 |
| C | 3 | 202 | 2045 | 5.38 | 897 | 904 | 211.9 |
| D | 13 | 174 | 840728 | 3821.07 | 899 | 872 | 219.8 |
| D | 1 | 20 | 464931 | 2111.32 | 899 | 872 | 219.8 |
| D | 13 | 153 | 117949 | 532.66 | 899 | 872 | 219.8 |
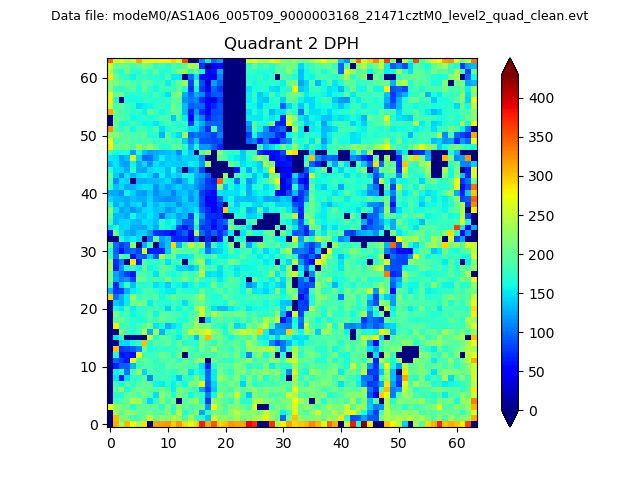
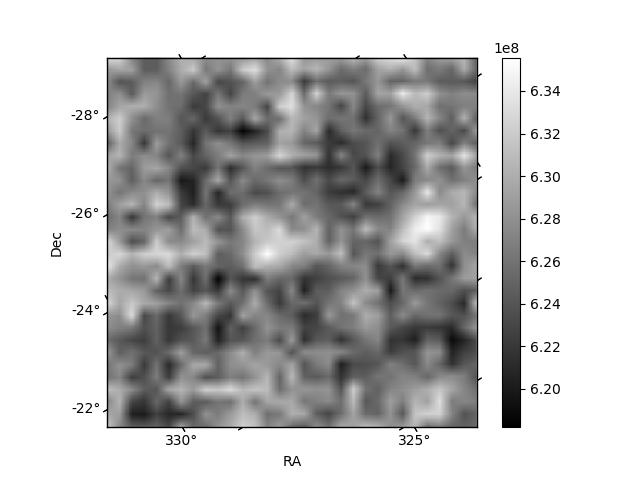
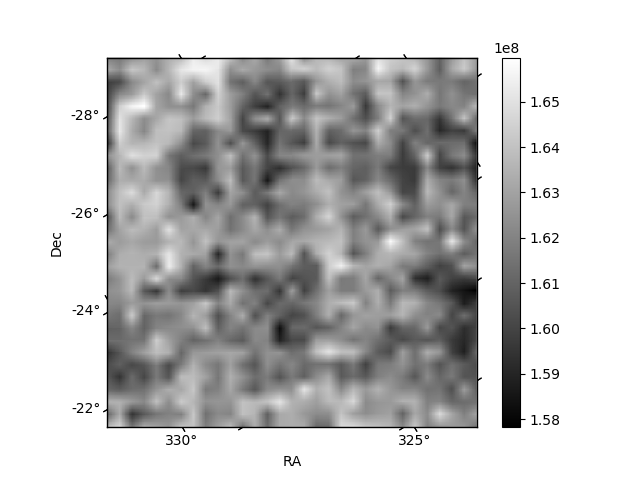
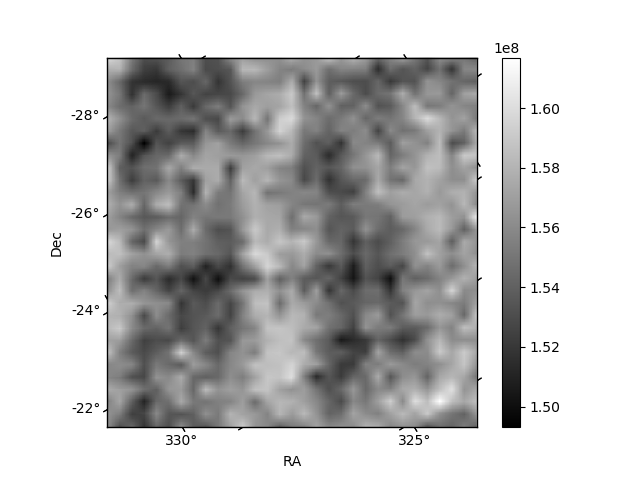
Histogram calculated using DETX and DETY for each event in the final _common_clean file
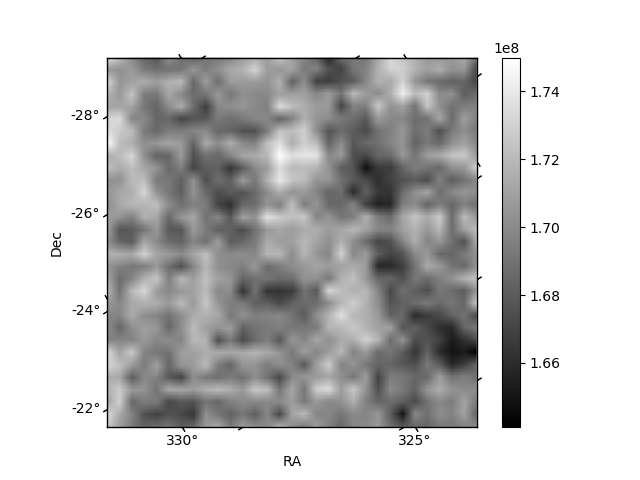
| Quadrant A | 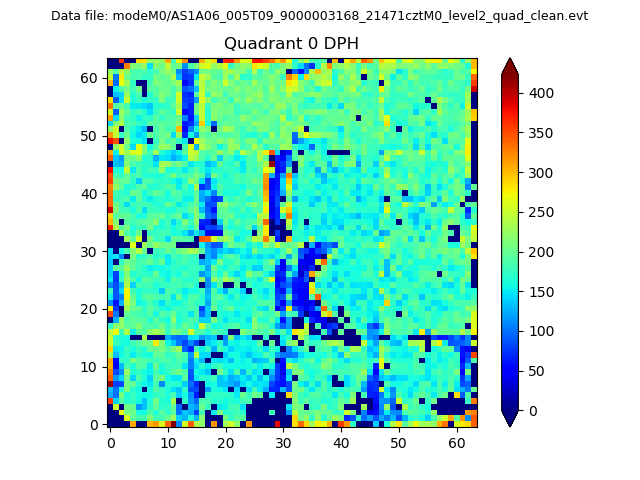 |
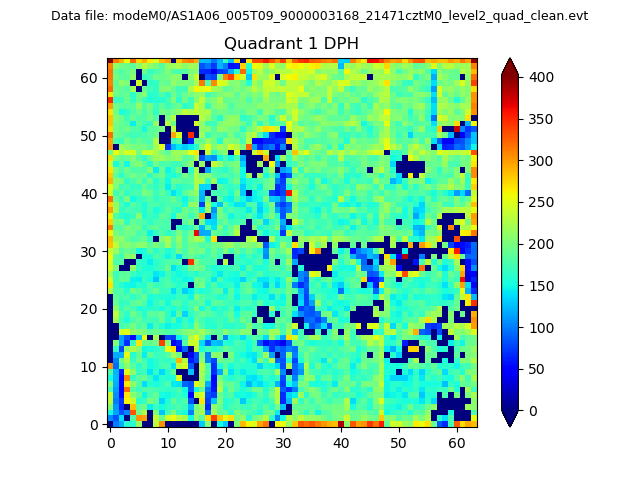 |
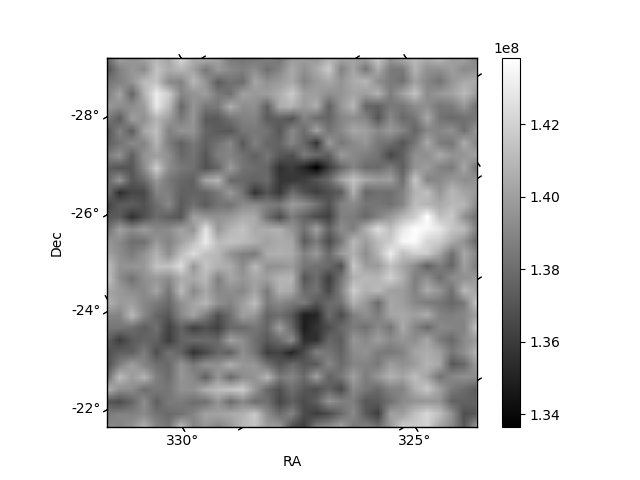
Quadrant B |
|---|---|---|---|
| Quadrant D | 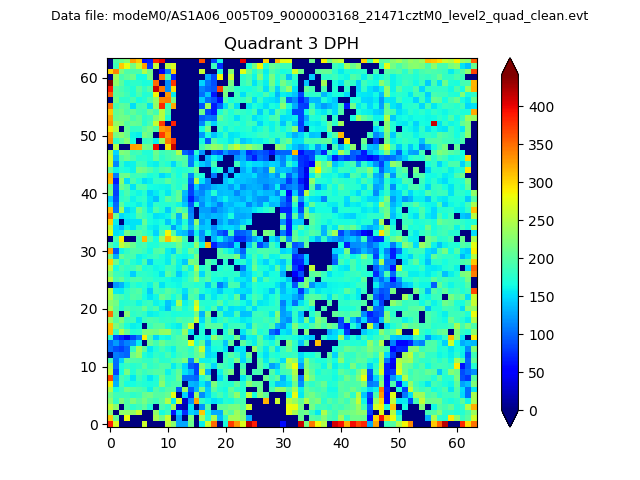 |
 |
Quadrant C |
| Plot type | Count rate plots | Images |
|---|---|---|
| Comparison with Poisson distribution Blue bars denote a histogram of data divided into 1 sec bins. Red curve is a Poisson curve with rate = median count rate of data. |
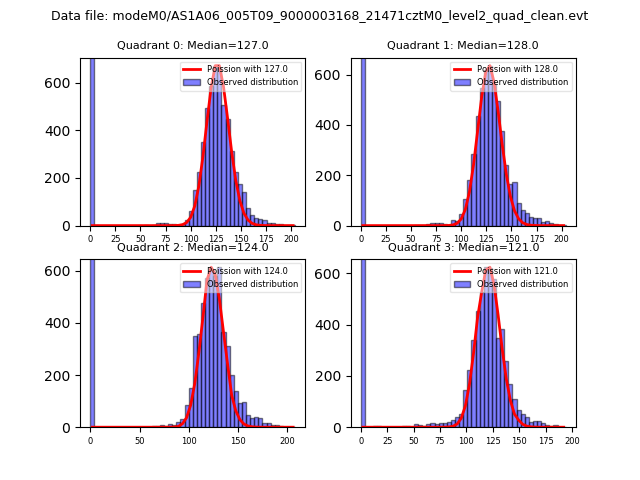 |
 |
| Quadrant-wise count rates Data is divided into 100 sec bins |
 |
|
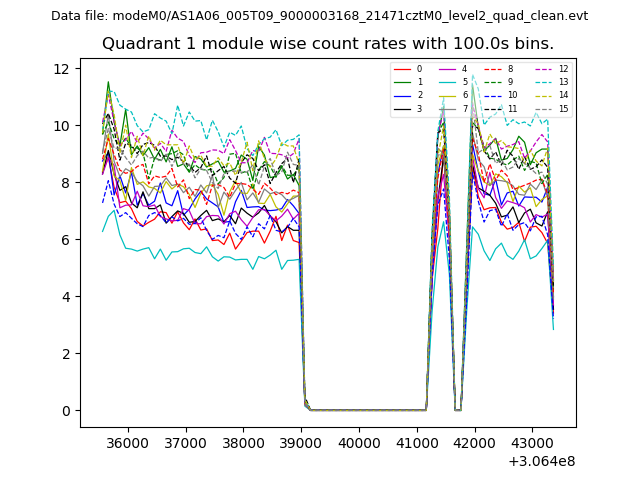
| Module-wise count rates for Quadrant A Data is divided into 100 sec bins |
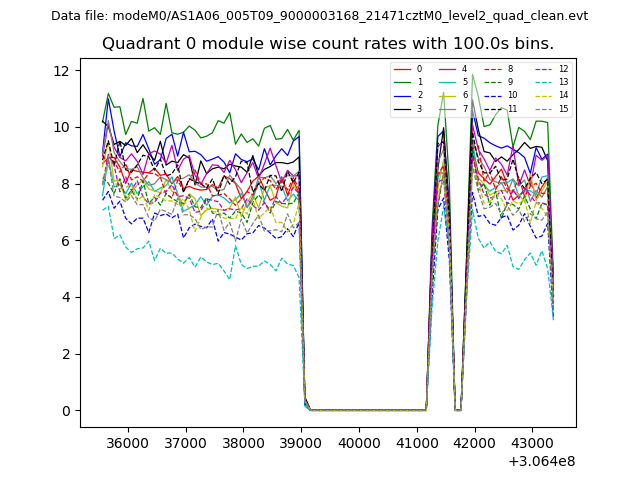 |
 |
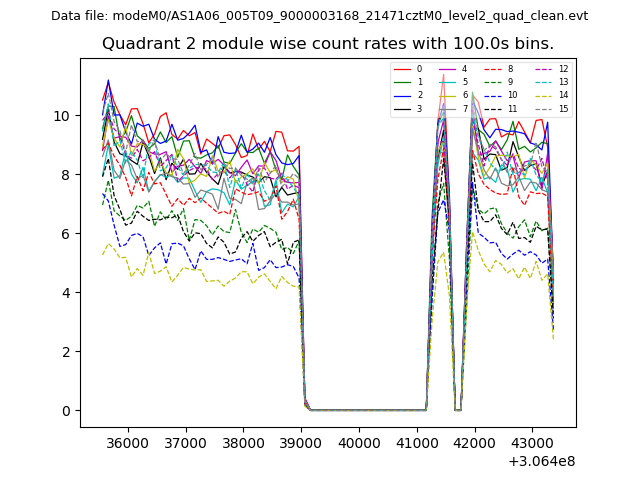
| Module-wise count rates for Quadrant B Data is divided into 100 sec bins |
 |
 |
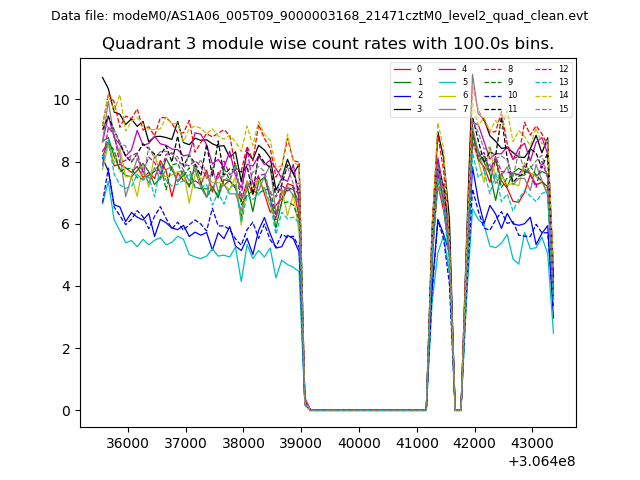
| Module-wise count rates for Quadrant C Data is divided into 100 sec bins |
 |
 |
| Module-wise count rates for Quadrant D Data is divided into 100 sec bins |
 |
 |
| Parameter | Plot |
|---|---|
| CZT HV Monitor | 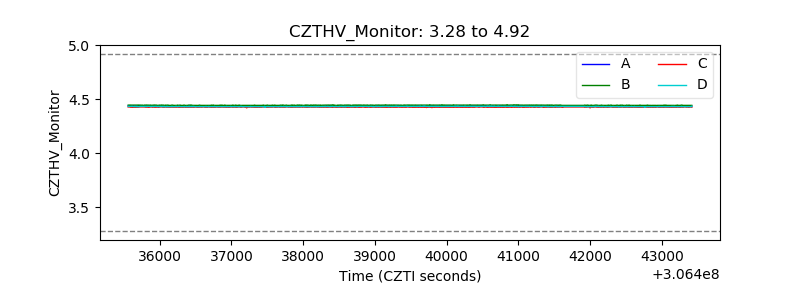 |
| D_VDD | 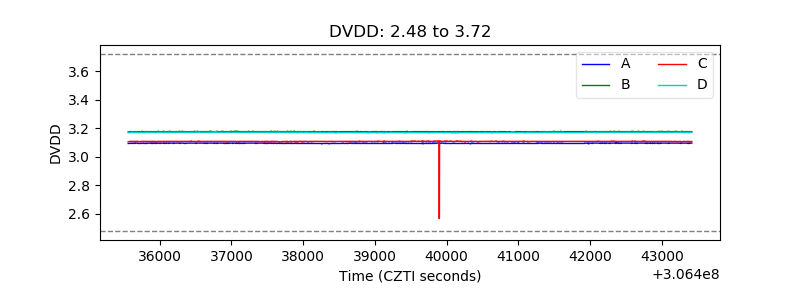 |
| Temperature 1 | 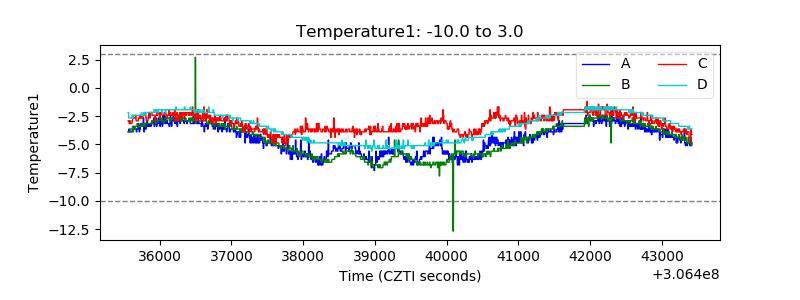 |
| Veto HV Monitor | 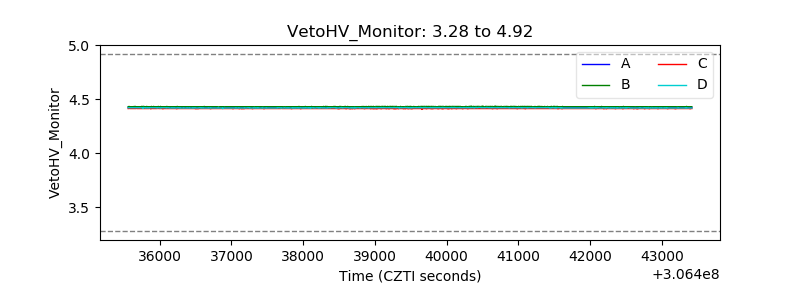 |
| Veto LLD | 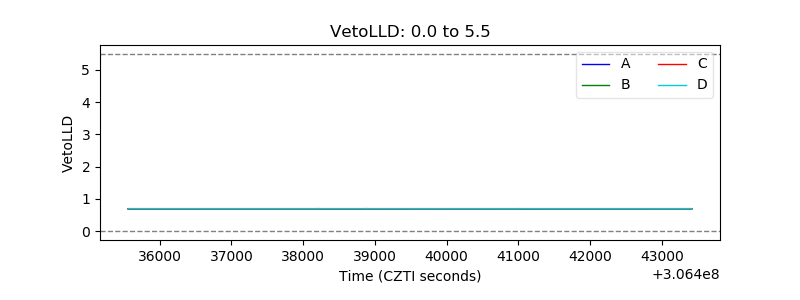 |
| Alpha Counter |  |
| _CPM_Rate | 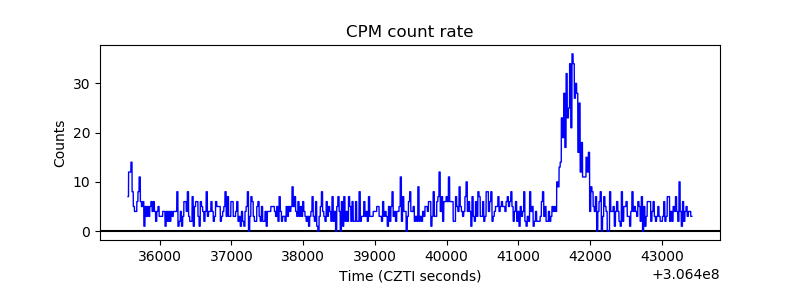 |
| CZT Counter | 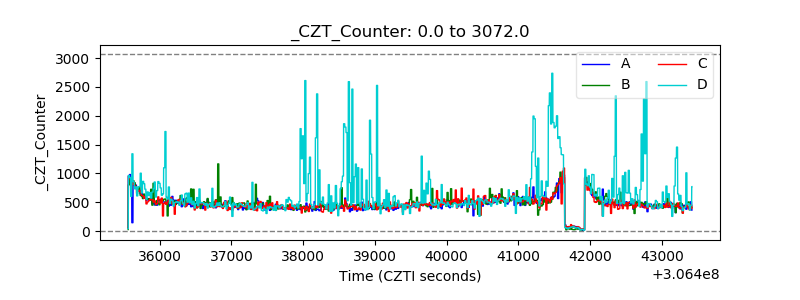 |
| +2.5 Volts monitor |  |
| +5 Volts monitor |  |
| _ROLL_ROT | 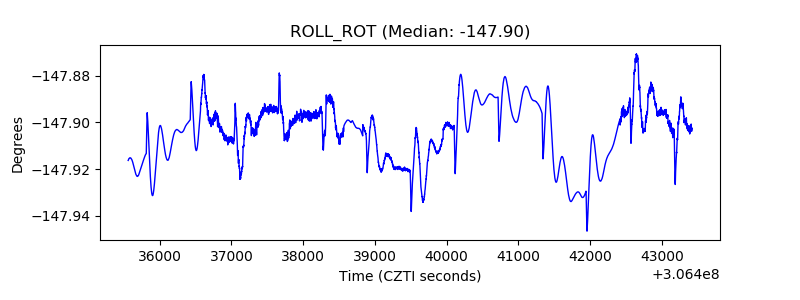 |
| _Roll_DEC | 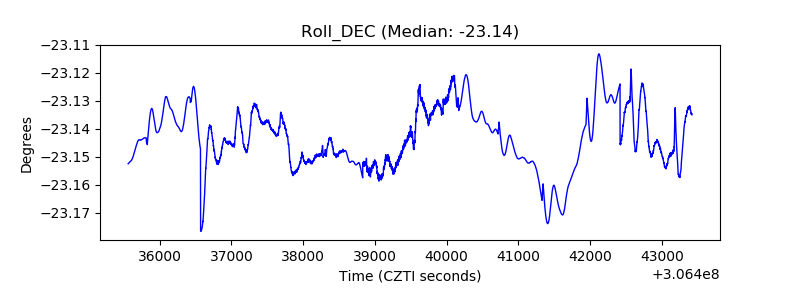 |
| _Roll_RA | 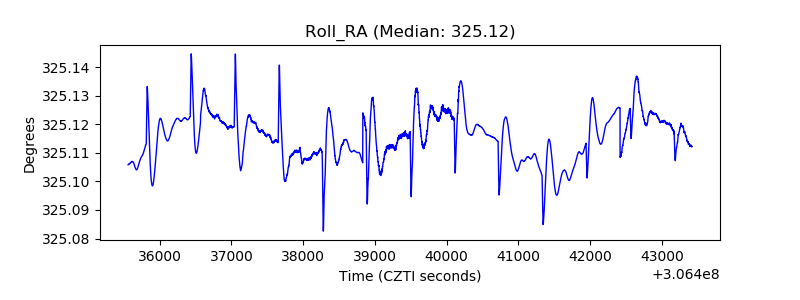 |
| Veto Counter | 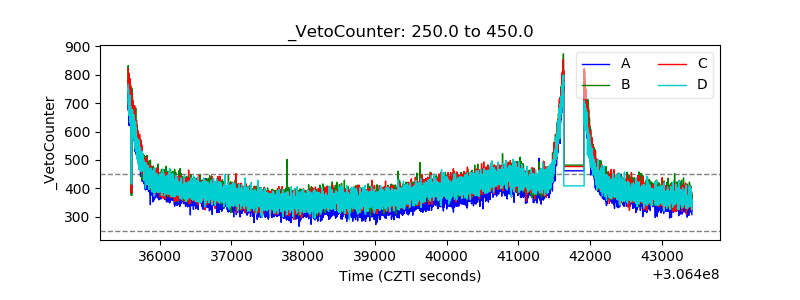 |