| Param | Original file | Final file |
|---|---|---|
| Filename | modeM0/AS1A06_009T02_9000003170cztM0_level2.fits | modeM0/AS1A06_009T02_9000003170cztM0_level2_quad_clean.evt |
| Size (bytes) | 118,036,800 | 109,857,600 |
| Size | 112.6 MB | 104.8 MB |
| Events in quadrant A | 716,750 | 643,366 |
| Events in quadrant B | 687,560 | 643,418 |
| Events in quadrant C | 701,324 | 620,608 |
| Events in quadrant D | 593,784 | 543,454 |
| Mode M9 | |||
|---|---|---|---|
| Quadrant | BADHDUFLAG | Total packets | Discarded packets |
| A | 0 | 15 | 0 |
| B | 0 | 15 | 0 |
| C | 0 | 15 | 0 |
| D | 0 | 15 | 0 |
| Mode SS | |||
|---|---|---|---|
| Quadrant | BADHDUFLAG | Total packets | Discarded packets |
| A | 0 | 256 | 0 |
| B | 0 | 256 | 0 |
| C | 0 | 256 | 0 |
| D | 0 | 256 | 0 |
| Mode M0 | |||
|---|---|---|---|
| Quadrant | BADHDUFLAG | Total packets | Discarded packets |
| A | 0 | 25612 | 0 |
| B | 0 | 26979 | 0 |
| C | 0 | 26264 | 0 |
| D | 0 | 39035 | 0 |
| Quadrant | Total seconds | Saturated seconds | Saturation percentage |
|---|---|---|---|
| A | 12668 | 41 | 0.323650% |
| B | 12668 | 78 | 0.615725% |
| C | 12668 | 107 | 0.844648% |
| D | 12668 | 685 | 5.407326% |
Noise dominated data is calculated using 1-second bins in cleaned event files. If a bin has >2000 counts, and if more than 50% of those come from <1% of pixels, then it is considered to be noise-dominated and hence unusable.
| Quadrant | # 1 sec bins | Bins with >0 counts | Bins with >2000 counts | High rate bins dominated by noise | Noise dominated (total time) | Noise dominated (detector-on time) | Marked lightcurve |
|---|---|---|---|---|---|---|---|
| A | 14193 | 12667 | 0 | 0 | 0.00% | 0.00% |  |
| B | 14193 | 12665 | 0 | 0 | 0.00% | 0.00% |  |
| C | 14193 | 12666 | 0 | 0 | 0.00% | 0.00% |  |
| D | 14193 | 12663 | 0 | 0 | 0.00% | 0.00% |  |
Top three noisy pixels from each quadrant. If the there are fewer than three noisy pixels in the level2.evt file, extra rows are filled as -1
| Pixel properties | Quadrant properties | ||||||
|---|---|---|---|---|---|---|---|
| Quadrant | DetID | PixID | Counts | Sigma | Mean | Median | Sigma |
| A | 0 | 29 | 668 | 10.27 | 186 | 175 | 48.0 |
| A | 7 | 110 | 625 | 9.38 | 186 | 175 | 48.0 |
| A | 9 | 19 | 547 | 7.75 | 186 | 175 | 48.0 |
| B | 2 | 9 | 591 | 11.25 | 181 | 173 | 37.1 |
| B | 2 | 8 | 507 | 8.99 | 181 | 173 | 37.1 |
| B | 2 | 245 | 459 | 7.7 | 181 | 173 | 37.1 |
| C | 3 | 158 | 520 | 6.99 | 184 | 172 | 49.8 |
| C | 1 | 81 | 506 | 6.71 | 184 | 172 | 49.8 |
| C | 1 | 80 | 505 | 6.69 | 184 | 172 | 49.8 |
| D | 15 | 46 | 439 | 6.16 | 169 | 154 | 46.3 |
| D | 7 | 3 | 438 | 6.14 | 169 | 154 | 46.3 |
| D | 3 | 14 | 435 | 6.07 | 169 | 154 | 46.3 |
Histogram calculated using DETX and DETY for each event in the final _common_clean file
| Quadrant A | 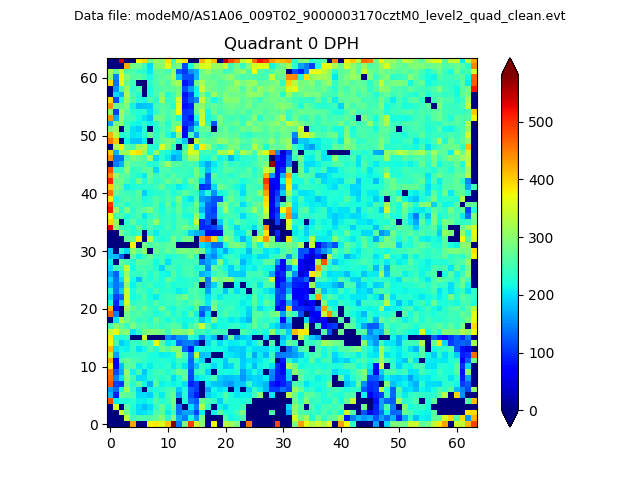 |
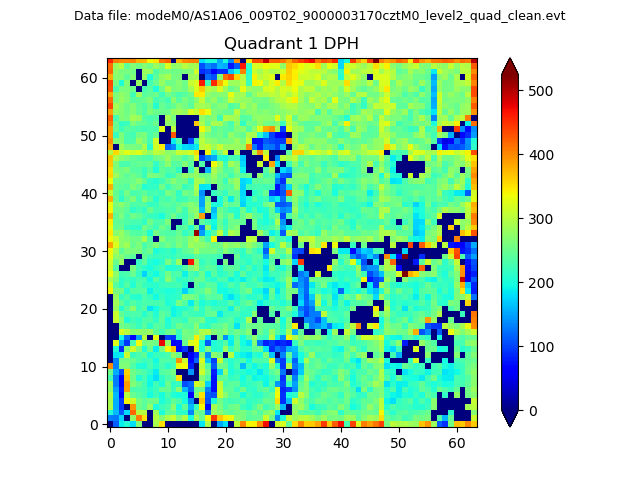 |
Quadrant B |
|---|---|---|---|
| Quadrant D |  |
 |
Quadrant C |
| Plot type | Count rate plots | Images |
|---|---|---|
| Comparison with Poisson distribution Blue bars denote a histogram of data divided into 1 sec bins. Red curve is a Poisson curve with rate = median count rate of data. |
 |
 |
| Quadrant-wise count rates Data is divided into 100 sec bins |
 |
|
| Module-wise count rates for Quadrant A Data is divided into 100 sec bins |
 |
 |
| Module-wise count rates for Quadrant B Data is divided into 100 sec bins |
 |
 |
| Module-wise count rates for Quadrant C Data is divided into 100 sec bins |
 |
 |
| Module-wise count rates for Quadrant D Data is divided into 100 sec bins |
 |
 |
| Parameter | Plot |
|---|---|
| CZT HV Monitor |  |
| D_VDD |  |
| Temperature 1 |  |
| Veto HV Monitor |  |
| Veto LLD |  |
| Alpha Counter |  |
| _CPM_Rate |  |
| CZT Counter |  |
| +2.5 Volts monitor |  |
| +5 Volts monitor |  |
| _ROLL_ROT |  |
| _Roll_DEC |  |
| _Roll_RA |  |
| Veto Counter |  |