| Param | Original file | Final file |
|---|---|---|
| Filename | modeM0/AS1T03_138T02_9000003172cztM0_level2.fits | modeM0/AS1T03_138T02_9000003172cztM0_level2_quad_clean.evt |
| Size (bytes) | 58,812,480 | 39,712,320 |
| Size | 56.1 MB | 37.9 MB |
| Events in quadrant A | 363,272 | 206,584 |
| Events in quadrant B | 346,908 | 208,593 |
| Events in quadrant C | 351,386 | 194,469 |
| Events in quadrant D | 301,994 | 173,998 |
| Mode M9 | |||
|---|---|---|---|
| Quadrant | BADHDUFLAG | Total packets | Discarded packets |
| A | 0 | 10 | 0 |
| B | 0 | 10 | 0 |
| C | 0 | 10 | 0 |
| D | 0 | 10 | 0 |
| Mode SS | |||
|---|---|---|---|
| Quadrant | BADHDUFLAG | Total packets | Discarded packets |
| A | 0 | 122 | 0 |
| B | 0 | 122 | 0 |
| C | 0 | 122 | 0 |
| D | 0 | 122 | 0 |
| Mode M0 | |||
|---|---|---|---|
| Quadrant | BADHDUFLAG | Total packets | Discarded packets |
| A | 0 | 12210 | 0 |
| B | 0 | 13054 | 0 |
| C | 0 | 12484 | 0 |
| D | 0 | 15302 | 0 |
| Quadrant | Total seconds | Saturated seconds | Saturation percentage |
|---|---|---|---|
| A | 5980 | 5 | 0.083612% |
| B | 5980 | 17 | 0.284281% |
| C | 5980 | 41 | 0.685619% |
| D | 5980 | 134 | 2.240803% |
Noise dominated data is calculated using 1-second bins in cleaned event files. If a bin has >2000 counts, and if more than 50% of those come from <1% of pixels, then it is considered to be noise-dominated and hence unusable.
| Quadrant | # 1 sec bins | Bins with >0 counts | Bins with >2000 counts | High rate bins dominated by noise | Noise dominated (total time) | Noise dominated (detector-on time) | Marked lightcurve |
|---|---|---|---|---|---|---|---|
| A | 6999 | 5978 | 0 | 0 | 0.00% | 0.00% |  |
| B | 7000 | 5979 | 0 | 0 | 0.00% | 0.00% | 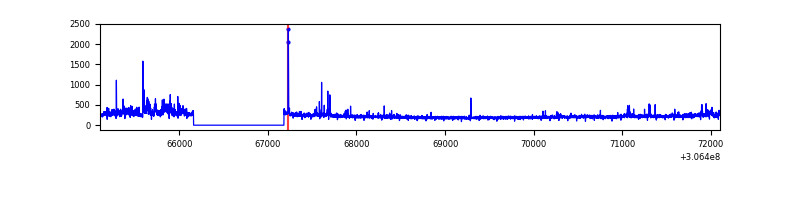 |
| C | 7000 | 5980 | 0 | 0 | 0.00% | 0.00% |  |
| D | 7000 | 5980 | 0 | 0 | 0.00% | 0.00% | 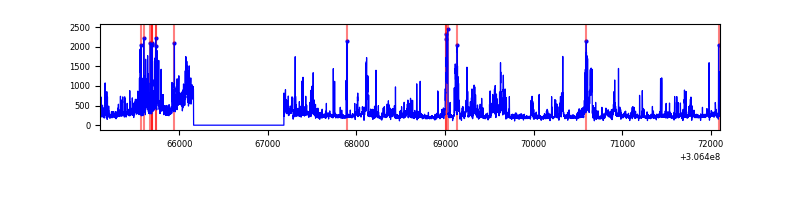 |
Top three noisy pixels from each quadrant. If the there are fewer than three noisy pixels in the level2.evt file, extra rows are filled as -1
| Pixel properties | Quadrant properties | ||||||
|---|---|---|---|---|---|---|---|
| Quadrant | DetID | PixID | Counts | Sigma | Mean | Median | Sigma |
| A | 0 | 29 | 339 | 9.92 | 94 | 88 | 25.3 |
| A | 7 | 110 | 293 | 8.1 | 94 | 88 | 25.3 |
| A | 0 | 30 | 288 | 7.9 | 94 | 88 | 25.3 |
| B | 2 | 9 | 281 | 9.41 | 91 | 87 | 20.6 |
| B | 2 | 8 | 237 | 7.27 | 91 | 87 | 20.6 |
| B | 3 | 17 | 232 | 7.03 | 91 | 87 | 20.6 |
| C | 12 | 241 | 249 | 6.32 | 92 | 87 | 25.6 |
| C | 2 | 191 | 240 | 5.97 | 92 | 87 | 25.6 |
| C | 9 | 209 | 234 | 5.74 | 92 | 87 | 25.6 |
| D | 6 | 38 | 235 | 6.44 | 86 | 79 | 24.2 |
| D | 15 | 46 | 234 | 6.4 | 86 | 79 | 24.2 |
| D | 7 | 3 | 228 | 6.15 | 86 | 79 | 24.2 |
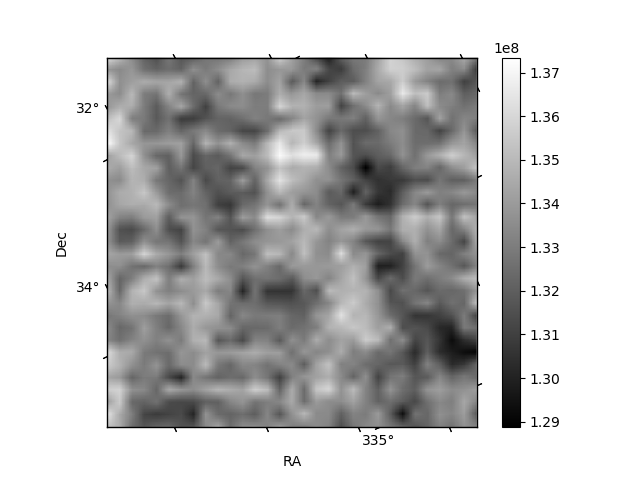
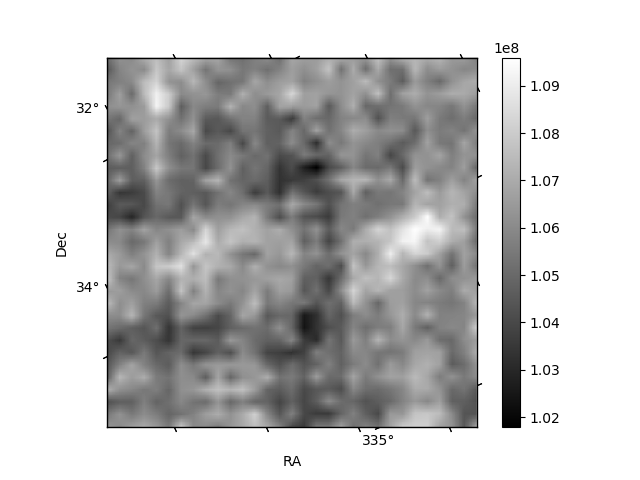
Histogram calculated using DETX and DETY for each event in the final _common_clean file
| Quadrant A | 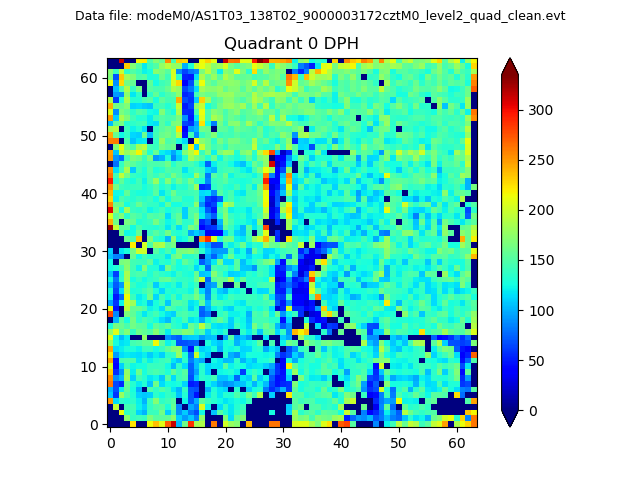 |
 |
Quadrant B |
|---|---|---|---|
| Quadrant D |  |
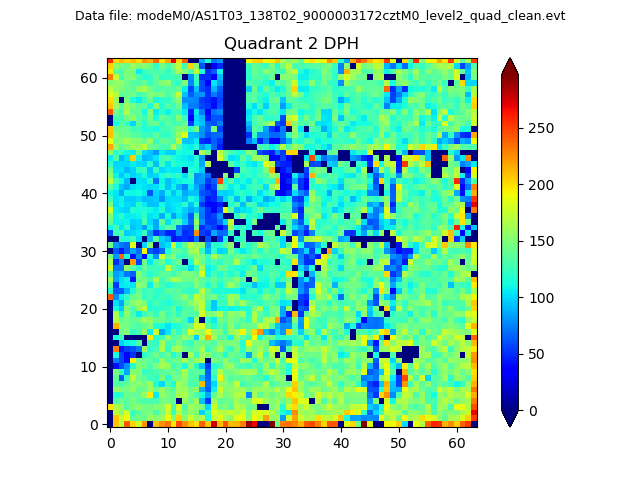 |
Quadrant C |
| Plot type | Count rate plots | Images |
|---|---|---|
| Comparison with Poisson distribution Blue bars denote a histogram of data divided into 1 sec bins. Red curve is a Poisson curve with rate = median count rate of data. |
 |
 |
| Quadrant-wise count rates Data is divided into 100 sec bins |
 |
|
| Module-wise count rates for Quadrant A Data is divided into 100 sec bins |
 |
 |
| Module-wise count rates for Quadrant B Data is divided into 100 sec bins |
 |
 |
| Module-wise count rates for Quadrant C Data is divided into 100 sec bins |
 |
 |
| Module-wise count rates for Quadrant D Data is divided into 100 sec bins |
 |
 |
| Parameter | Plot |
|---|---|
| CZT HV Monitor |  |
| D_VDD |  |
| Temperature 1 |  |
| Veto HV Monitor | 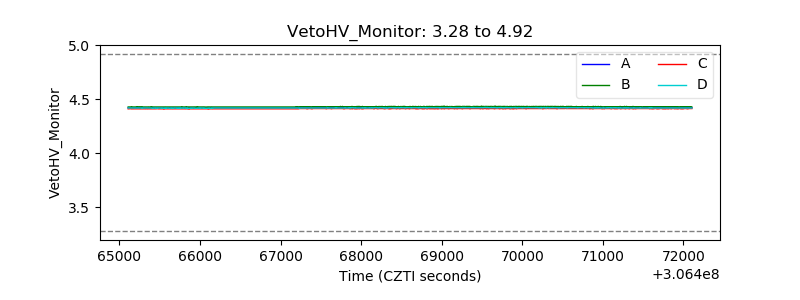 |
| Veto LLD |  |
| Alpha Counter |  |
| _CPM_Rate | 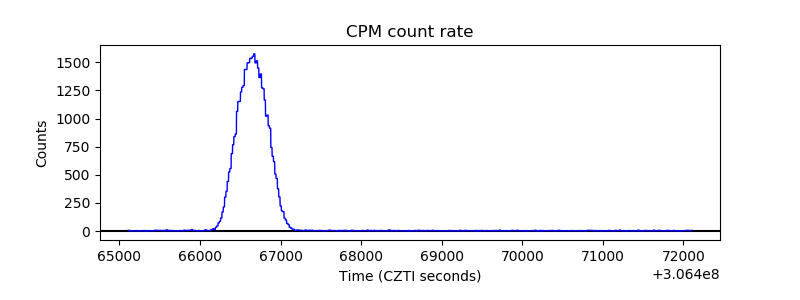 |
| CZT Counter | 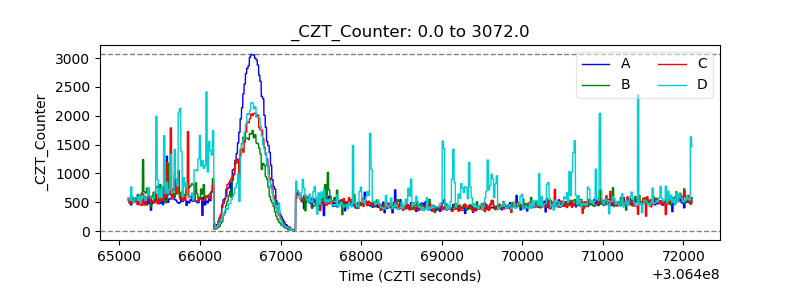 |
| +2.5 Volts monitor |  |
| +5 Volts monitor |  |
| _ROLL_ROT |  |
| _Roll_DEC |  |
| _Roll_RA |  |
| Veto Counter |  |