| Param | Original file | Final file |
|---|---|---|
| Filename | modeM0/AS1T03_138T02_9000003172_21475cztM0_level2.evt | modeM0/AS1T03_138T02_9000003172_21475cztM0_level2_quad_clean.evt |
| Size (bytes) | 195,805,440 | 48,237,120 |
| Size | 186.7 MB | 46.0 MB |
| Events in quadrant A | 1,244,974 | 328,047 |
| Events in quadrant B | 1,416,564 | 336,276 |
| Events in quadrant C | 1,319,760 | 316,103 |
| Events in quadrant D | 1,779,305 | 303,000 |
| Mode M9 | |||
|---|---|---|---|
| Quadrant | BADHDUFLAG | Total packets | Discarded packets |
| A | 0 | 10 | 0 |
| B | 0 | 10 | 0 |
| C | 0 | 10 | 0 |
| D | 0 | 10 | 0 |
| Mode SS | |||
|---|---|---|---|
| Quadrant | BADHDUFLAG | Total packets | Discarded packets |
| A | 0 | 52 | 0 |
| B | 0 | 52 | 0 |
| C | 0 | 52 | 0 |
| D | 0 | 52 | 0 |
| Mode M0 | |||
|---|---|---|---|
| Quadrant | BADHDUFLAG | Total packets | Discarded packets |
| A | 0 | 5134 | 1 |
| B | 0 | 5875 | 1 |
| C | 0 | 5401 | 1 |
| D | 0 | 6948 | 1 |
| Quadrant | Total seconds | Saturated seconds | Saturation percentage |
|---|---|---|---|
| A | 2462 | 3 | 0.121852% |
| B | 2462 | 12 | 0.487409% |
| C | 2462 | 30 | 1.218522% |
| D | 2462 | 96 | 3.899269% |
Noise dominated data is calculated using 1-second bins in cleaned event files. If a bin has >2000 counts, and if more than 50% of those come from <1% of pixels, then it is considered to be noise-dominated and hence unusable.
| Quadrant | # 1 sec bins | Bins with >0 counts | Bins with >2000 counts | High rate bins dominated by noise | Noise dominated (total time) | Noise dominated (detector-on time) | Marked lightcurve |
|---|---|---|---|---|---|---|---|
| A | 3482 | 2463 | 0 | 0 | 0.00% | 0.00% | 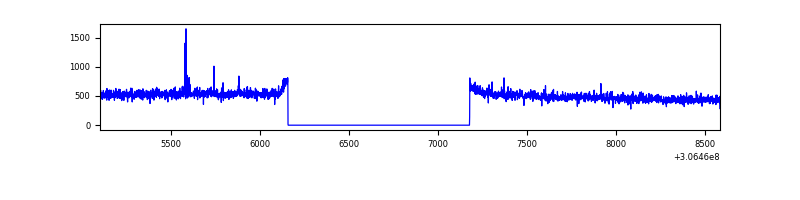 |
| B | 3482 | 2463 | 4 | 4 | 0.11% | 0.16% | 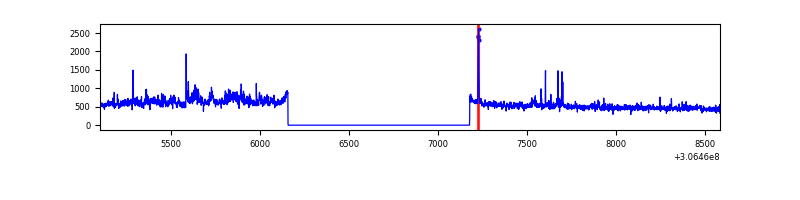 |
| C | 3482 | 2463 | 4 | 4 | 0.11% | 0.16% | 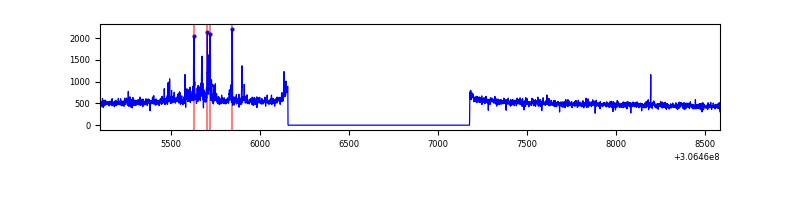 |
| D | 3482 | 2463 | 58 | 58 | 1.67% | 2.35% | 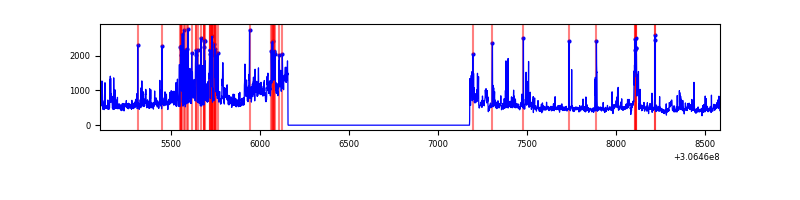 |
Top three noisy pixels from each quadrant. If the there are fewer than three noisy pixels in the level2.evt file, extra rows are filled as -1
| Pixel properties | Quadrant properties | ||||||
|---|---|---|---|---|---|---|---|
| Quadrant | DetID | PixID | Counts | Sigma | Mean | Median | Sigma |
| A | 15 | 174 | 9033 | 131.86 | 320 | 315 | 66.1 |
| A | 13 | 254 | 4093 | 57.14 | 320 | 315 | 66.1 |
| A | 0 | 226 | 2942 | 39.73 | 320 | 315 | 66.1 |
| B | 0 | 219 | 39708 | 630.3 | 322 | 315 | 62.5 |
| B | 3 | 64 | 38012 | 603.16 | 322 | 315 | 62.5 |
| B | 0 | 228 | 17732 | 278.68 | 322 | 315 | 62.5 |
| C | 0 | 207 | 64495 | 858.93 | 309 | 310 | 74.7 |
| C | 14 | 238 | 46800 | 622.14 | 309 | 310 | 74.7 |
| C | 13 | 61 | 2185 | 25.09 | 309 | 310 | 74.7 |
| D | 1 | 20 | 291738 | 3769.38 | 309 | 299 | 77.3 |
| D | 12 | 233 | 113297 | 1461.48 | 309 | 299 | 77.3 |
| D | 7 | 38 | 32871 | 421.28 | 309 | 299 | 77.3 |
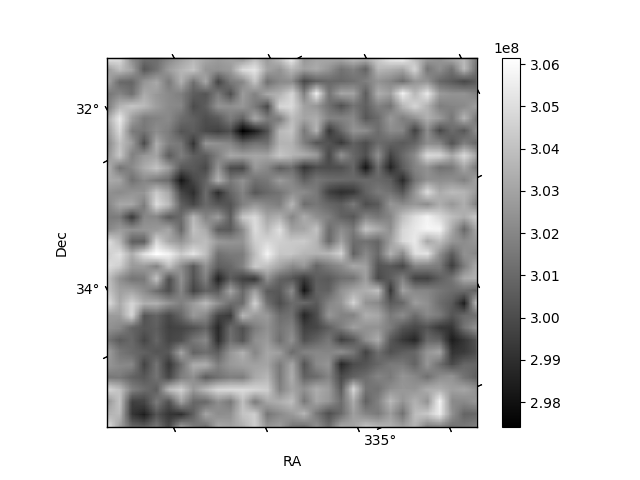
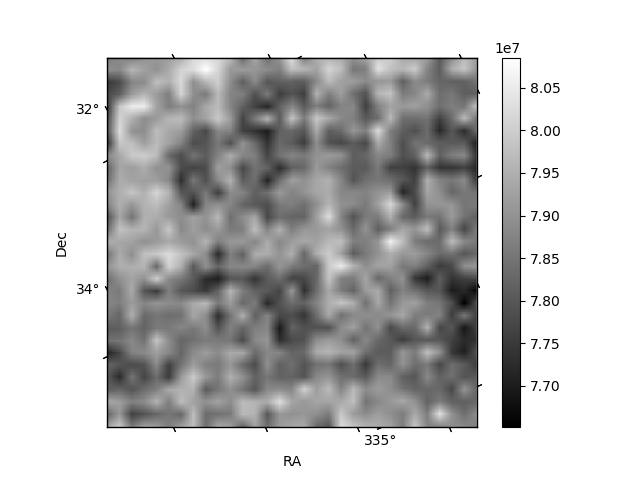
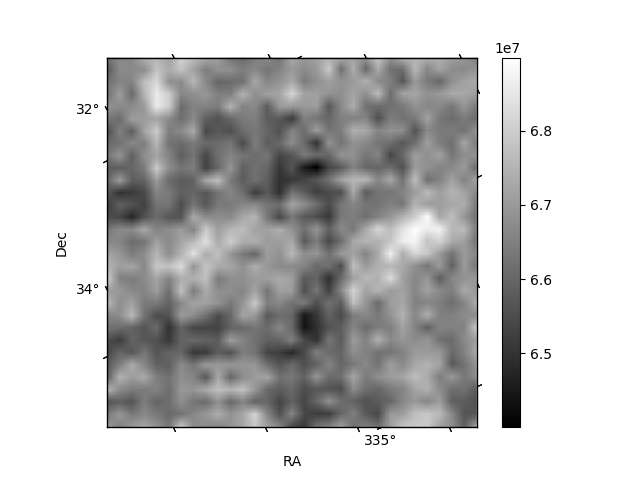
Histogram calculated using DETX and DETY for each event in the final _common_clean file
| Quadrant A | 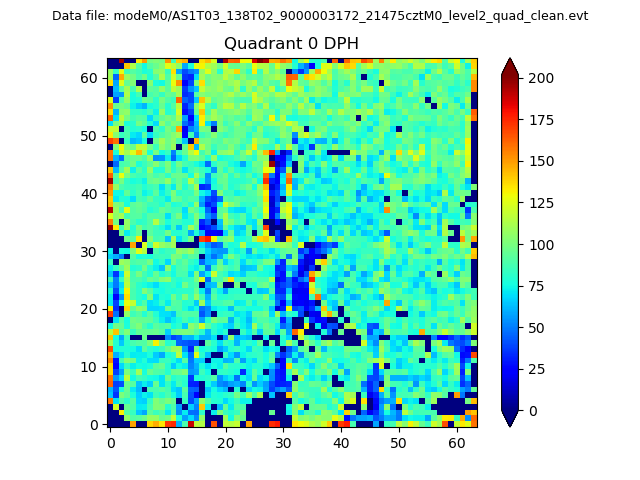 |
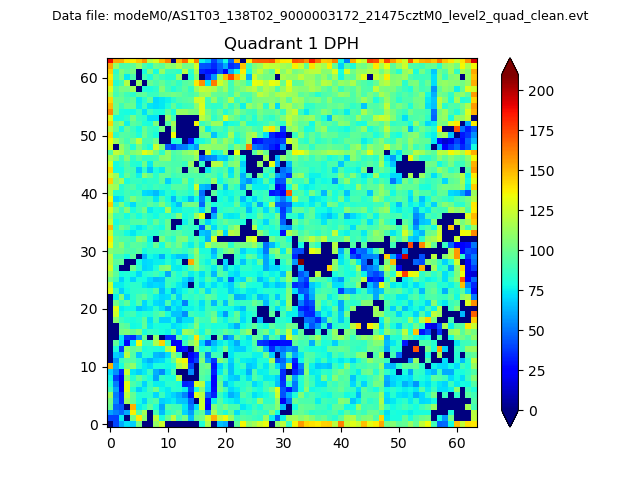 |
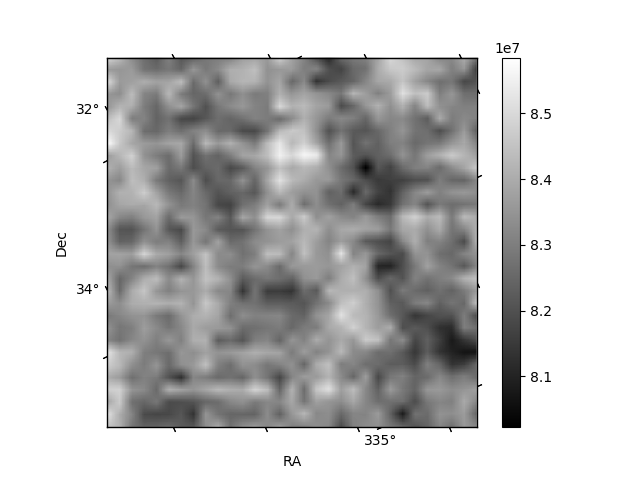
Quadrant B |
|---|---|---|---|
| Quadrant D | 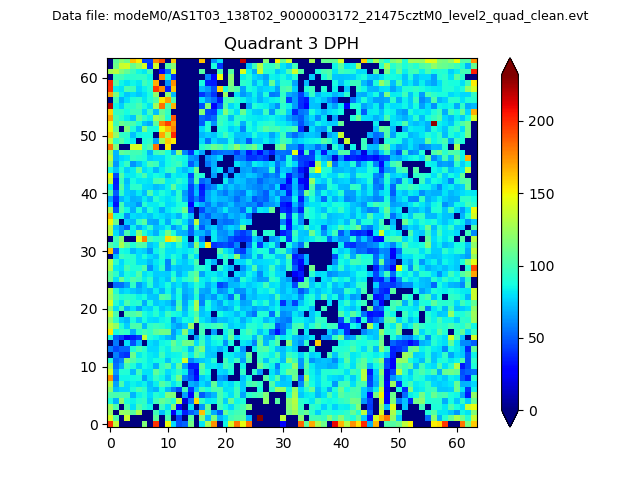 |
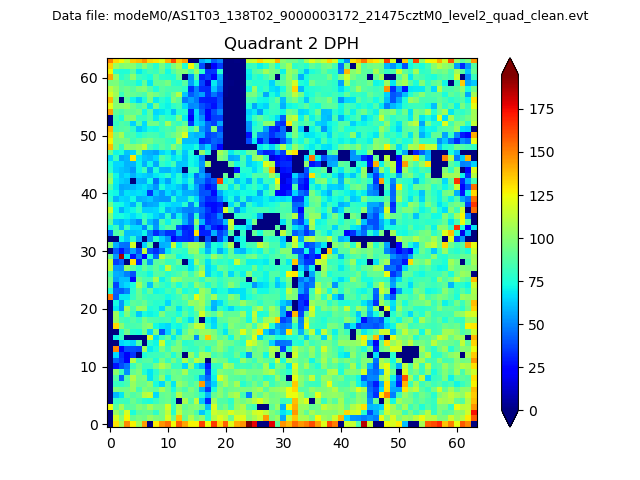 |
Quadrant C |
| Plot type | Count rate plots | Images |
|---|---|---|
| Comparison with Poisson distribution Blue bars denote a histogram of data divided into 1 sec bins. Red curve is a Poisson curve with rate = median count rate of data. |
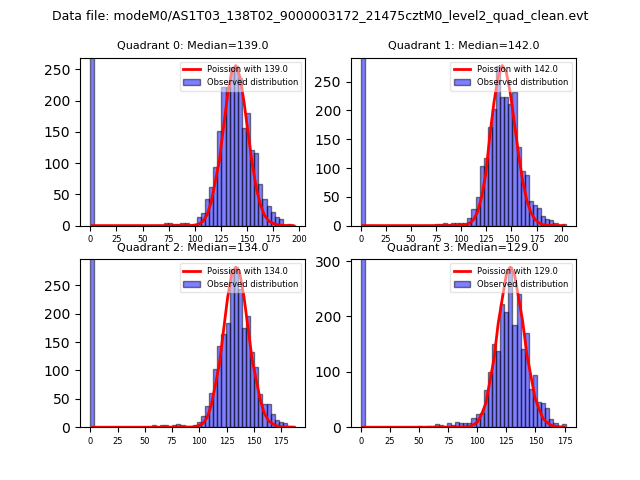 |
 |
| Quadrant-wise count rates Data is divided into 100 sec bins |
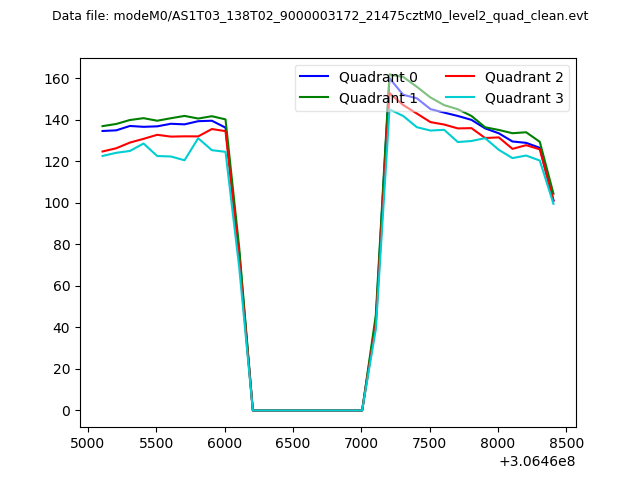 |
|
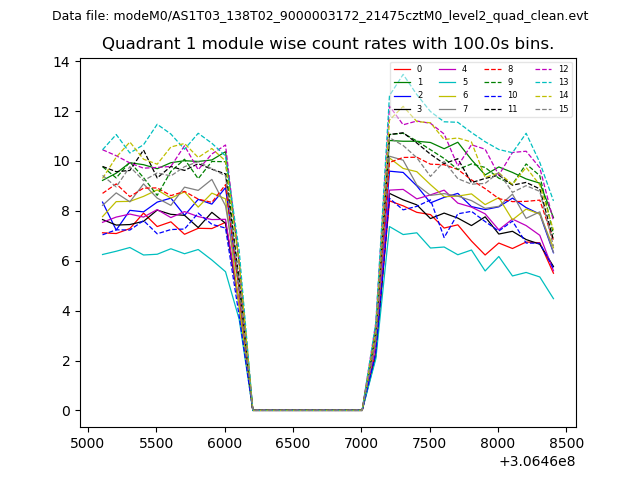
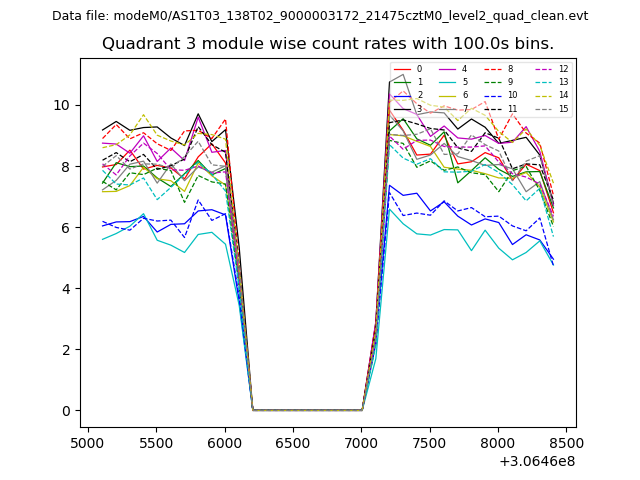
| Module-wise count rates for Quadrant A Data is divided into 100 sec bins |
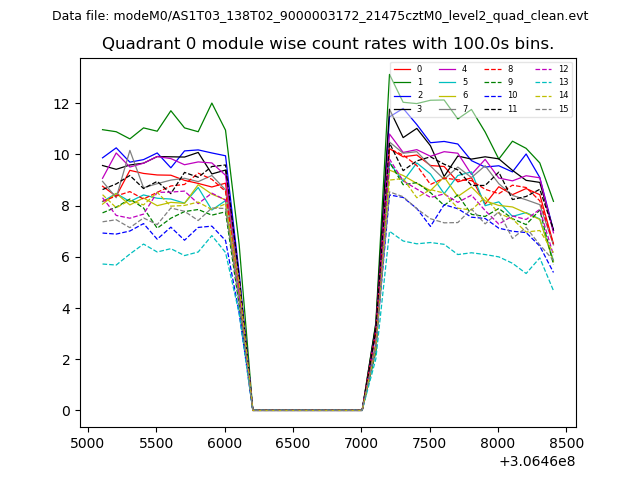 |
 |
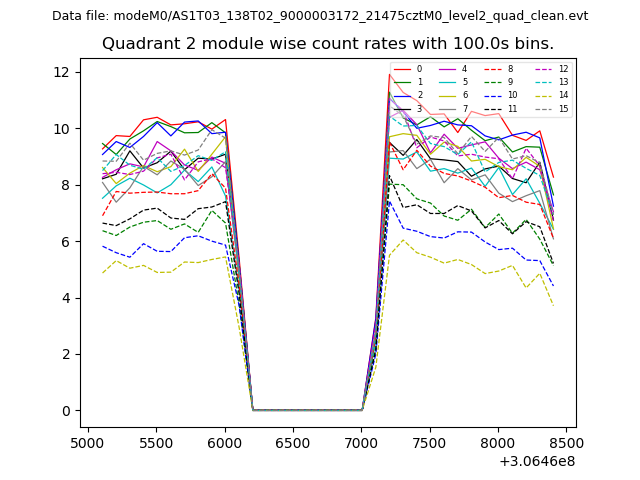
| Module-wise count rates for Quadrant B Data is divided into 100 sec bins |
 |
 |
| Module-wise count rates for Quadrant C Data is divided into 100 sec bins |
 |
 |
| Module-wise count rates for Quadrant D Data is divided into 100 sec bins |
 |
 |
| Parameter | Plot |
|---|---|
| CZT HV Monitor | 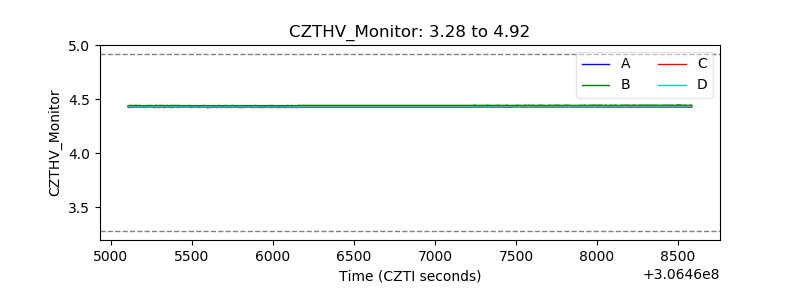 |
| D_VDD | 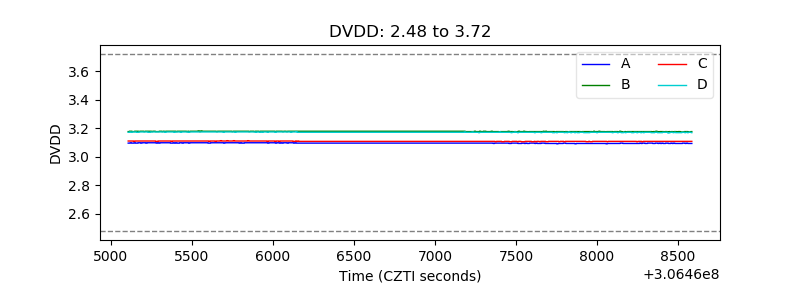 |
| Temperature 1 | 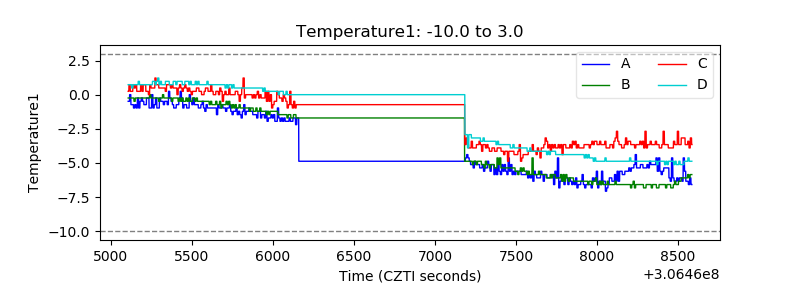 |
| Veto HV Monitor | 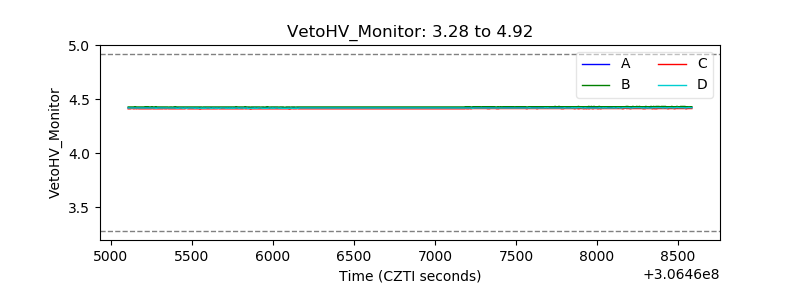 |
| Veto LLD | 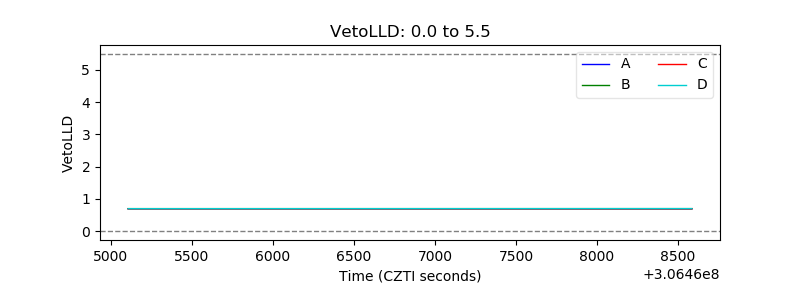 |
| Alpha Counter | 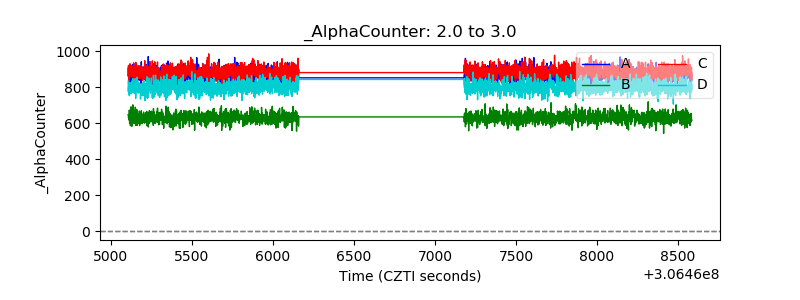 |
| _CPM_Rate |  |
| CZT Counter | 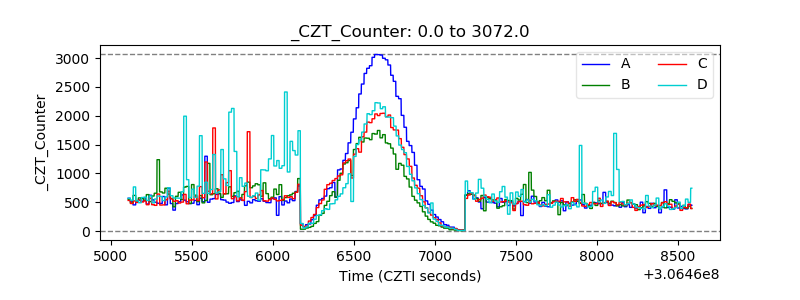 |
| +2.5 Volts monitor | 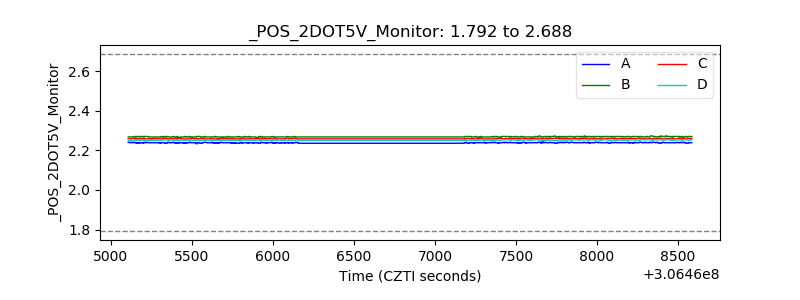 |
| +5 Volts monitor | 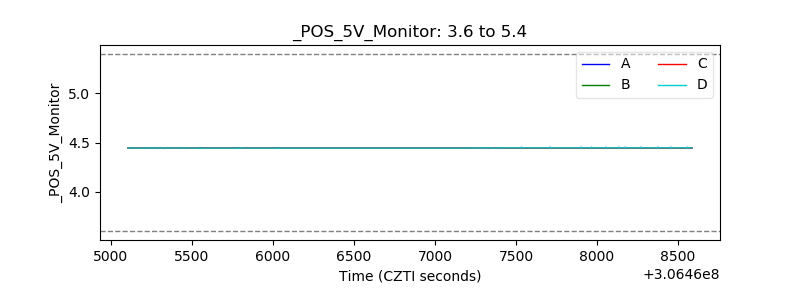 |
| _ROLL_ROT | 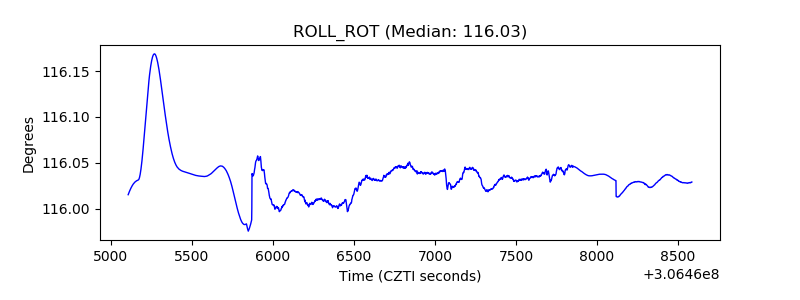 |
| _Roll_DEC | 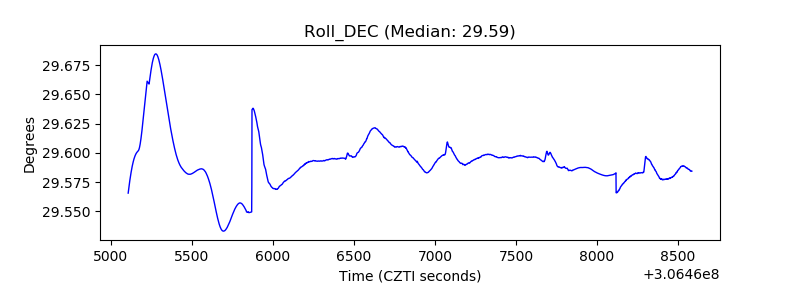 |
| _Roll_RA | 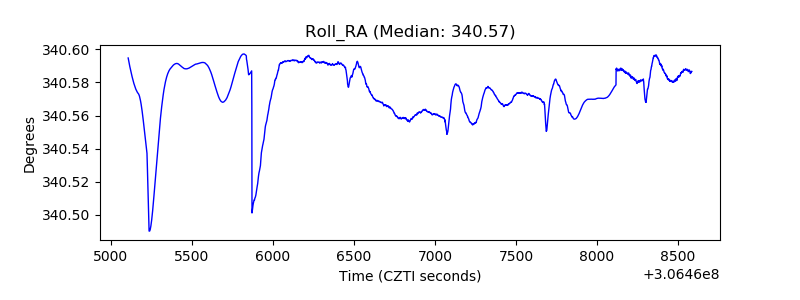 |
| Veto Counter | 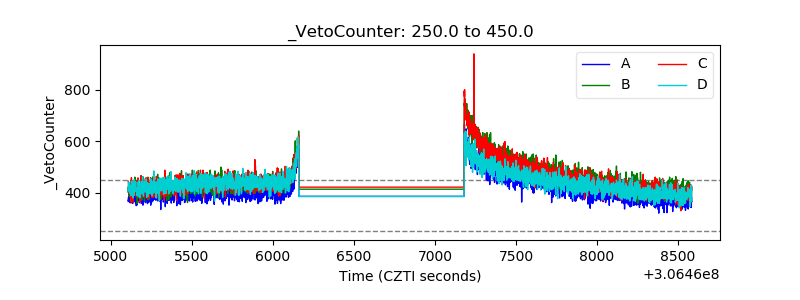 |