| Param | Original file | Final file |
|---|---|---|
| Filename | modeM0/AS1T03_141T01_9000003174_21478cztM0_level2.evt | modeM0/AS1T03_141T01_9000003174_21478cztM0_level2_quad_clean.evt |
| Size (bytes) | 437,270,400 | 64,802,880 |
| Size | 417.0 MB | 61.8 MB |
| Events in quadrant A | 3,113,397 | 385,295 |
| Events in quadrant B | 3,272,942 | 395,741 |
| Events in quadrant C | 3,161,573 | 381,791 |
| Events in quadrant D | 3,278,035 | 370,976 |
| Mode M9 | |||
|---|---|---|---|
| Quadrant | BADHDUFLAG | Total packets | Discarded packets |
| A | 0 | 13 | 0 |
| B | 0 | 13 | 0 |
| C | 0 | 13 | 0 |
| D | 0 | 13 | 0 |
| Mode M0 | |||
|---|---|---|---|
| Quadrant | BADHDUFLAG | Total packets | Discarded packets |
| A | 0 | 12935 | 0 |
| B | 0 | 13411 | 0 |
| C | 0 | 13172 | 0 |
| D | 0 | 13618 | 0 |
| Mode SS | |||
|---|---|---|---|
| Quadrant | BADHDUFLAG | Total packets | Discarded packets |
| A | 0 | 124 | 0 |
| B | 0 | 124 | 0 |
| C | 0 | 124 | 0 |
| D | 0 | 124 | 0 |
| Quadrant | Total seconds | Saturated seconds | Saturation percentage |
|---|---|---|---|
| A | 6136 | 18 | 0.293351% |
| B | 6137 | 47 | 0.765847% |
| C | 6137 | 77 | 1.254685% |
| D | 6137 | 47 | 0.765847% |
Noise dominated data is calculated using 1-second bins in cleaned event files. If a bin has >2000 counts, and if more than 50% of those come from <1% of pixels, then it is considered to be noise-dominated and hence unusable.
| Quadrant | # 1 sec bins | Bins with >0 counts | Bins with >2000 counts | High rate bins dominated by noise | Noise dominated (total time) | Noise dominated (detector-on time) | Marked lightcurve |
|---|---|---|---|---|---|---|---|
| A | 7396 | 6136 | 0 | 0 | 0.00% | 0.00% | 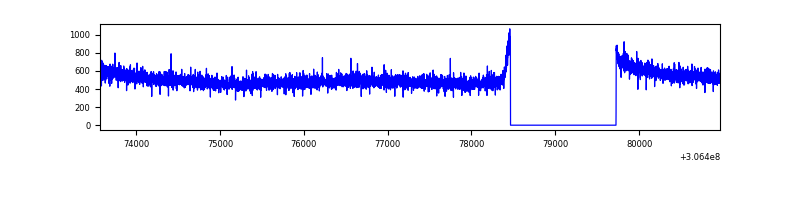 |
| B | 7397 | 6137 | 4 | 4 | 0.05% | 0.07% | 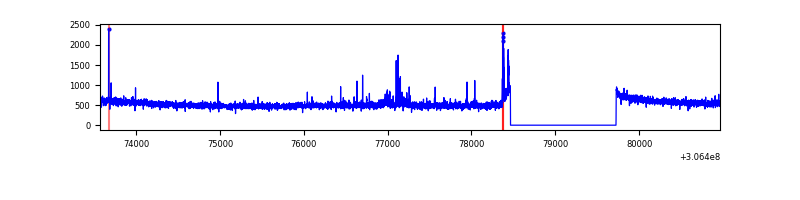 |
| C | 7397 | 6137 | 0 | 0 | 0.00% | 0.00% | 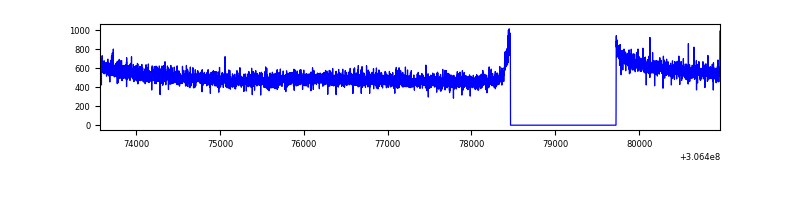 |
| D | 7397 | 6137 | 12 | 12 | 0.16% | 0.20% | 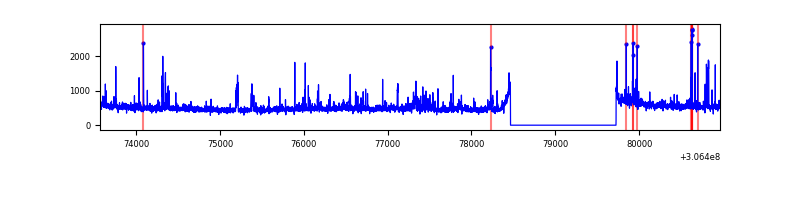 |
Top three noisy pixels from each quadrant. If the there are fewer than three noisy pixels in the level2.evt file, extra rows are filled as -1
| Pixel properties | Quadrant properties | ||||||
|---|---|---|---|---|---|---|---|
| Quadrant | DetID | PixID | Counts | Sigma | Mean | Median | Sigma |
| A | 13 | 254 | 9507 | 54.51 | 808 | 794 | 159.8 |
| A | 0 | 226 | 7020 | 38.95 | 808 | 794 | 159.8 |
| A | 3 | 137 | 6057 | 32.93 | 808 | 794 | 159.8 |
| B | 0 | 190 | 39895 | 256.65 | 814 | 797 | 152.3 |
| B | 10 | 247 | 27618 | 176.06 | 814 | 797 | 152.3 |
| B | 12 | 111 | 17358 | 108.71 | 814 | 797 | 152.3 |
| C | 14 | 238 | 125904 | 702.58 | 778 | 786 | 178.1 |
| C | 13 | 61 | 5469 | 26.3 | 778 | 786 | 178.1 |
| C | 14 | 111 | 1923 | 6.38 | 778 | 786 | 178.1 |
| D | 13 | 153 | 85820 | 456.59 | 782 | 761 | 186.3 |
| D | 14 | 34 | 68986 | 366.23 | 782 | 761 | 186.3 |
| D | 1 | 52 | 48748 | 257.59 | 782 | 761 | 186.3 |
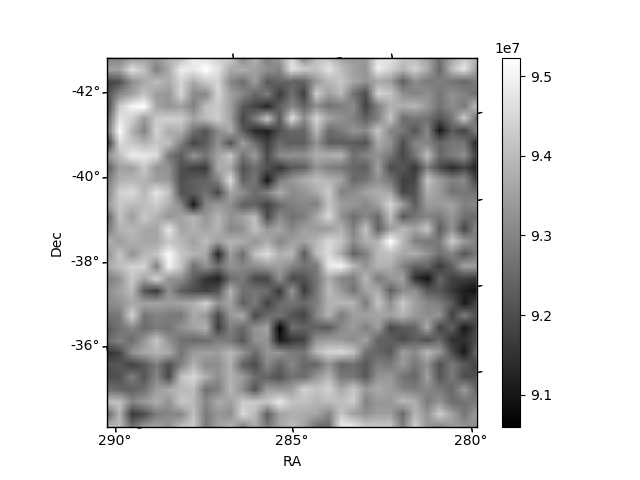
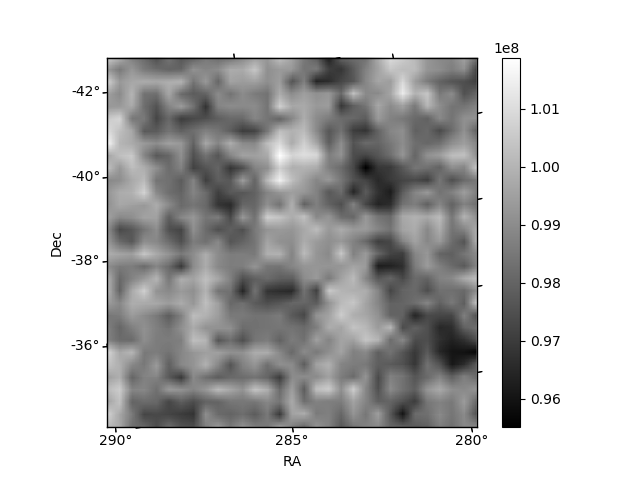
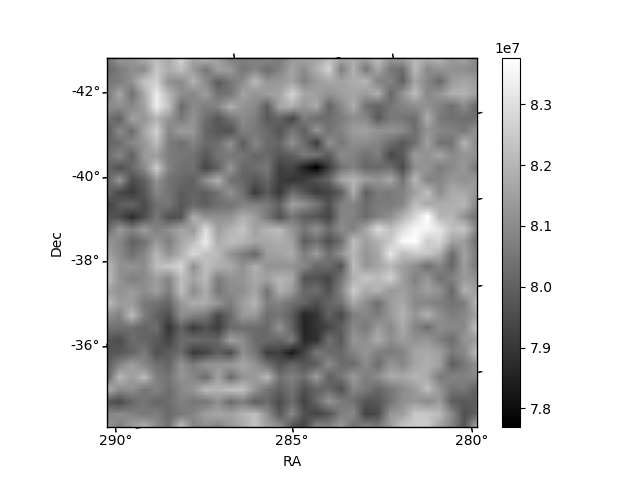
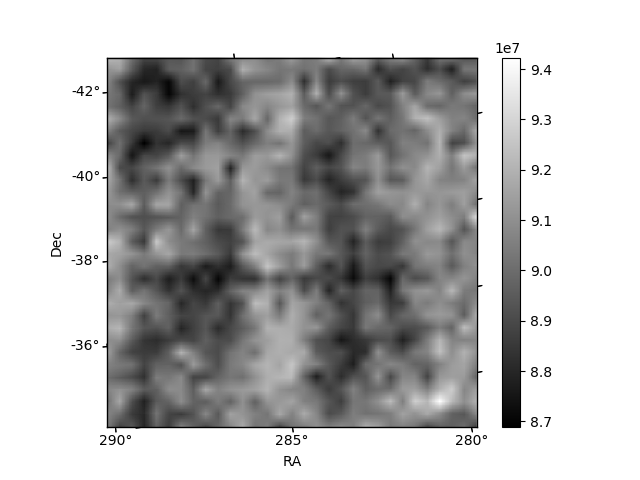
Histogram calculated using DETX and DETY for each event in the final _common_clean file
| Quadrant A | 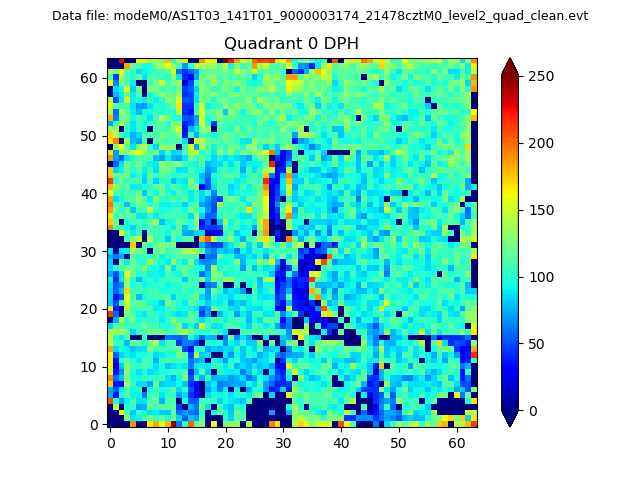 |
 |
Quadrant B |
|---|---|---|---|
| Quadrant D | 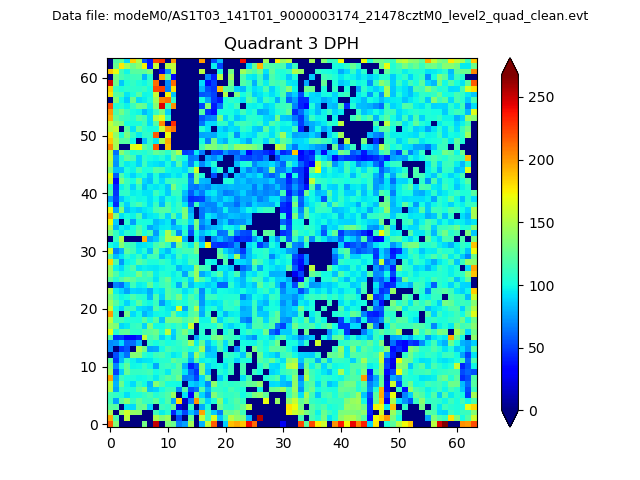 |
 |
Quadrant C |
| Plot type | Count rate plots | Images |
|---|---|---|
| Comparison with Poisson distribution Blue bars denote a histogram of data divided into 1 sec bins. Red curve is a Poisson curve with rate = median count rate of data. |
 |
 |
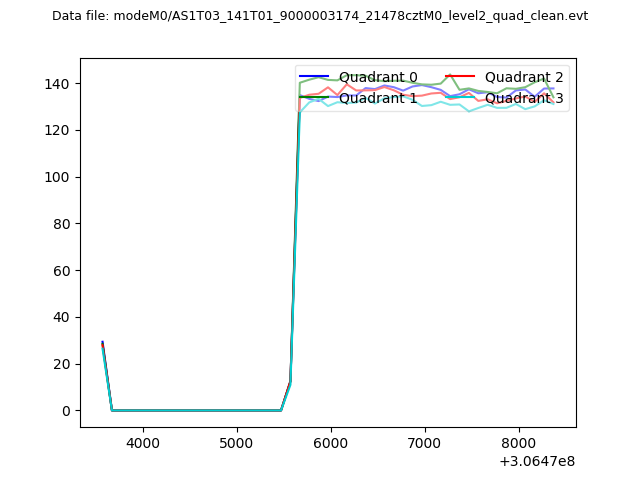
| Quadrant-wise count rates Data is divided into 100 sec bins |
 |
|
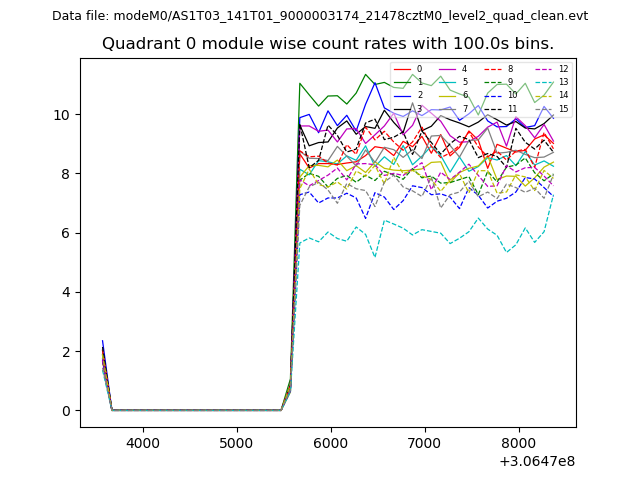
| Module-wise count rates for Quadrant A Data is divided into 100 sec bins |
 |
 |
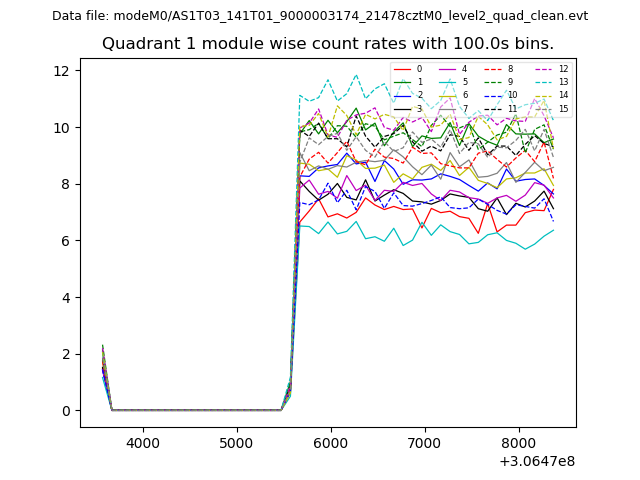
| Module-wise count rates for Quadrant B Data is divided into 100 sec bins |
 |
 |
| Module-wise count rates for Quadrant C Data is divided into 100 sec bins |
 |
 |
| Module-wise count rates for Quadrant D Data is divided into 100 sec bins |
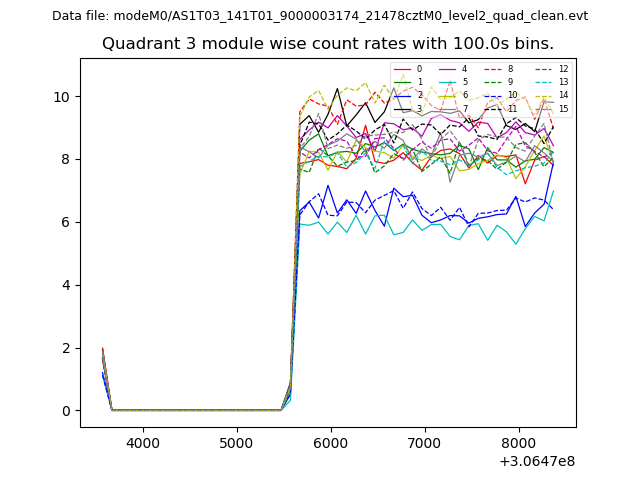 |
 |
| Parameter | Plot |
|---|---|
| CZT HV Monitor |  |
| D_VDD | 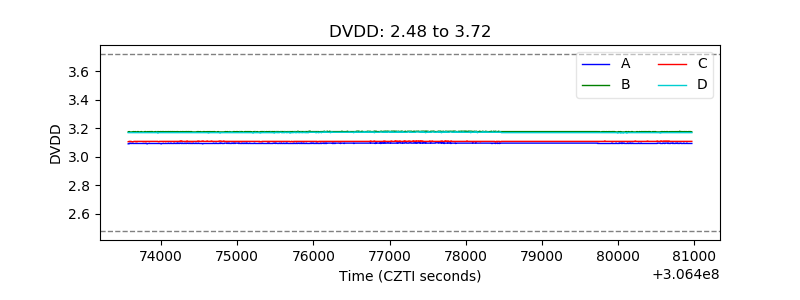 |
| Temperature 1 | 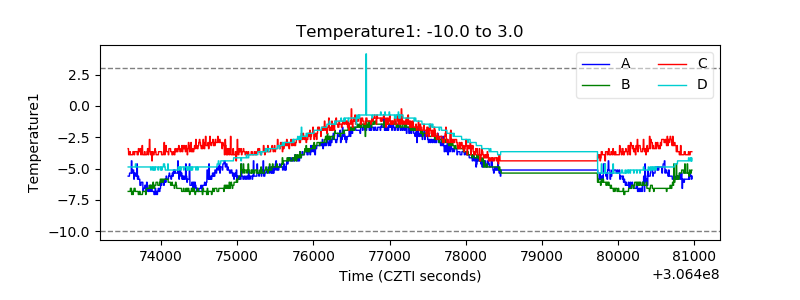 |
| Veto HV Monitor | 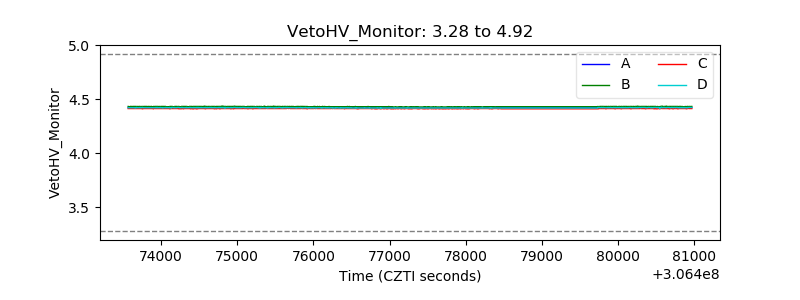 |
| Veto LLD | 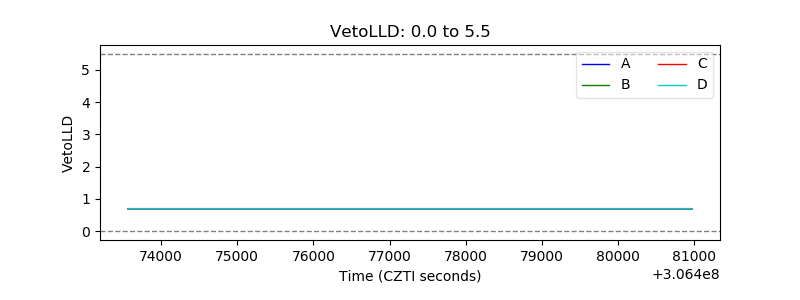 |
| Alpha Counter | 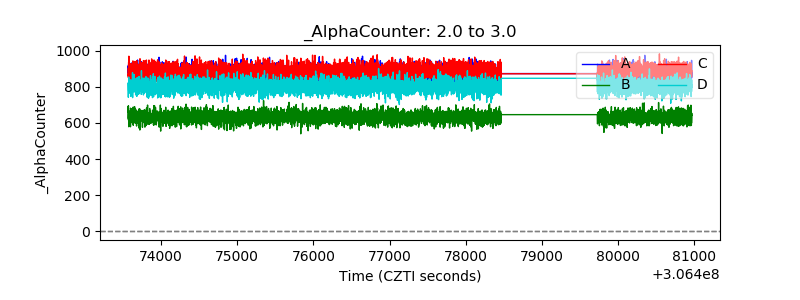 |
| _CPM_Rate | 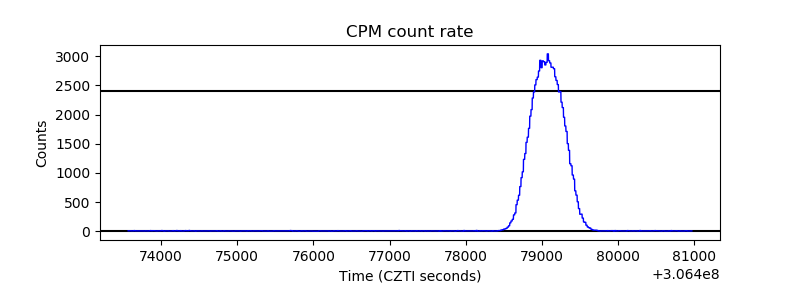 |
| CZT Counter | 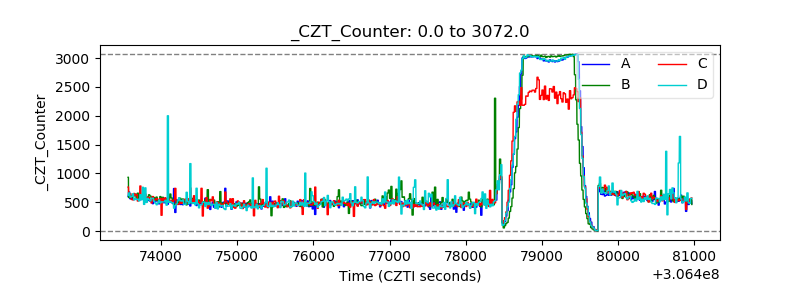 |
| +2.5 Volts monitor |  |
| +5 Volts monitor | 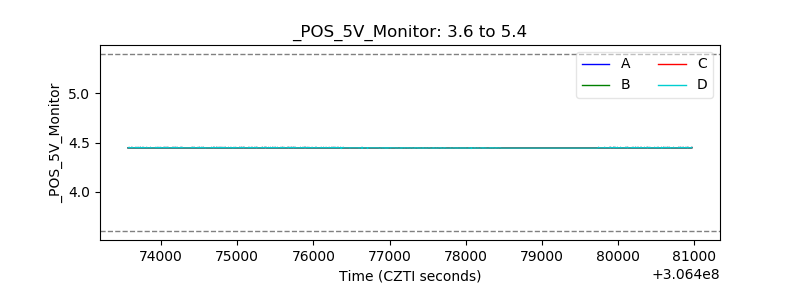 |
| _ROLL_ROT | 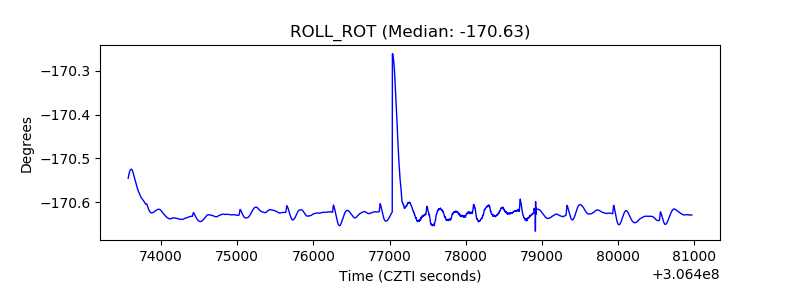 |
| _Roll_DEC | 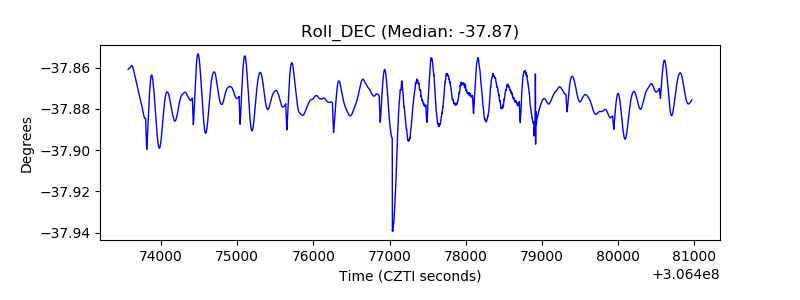 |
| _Roll_RA | 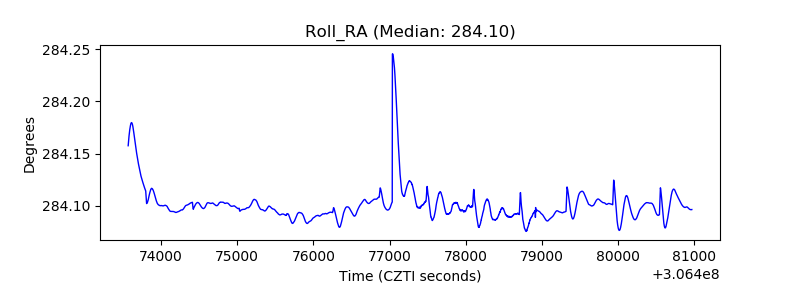 |
| Veto Counter | 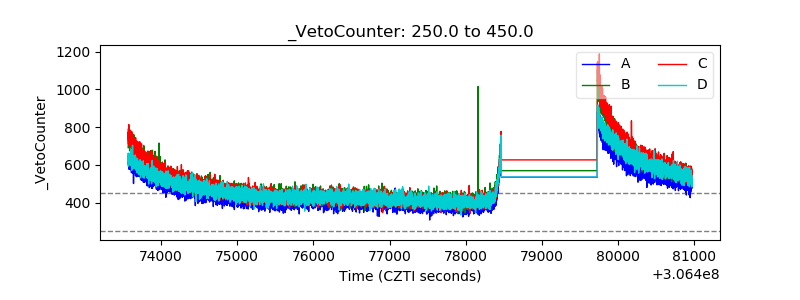 |