| Param | Original file | Final file |
|---|---|---|
| Filename | modeM0/AS1T03_141T01_9000003174_21480cztM0_level2.evt | modeM0/AS1T03_141T01_9000003174_21480cztM0_level2_quad_clean.evt |
| Size (bytes) | 495,751,680 | 88,706,880 |
| Size | 472.8 MB | 84.6 MB |
| Events in quadrant A | 3,435,227 | 568,948 |
| Events in quadrant B | 3,587,512 | 581,076 |
| Events in quadrant C | 3,492,399 | 565,505 |
| Events in quadrant D | 4,078,900 | 538,663 |
| Mode M9 | |||
|---|---|---|---|
| Quadrant | BADHDUFLAG | Total packets | Discarded packets |
| A | 0 | 23 | 0 |
| B | 0 | 24 | 0 |
| C | 0 | 24 | 0 |
| D | 0 | 24 | 0 |
| Mode M0 | |||
|---|---|---|---|
| Quadrant | BADHDUFLAG | Total packets | Discarded packets |
| A | 0 | 14062 | 0 |
| B | 0 | 14645 | 0 |
| C | 0 | 14380 | 0 |
| D | 0 | 15942 | 0 |
| Quadrant | Total seconds | Saturated seconds | Saturation percentage |
|---|---|---|---|
| A | 6195 | 96 | 1.549637% |
| B | 6195 | 125 | 2.017756% |
| C | 6194 | 164 | 2.647724% |
| D | 6194 | 251 | 4.052309% |
Noise dominated data is calculated using 1-second bins in cleaned event files. If a bin has >2000 counts, and if more than 50% of those come from <1% of pixels, then it is considered to be noise-dominated and hence unusable.
| Quadrant | # 1 sec bins | Bins with >0 counts | Bins with >2000 counts | High rate bins dominated by noise | Noise dominated (total time) | Noise dominated (detector-on time) | Marked lightcurve |
|---|---|---|---|---|---|---|---|
| A | 7530 | 6195 | 0 | 0 | 0.00% | 0.00% | 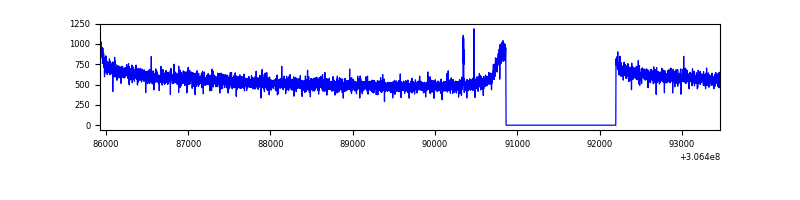 |
| B | 7530 | 6195 | 1 | 1 | 0.01% | 0.02% | 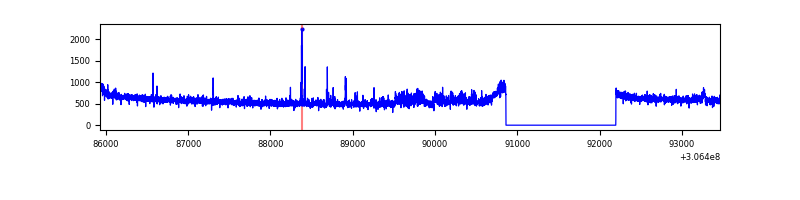 |
| C | 7529 | 6194 | 0 | 0 | 0.00% | 0.00% | 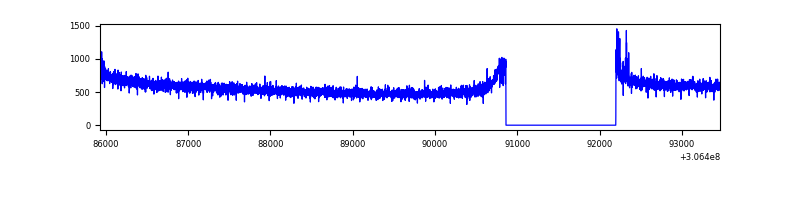 |
| D | 7529 | 6194 | 184 | 184 | 2.44% | 2.97% | 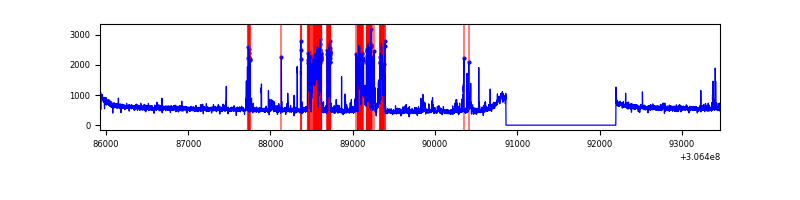 |
Top three noisy pixels from each quadrant. If the there are fewer than three noisy pixels in the level2.evt file, extra rows are filled as -1
| Pixel properties | Quadrant properties | ||||||
|---|---|---|---|---|---|---|---|
| Quadrant | DetID | PixID | Counts | Sigma | Mean | Median | Sigma |
| A | 13 | 254 | 9545 | 50.1 | 888 | 876 | 173.0 |
| A | 15 | 174 | 9305 | 48.71 | 888 | 876 | 173.0 |
| A | 0 | 226 | 7754 | 39.75 | 888 | 876 | 173.0 |
| B | 0 | 230 | 103459 | 628.67 | 882 | 862 | 163.2 |
| B | 0 | 190 | 22322 | 131.49 | 882 | 862 | 163.2 |
| B | 12 | 111 | 18527 | 108.24 | 882 | 862 | 163.2 |
| C | 14 | 238 | 138085 | 709.05 | 853 | 864 | 193.5 |
| C | 3 | 233 | 25570 | 127.66 | 853 | 864 | 193.5 |
| C | 13 | 61 | 5998 | 26.53 | 853 | 864 | 193.5 |
| D | 13 | 153 | 326383 | 1572.0 | 866 | 843 | 207.1 |
| D | 13 | 172 | 229899 | 1106.09 | 866 | 843 | 207.1 |
| D | 7 | 38 | 206079 | 991.07 | 866 | 843 | 207.1 |
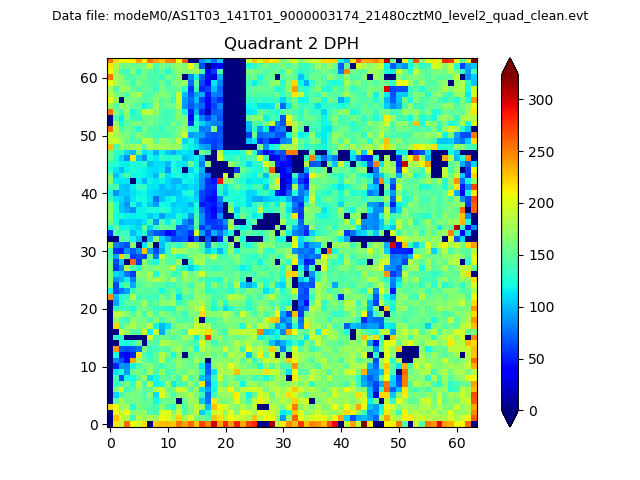
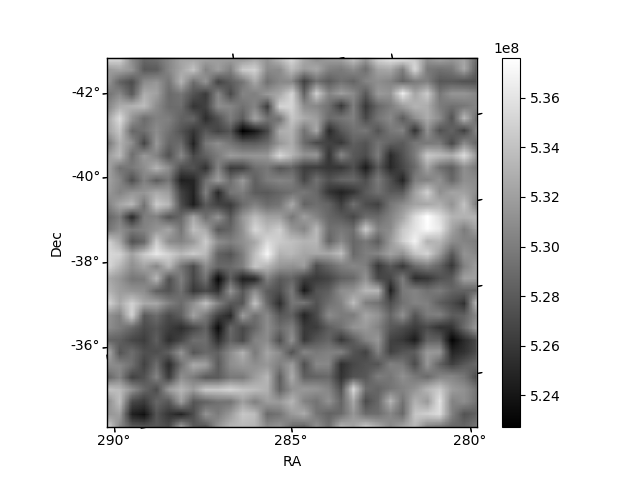
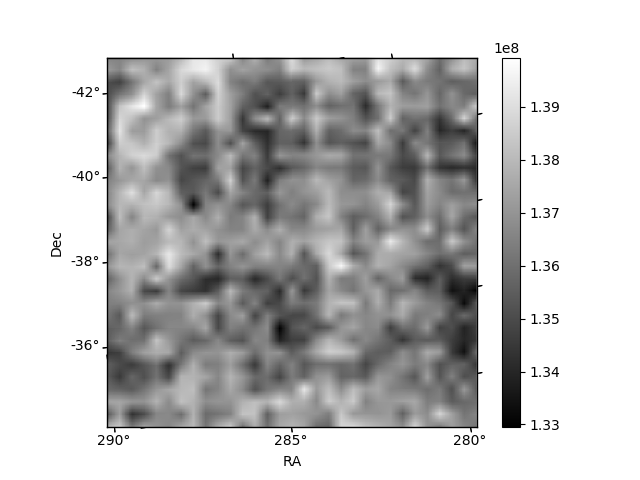
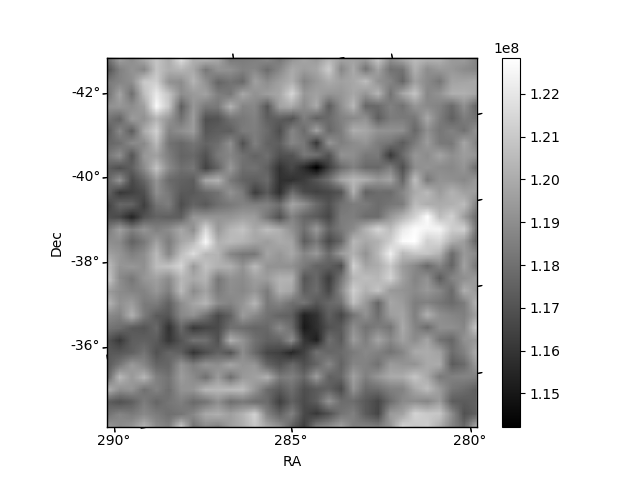
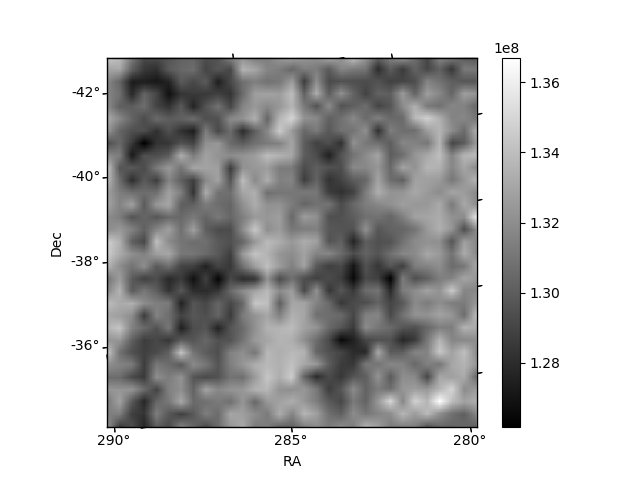
Histogram calculated using DETX and DETY for each event in the final _common_clean file
| Quadrant A | 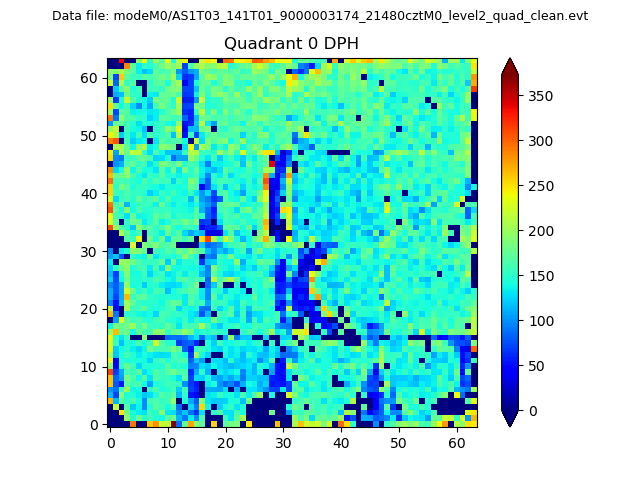 |
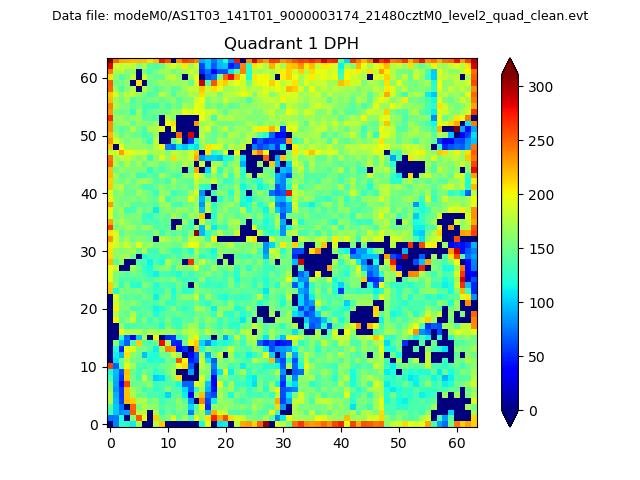 |
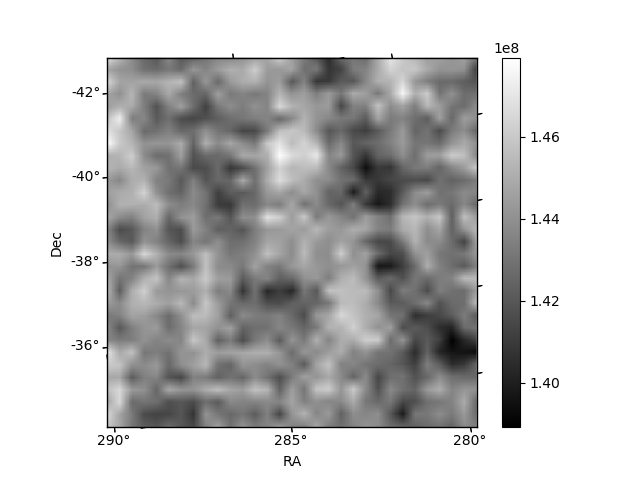
Quadrant B |
|---|---|---|---|
| Quadrant D | 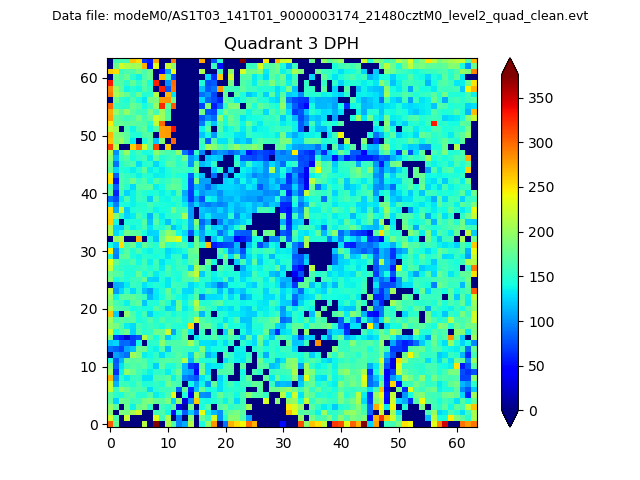 |
 |
Quadrant C |
| Plot type | Count rate plots | Images |
|---|---|---|
| Comparison with Poisson distribution Blue bars denote a histogram of data divided into 1 sec bins. Red curve is a Poisson curve with rate = median count rate of data. |
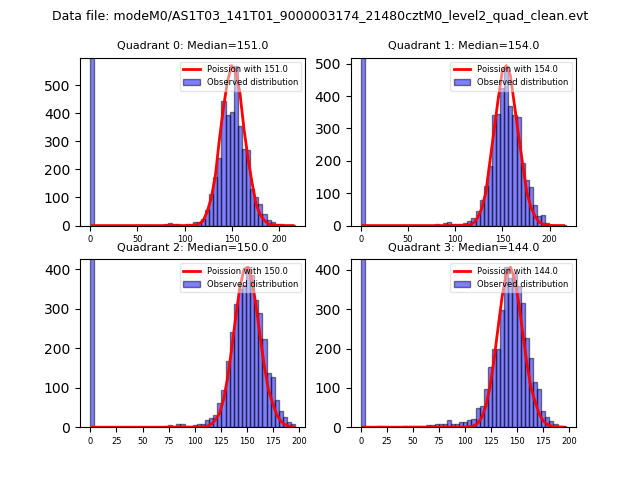 |
 |
| Quadrant-wise count rates Data is divided into 100 sec bins |
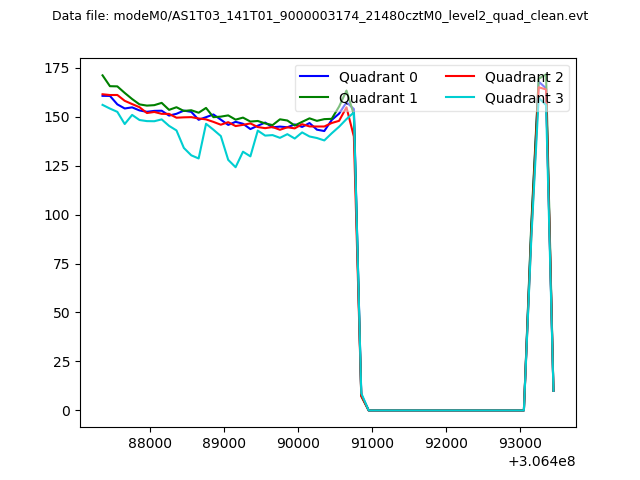 |
|
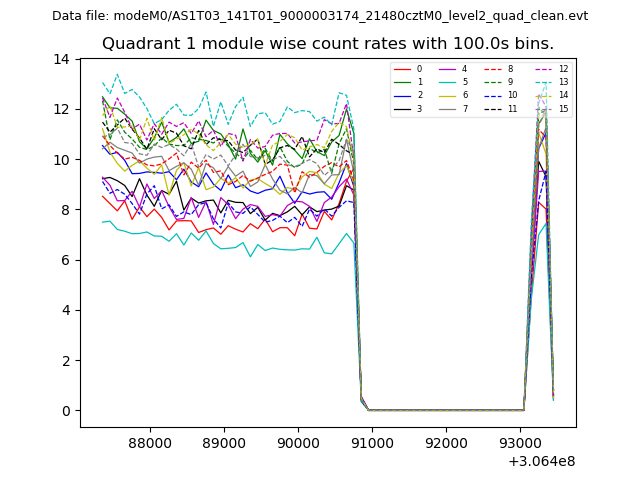
| Module-wise count rates for Quadrant A Data is divided into 100 sec bins |
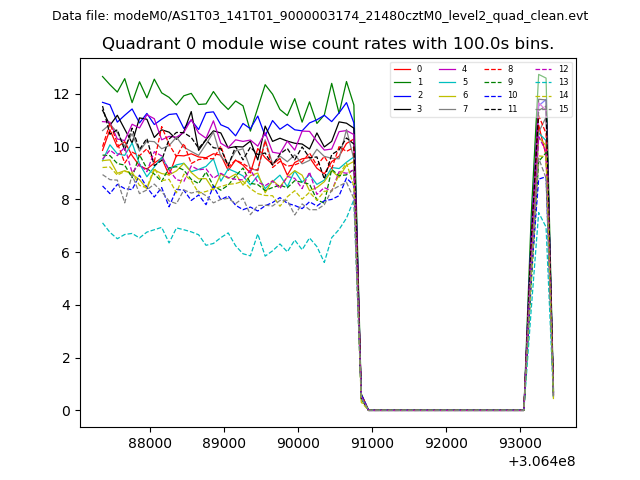 |
 |
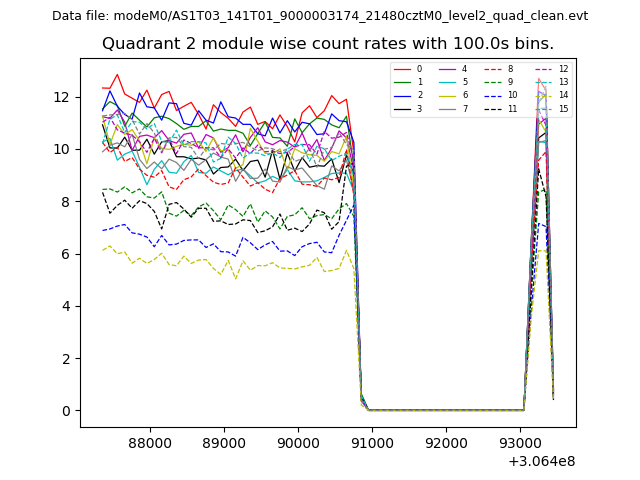
| Module-wise count rates for Quadrant B Data is divided into 100 sec bins |
 |
 |
| Module-wise count rates for Quadrant C Data is divided into 100 sec bins |
 |
 |
| Module-wise count rates for Quadrant D Data is divided into 100 sec bins |
 |
 |
| Parameter | Plot |
|---|---|
| CZT HV Monitor | 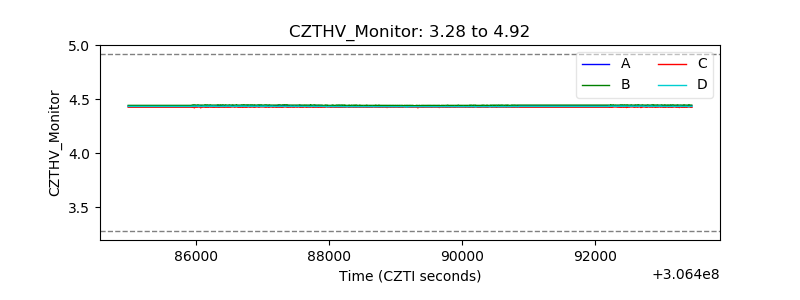 |
| D_VDD | 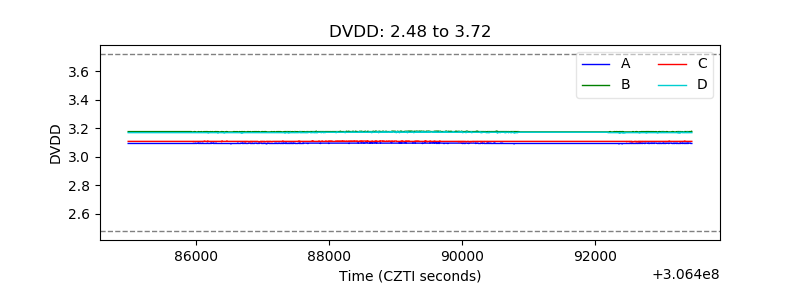 |
| Temperature 1 | 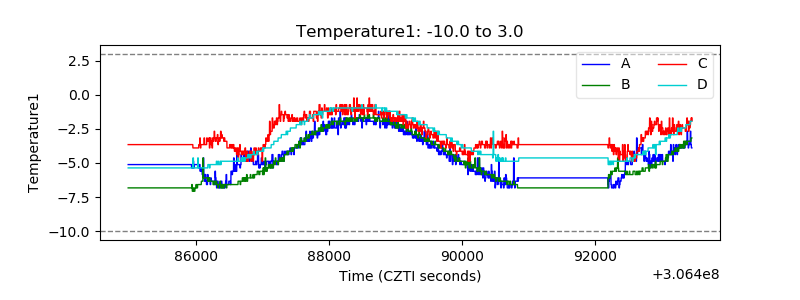 |
| Veto HV Monitor | 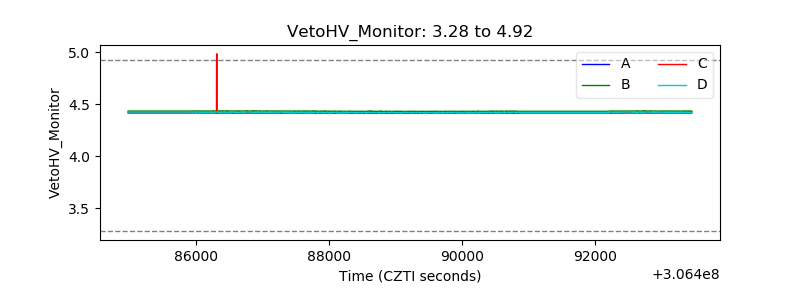 |
| Veto LLD | 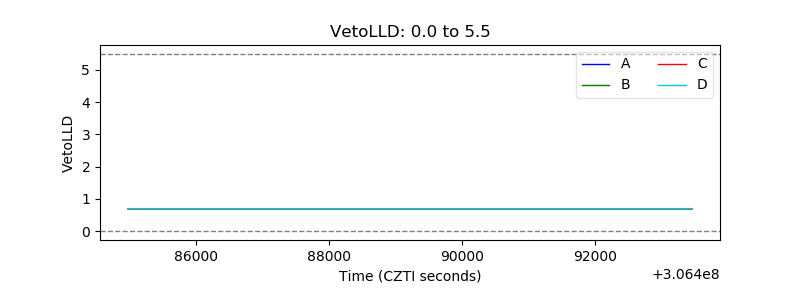 |
| Alpha Counter | 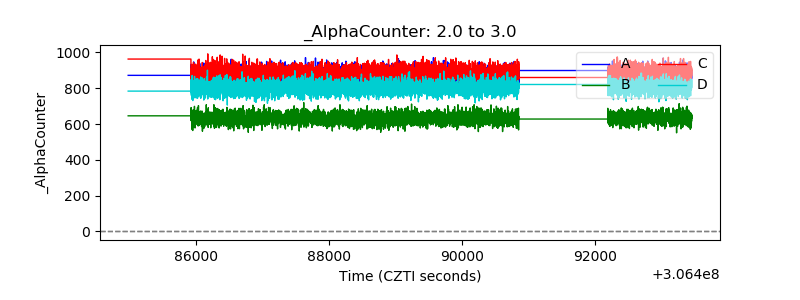 |
| _CPM_Rate | 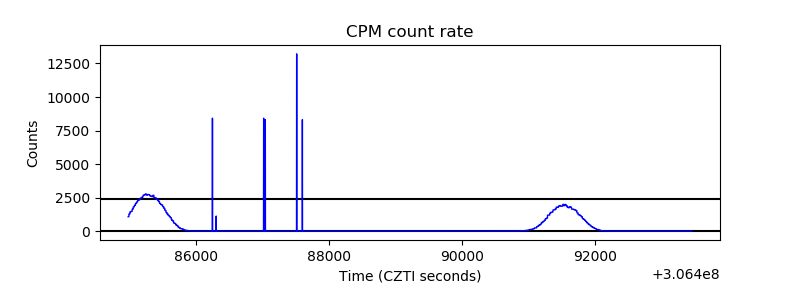 |
| CZT Counter | 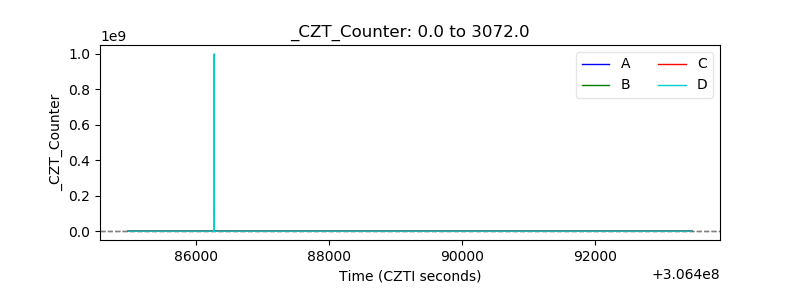 |
| +2.5 Volts monitor |  |
| +5 Volts monitor |  |
| _ROLL_ROT | 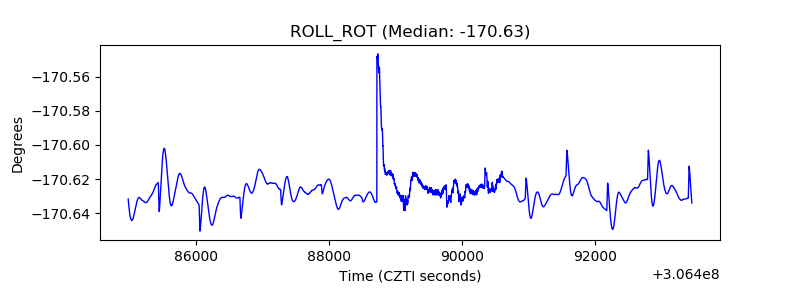 |
| _Roll_DEC |  |
| _Roll_RA | 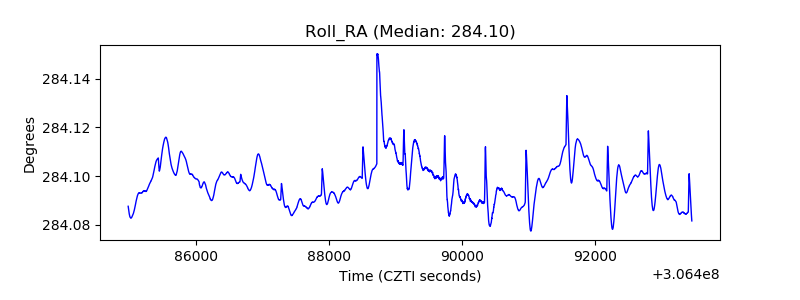 |
| Veto Counter | 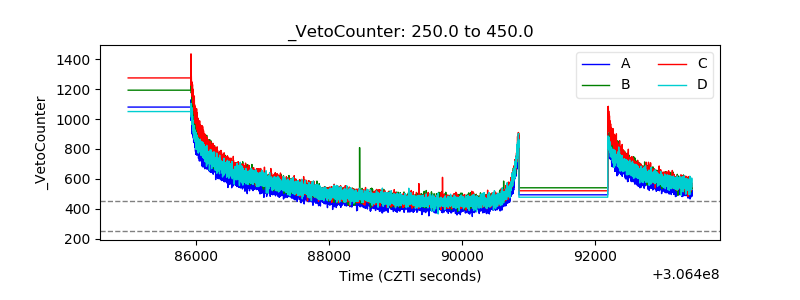 |