| Param | Original file | Final file |
|---|---|---|
| Filename | modeM0/AS1T03_141T01_9000003174_21481cztM0_level2.evt | modeM0/AS1T03_141T01_9000003174_21481cztM0_level2_quad_clean.evt |
| Size (bytes) | 489,260,160 | 103,579,200 |
| Size | 466.6 MB | 98.8 MB |
| Events in quadrant A | 3,418,501 | 680,252 |
| Events in quadrant B | 3,582,120 | 694,628 |
| Events in quadrant C | 3,456,721 | 671,160 |
| Events in quadrant D | 3,929,348 | 648,302 |
| Mode M9 | |||
|---|---|---|---|
| Quadrant | BADHDUFLAG | Total packets | Discarded packets |
| A | 0 | 16 | 0 |
| B | 0 | 17 | 0 |
| C | 0 | 17 | 0 |
| D | 0 | 17 | 0 |
| Mode M0 | |||
|---|---|---|---|
| Quadrant | BADHDUFLAG | Total packets | Discarded packets |
| A | 0 | 14054 | 0 |
| B | 0 | 14621 | 0 |
| C | 0 | 14257 | 0 |
| D | 0 | 15539 | 0 |
| Mode SS | |||
|---|---|---|---|
| Quadrant | BADHDUFLAG | Total packets | Discarded packets |
| A | 0 | 125 | 45 |
| B | 0 | 125 | 47 |
| C | 0 | 124 | 52 |
| D | 0 | 123 | 43 |
| Quadrant | Total seconds | Saturated seconds | Saturation percentage |
|---|---|---|---|
| A | 6344 | 113 | 1.781211% |
| B | 6344 | 142 | 2.238335% |
| C | 6344 | 192 | 3.026482% |
| D | 6344 | 252 | 3.972257% |
Noise dominated data is calculated using 1-second bins in cleaned event files. If a bin has >2000 counts, and if more than 50% of those come from <1% of pixels, then it is considered to be noise-dominated and hence unusable.
| Quadrant | # 1 sec bins | Bins with >0 counts | Bins with >2000 counts | High rate bins dominated by noise | Noise dominated (total time) | Noise dominated (detector-on time) | Marked lightcurve |
|---|---|---|---|---|---|---|---|
| A | 7609 | 6344 | 0 | 0 | 0.00% | 0.00% | 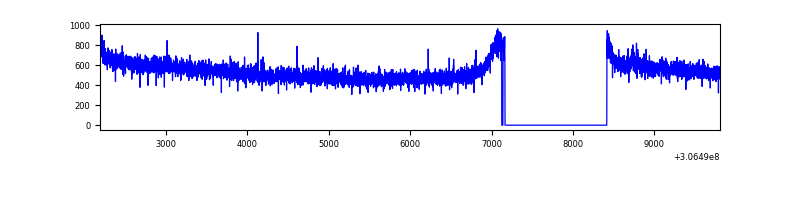 |
| B | 7609 | 6344 | 2 | 2 | 0.03% | 0.03% | 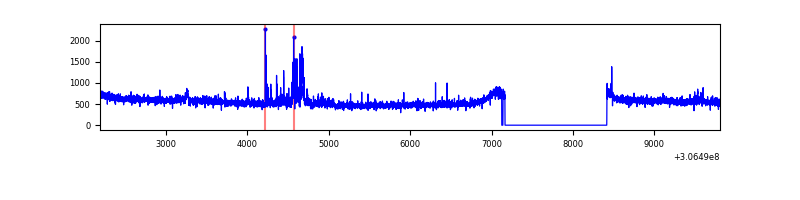 |
| C | 7609 | 6344 | 0 | 0 | 0.00% | 0.00% | 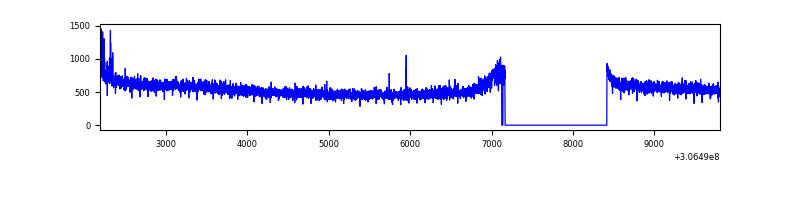 |
| D | 7609 | 6344 | 154 | 154 | 2.02% | 2.43% | 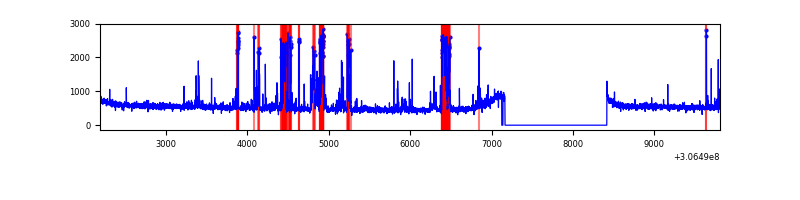 |
Top three noisy pixels from each quadrant. If the there are fewer than three noisy pixels in the level2.evt file, extra rows are filled as -1
| Pixel properties | Quadrant properties | ||||||
|---|---|---|---|---|---|---|---|
| Quadrant | DetID | PixID | Counts | Sigma | Mean | Median | Sigma |
| A | 14 | 111 | 10085 | 52.77 | 884 | 867 | 174.7 |
| A | 13 | 254 | 9862 | 51.49 | 884 | 867 | 174.7 |
| A | 0 | 226 | 7726 | 39.26 | 884 | 867 | 174.7 |
| B | 0 | 190 | 99240 | 605.73 | 874 | 851 | 162.4 |
| B | 0 | 230 | 29723 | 177.75 | 874 | 851 | 162.4 |
| B | 12 | 111 | 18492 | 108.61 | 874 | 851 | 162.4 |
| C | 14 | 238 | 136580 | 706.34 | 844 | 851 | 192.2 |
| C | 3 | 233 | 26884 | 135.48 | 844 | 851 | 192.2 |
| C | 13 | 61 | 5853 | 26.03 | 844 | 851 | 192.2 |
| D | 7 | 38 | 599086 | 2905.41 | 859 | 833 | 205.9 |
| D | 2 | 234 | 24396 | 114.43 | 859 | 833 | 205.9 |
| D | 13 | 153 | 23702 | 111.06 | 859 | 833 | 205.9 |
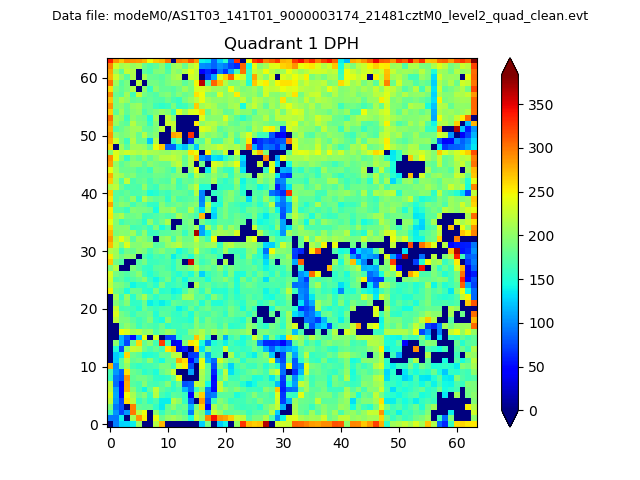
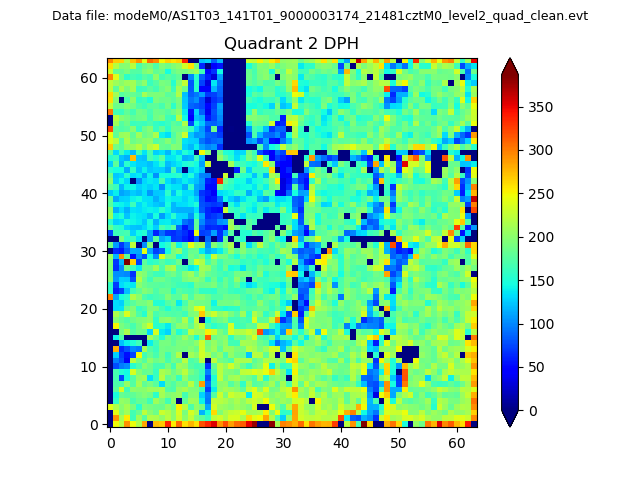
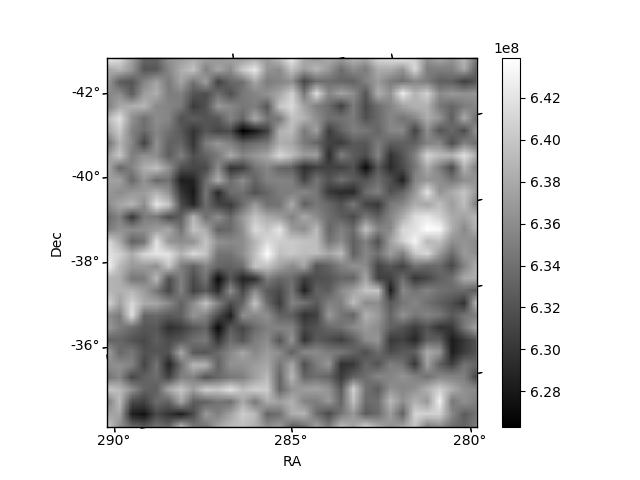
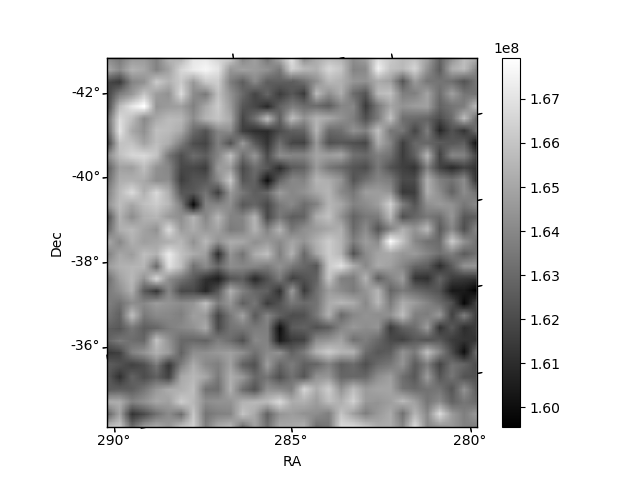
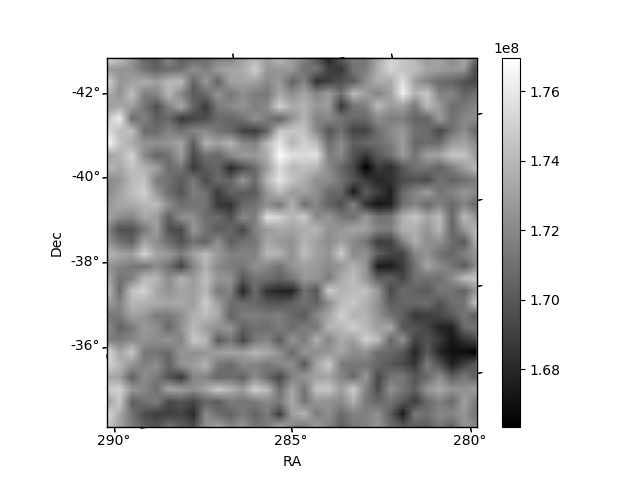
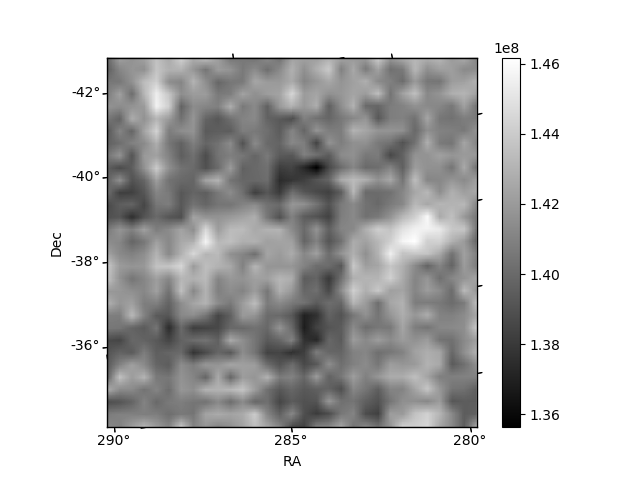
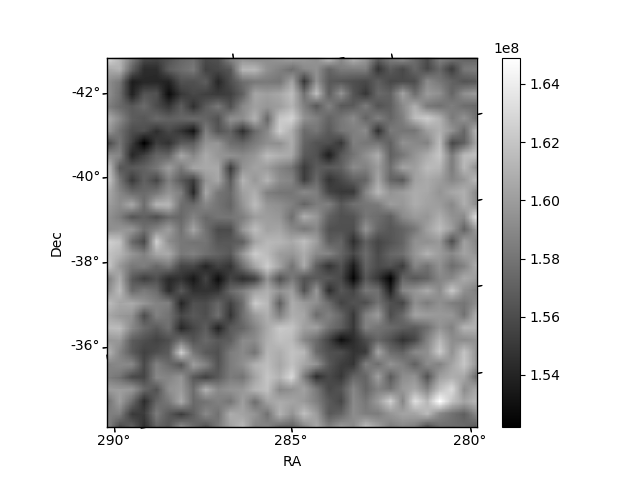
Histogram calculated using DETX and DETY for each event in the final _common_clean file
| Quadrant A |  |
 |
Quadrant B |
|---|---|---|---|
| Quadrant D | 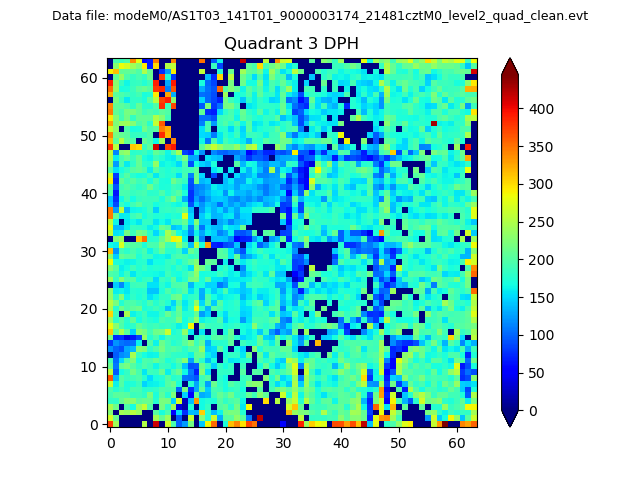 |
 |
Quadrant C |
| Plot type | Count rate plots | Images |
|---|---|---|
| Comparison with Poisson distribution Blue bars denote a histogram of data divided into 1 sec bins. Red curve is a Poisson curve with rate = median count rate of data. |
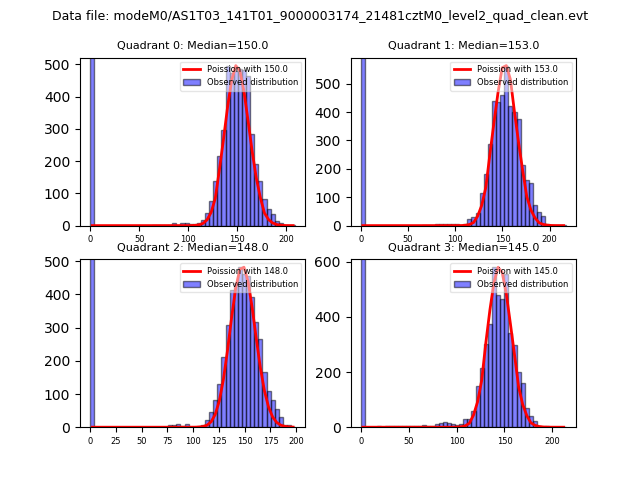 |
 |
| Quadrant-wise count rates Data is divided into 100 sec bins |
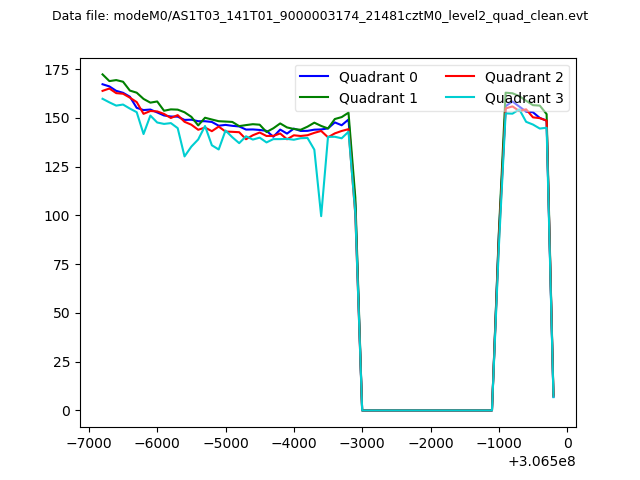 |
|
| Module-wise count rates for Quadrant A Data is divided into 100 sec bins |
 |
 |
| Module-wise count rates for Quadrant B Data is divided into 100 sec bins |
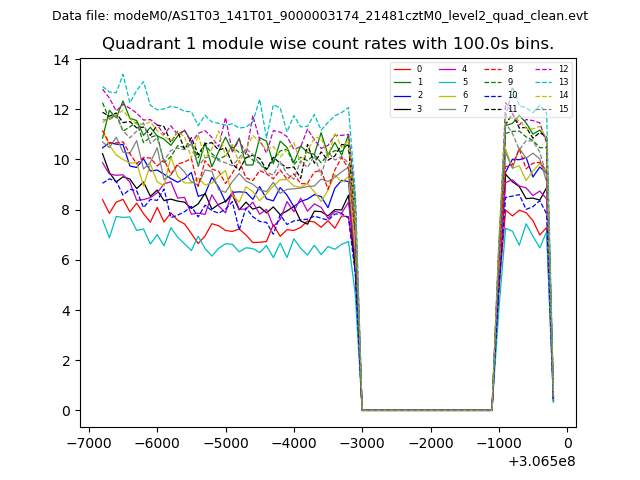 |
 |
| Module-wise count rates for Quadrant C Data is divided into 100 sec bins |
 |
 |
| Module-wise count rates for Quadrant D Data is divided into 100 sec bins |
 |
 |
| Parameter | Plot |
|---|---|
| CZT HV Monitor |  |
| D_VDD | 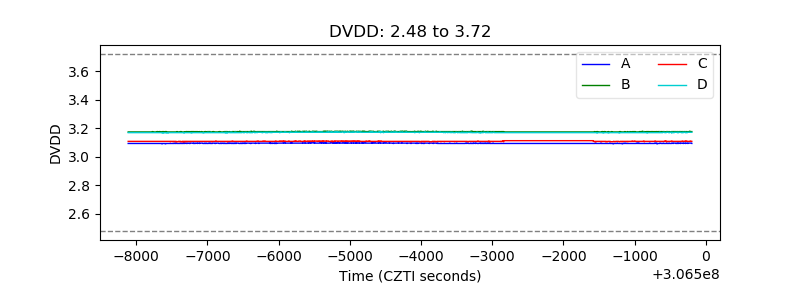 |
| Temperature 1 | 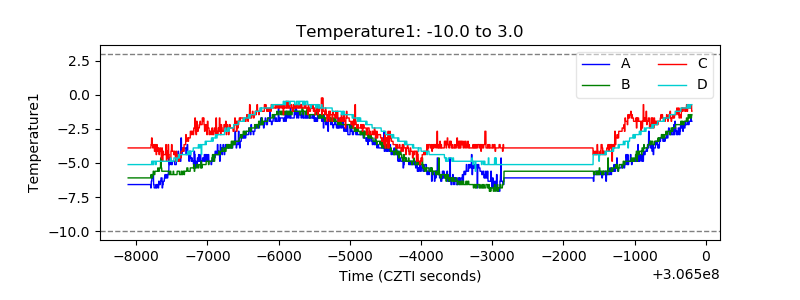 |
| Veto HV Monitor | 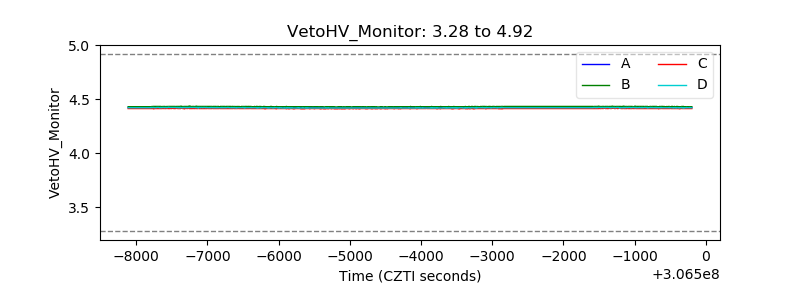 |
| Veto LLD |  |
| Alpha Counter | 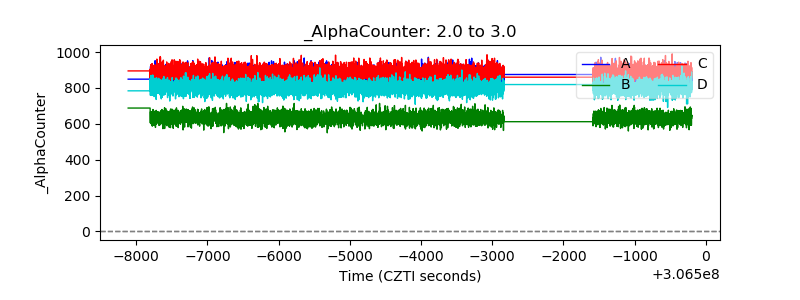 |
| _CPM_Rate | 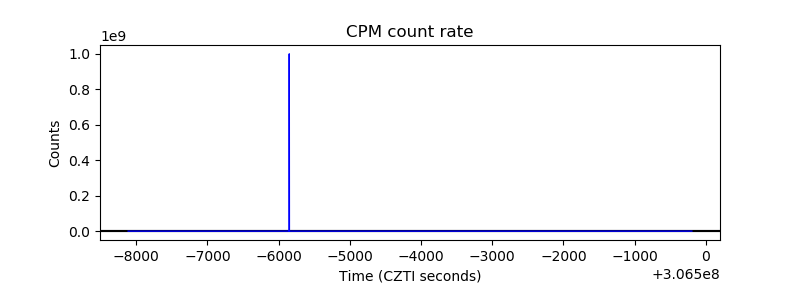 |
| CZT Counter | 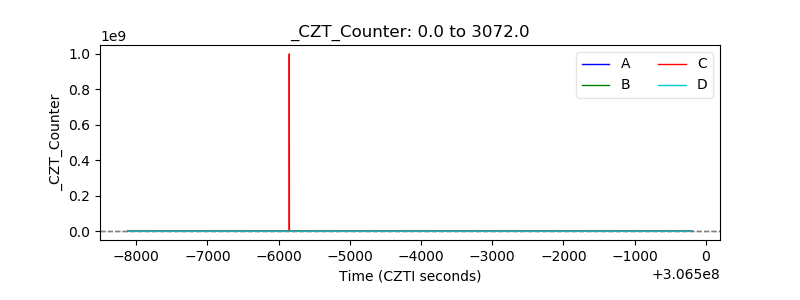 |
| +2.5 Volts monitor |  |
| +5 Volts monitor |  |
| _ROLL_ROT | 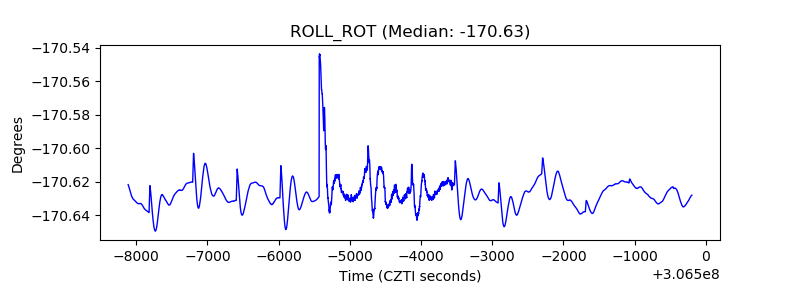 |
| _Roll_DEC | 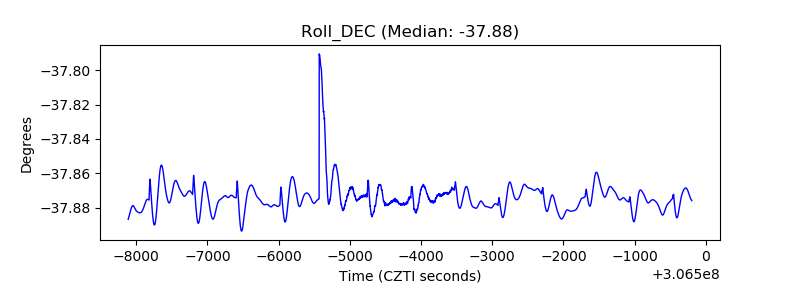 |
| _Roll_RA | 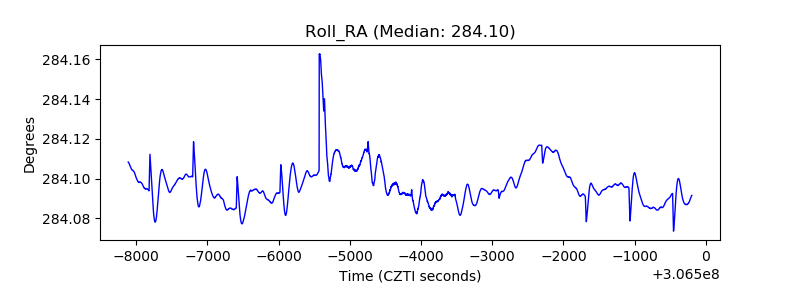 |
| Veto Counter | 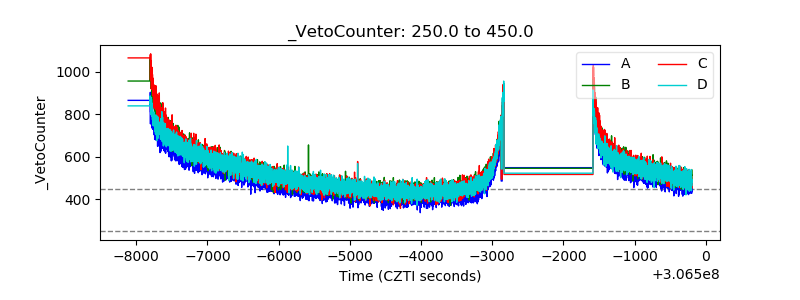 |