| Param | Original file | Final file |
|---|---|---|
| Filename | modeM0/AS1T03_141T01_9000003174_21482cztM0_level2.evt | modeM0/AS1T03_141T01_9000003174_21482cztM0_level2_quad_clean.evt |
| Size (bytes) | 469,108,800 | 105,390,720 |
| Size | 447.4 MB | 100.5 MB |
| Events in quadrant A | 3,290,025 | 696,275 |
| Events in quadrant B | 3,437,139 | 706,334 |
| Events in quadrant C | 3,279,566 | 682,611 |
| Events in quadrant D | 3,761,571 | 656,271 |
| Mode M9 | |||
|---|---|---|---|
| Quadrant | BADHDUFLAG | Total packets | Discarded packets |
| A | 0 | 11 | 0 |
| B | 0 | 11 | 0 |
| C | 0 | 11 | 0 |
| D | 0 | 11 | 0 |
| Mode M0 | |||
|---|---|---|---|
| Quadrant | BADHDUFLAG | Total packets | Discarded packets |
| A | 0 | 13694 | 0 |
| B | 0 | 14037 | 0 |
| C | 0 | 13701 | 0 |
| D | 0 | 15166 | 0 |
| Mode SS | |||
|---|---|---|---|
| Quadrant | BADHDUFLAG | Total packets | Discarded packets |
| A | 0 | 132 | 0 |
| B | 0 | 132 | 0 |
| C | 0 | 132 | 0 |
| D | 0 | 132 | 0 |
| Quadrant | Total seconds | Saturated seconds | Saturation percentage |
|---|---|---|---|
| A | 6452 | 96 | 1.487911% |
| B | 6453 | 115 | 1.782117% |
| C | 6453 | 150 | 2.324500% |
| D | 6453 | 221 | 3.424764% |
Noise dominated data is calculated using 1-second bins in cleaned event files. If a bin has >2000 counts, and if more than 50% of those come from <1% of pixels, then it is considered to be noise-dominated and hence unusable.
| Quadrant | # 1 sec bins | Bins with >0 counts | Bins with >2000 counts | High rate bins dominated by noise | Noise dominated (total time) | Noise dominated (detector-on time) | Marked lightcurve |
|---|---|---|---|---|---|---|---|
| A | 7527 | 6452 | 0 | 0 | 0.00% | 0.00% | 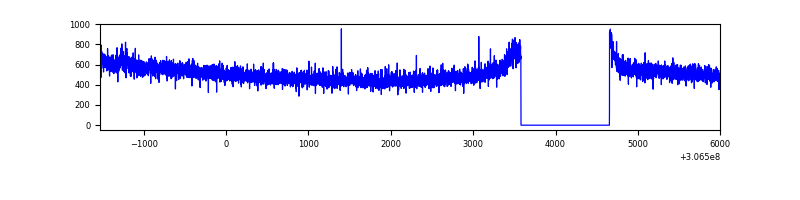 |
| B | 7528 | 6453 | 6 | 6 | 0.08% | 0.09% | 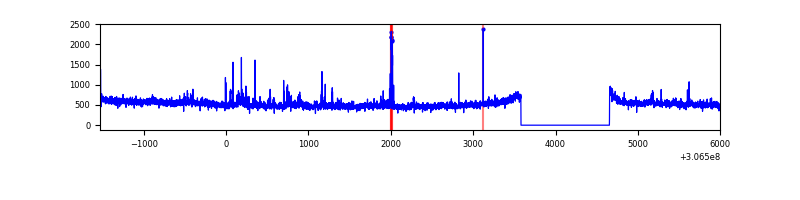 |
| C | 7528 | 6453 | 0 | 0 | 0.00% | 0.00% | 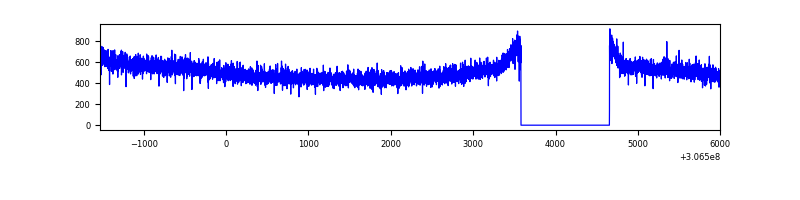 |
| D | 7528 | 6453 | 155 | 155 | 2.06% | 2.40% | 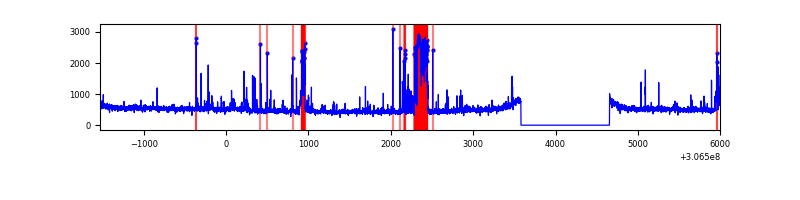 |
Top three noisy pixels from each quadrant. If the there are fewer than three noisy pixels in the level2.evt file, extra rows are filled as -1
| Pixel properties | Quadrant properties | ||||||
|---|---|---|---|---|---|---|---|
| Quadrant | DetID | PixID | Counts | Sigma | Mean | Median | Sigma |
| A | 14 | 111 | 13038 | 72.65 | 850 | 835 | 168.0 |
| A | 13 | 254 | 9476 | 51.44 | 850 | 835 | 168.0 |
| A | 0 | 226 | 7329 | 38.66 | 850 | 835 | 168.0 |
| B | 0 | 230 | 38177 | 237.47 | 840 | 822 | 157.3 |
| B | 0 | 190 | 26552 | 163.57 | 840 | 822 | 157.3 |
| B | 6 | 36 | 25416 | 156.35 | 840 | 822 | 157.3 |
| C | 14 | 238 | 129745 | 694.22 | 807 | 815 | 185.7 |
| C | 13 | 61 | 5873 | 27.23 | 807 | 815 | 185.7 |
| C | 3 | 233 | 2644 | 9.85 | 807 | 815 | 185.7 |
| D | 7 | 38 | 477863 | 2422.94 | 818 | 794 | 196.9 |
| D | 5 | 222 | 82222 | 413.55 | 818 | 794 | 196.9 |
| D | 13 | 153 | 37443 | 186.13 | 818 | 794 | 196.9 |
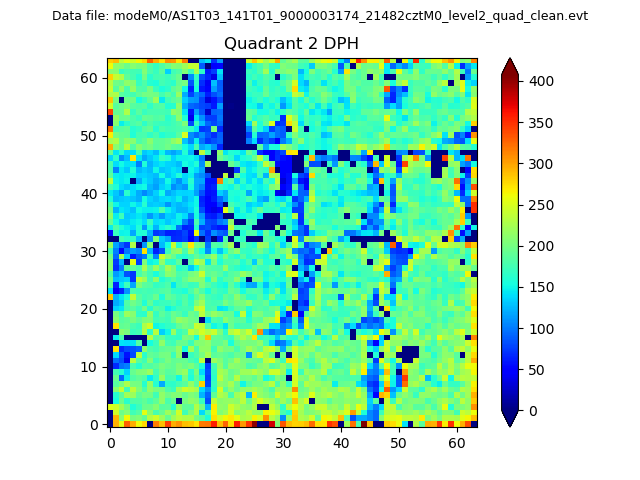
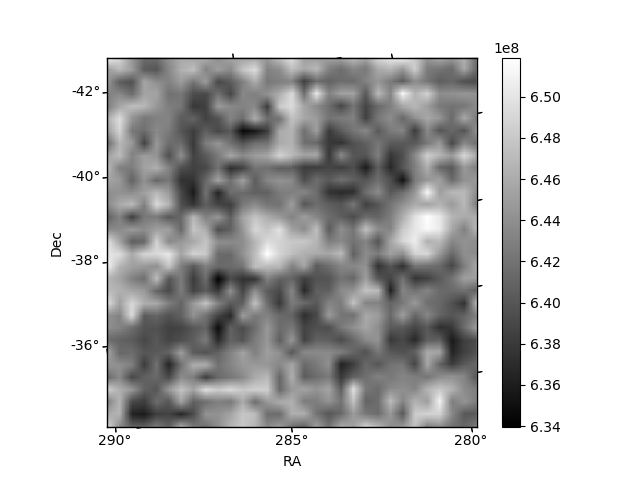
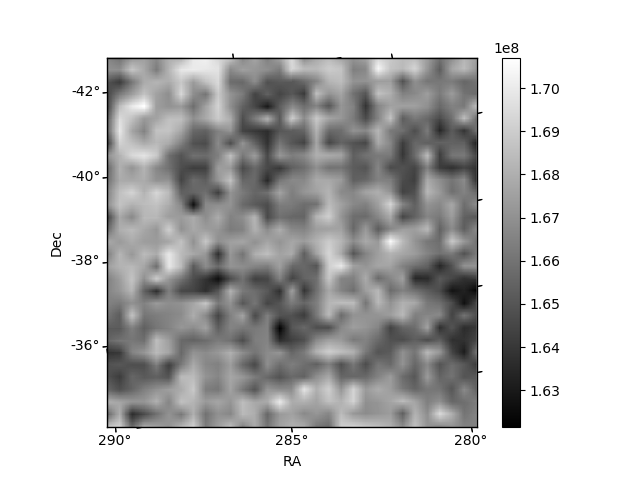
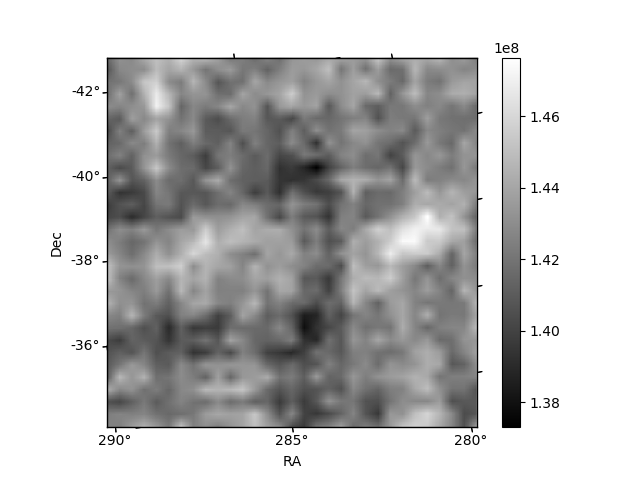
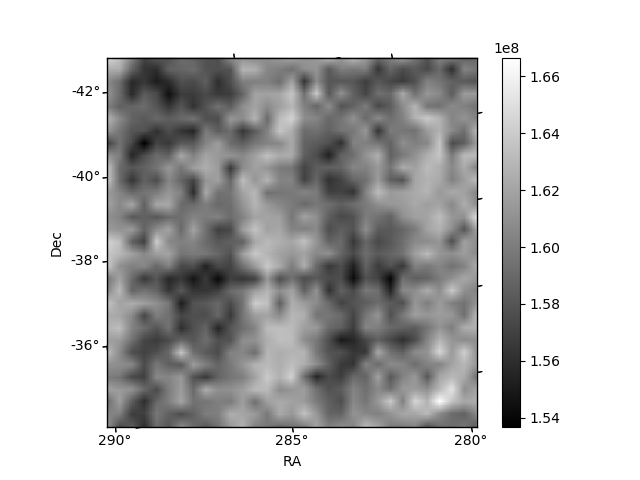
Histogram calculated using DETX and DETY for each event in the final _common_clean file
| Quadrant A | 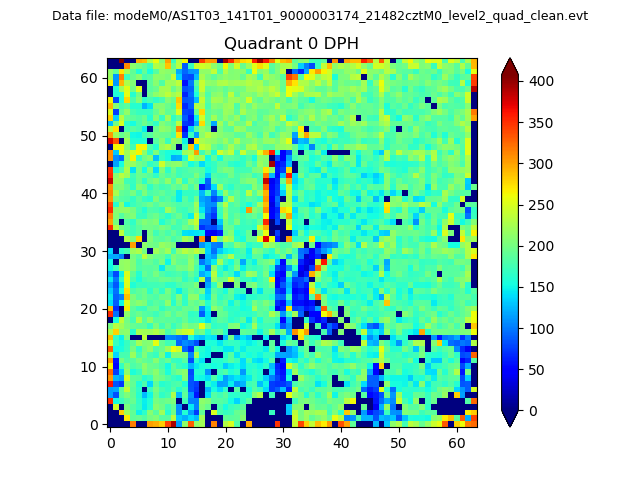 |
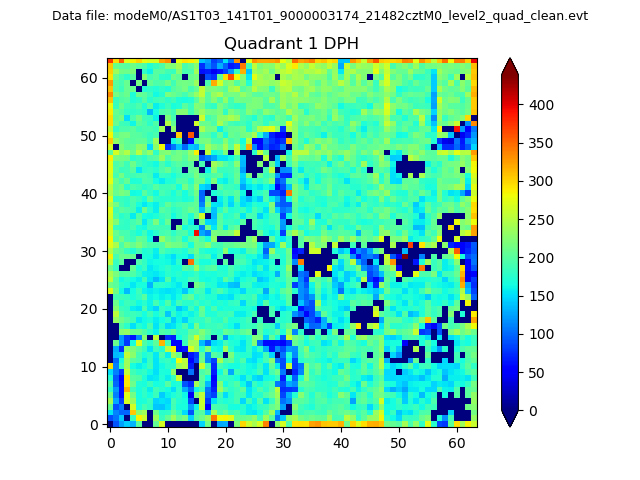 |
Quadrant B |
|---|---|---|---|
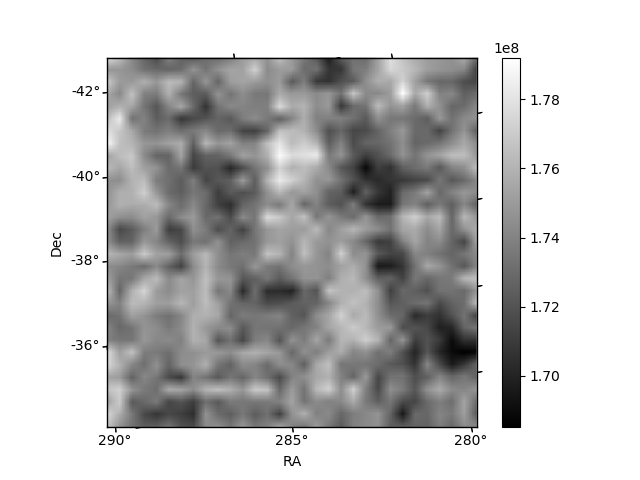
| Quadrant D | 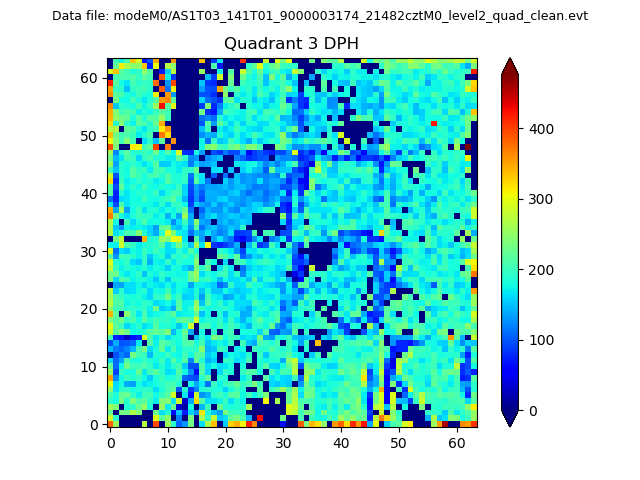 |
 |
Quadrant C |
| Plot type | Count rate plots | Images |
|---|---|---|
| Comparison with Poisson distribution Blue bars denote a histogram of data divided into 1 sec bins. Red curve is a Poisson curve with rate = median count rate of data. |
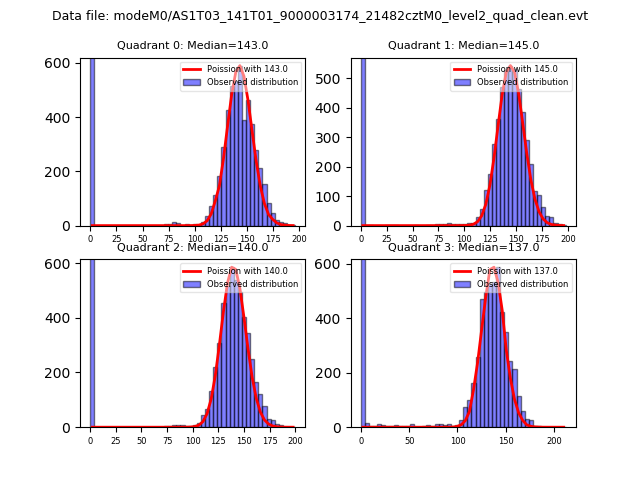 |
 |
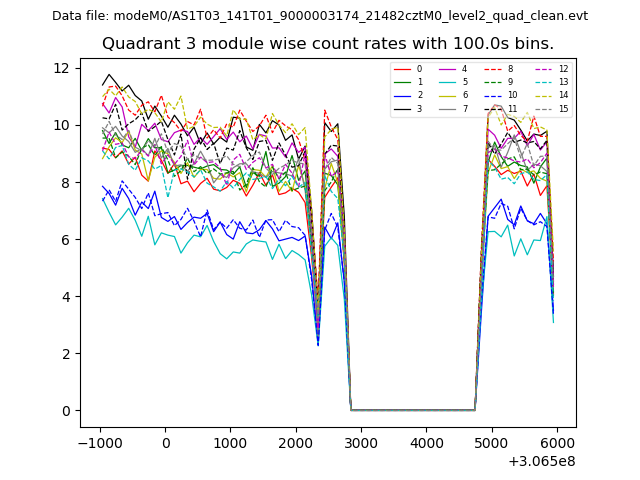
| Quadrant-wise count rates Data is divided into 100 sec bins |
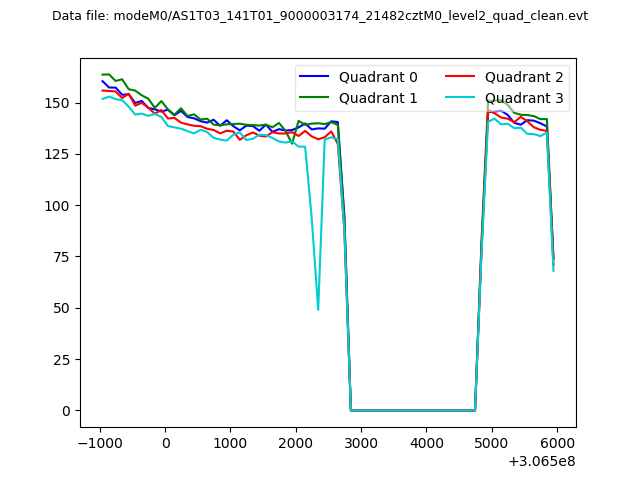 |
|
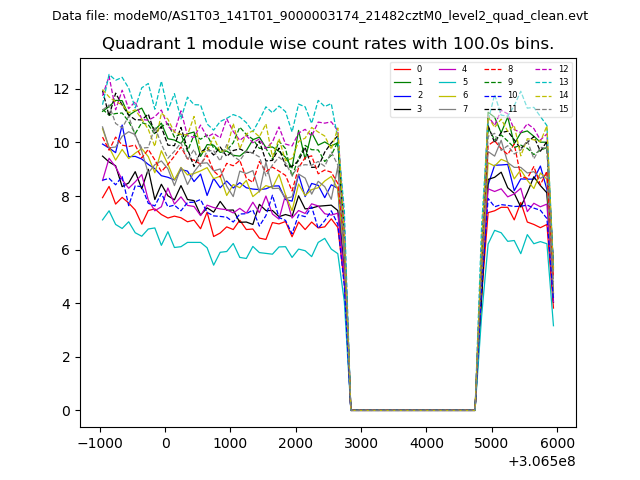
| Module-wise count rates for Quadrant A Data is divided into 100 sec bins |
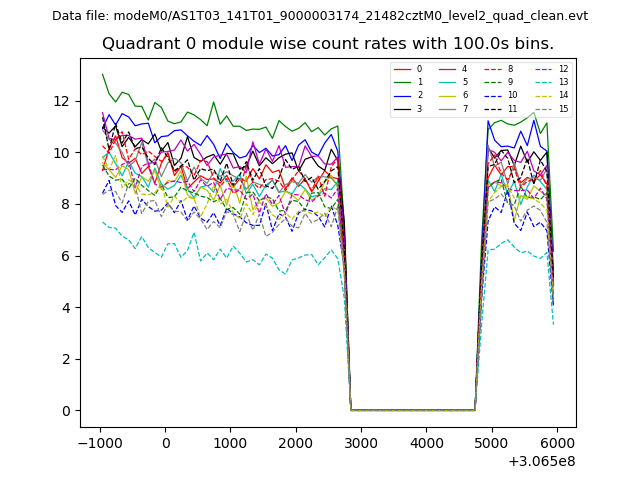 |
 |
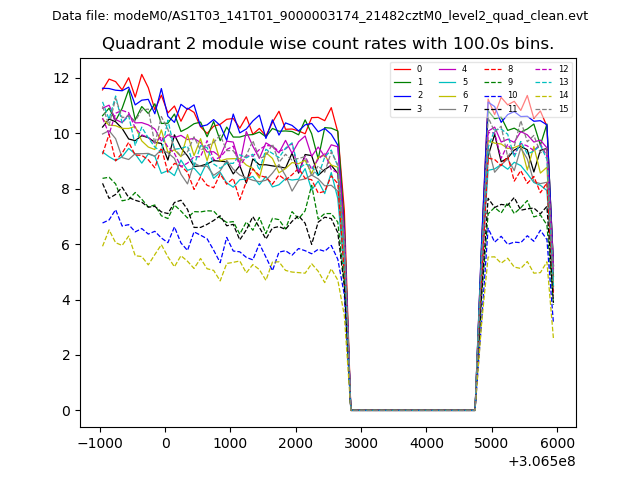
| Module-wise count rates for Quadrant B Data is divided into 100 sec bins |
 |
 |
| Module-wise count rates for Quadrant C Data is divided into 100 sec bins |
 |
 |
| Module-wise count rates for Quadrant D Data is divided into 100 sec bins |
 |
 |
| Parameter | Plot |
|---|---|
| CZT HV Monitor | 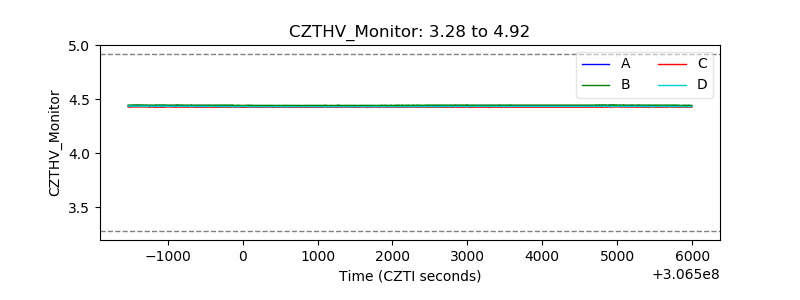 |
| D_VDD | 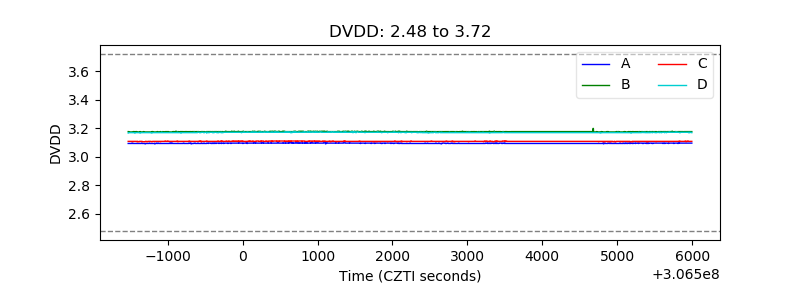 |
| Temperature 1 | 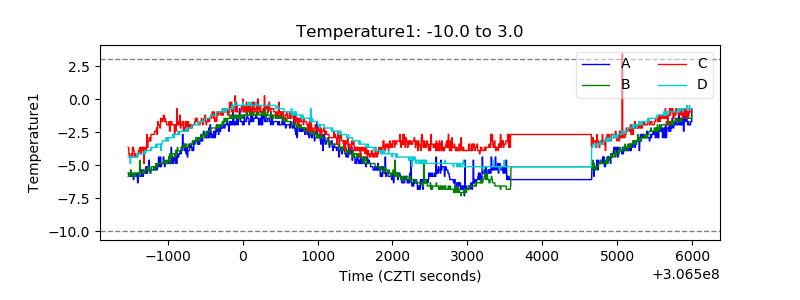 |
| Veto HV Monitor | 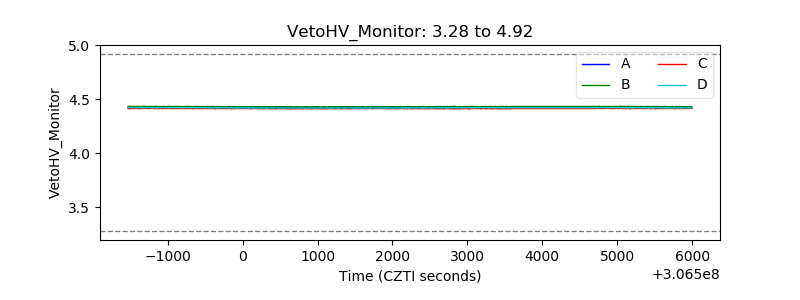 |
| Veto LLD | 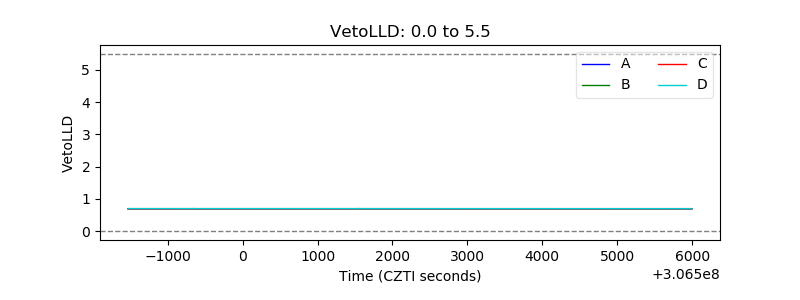 |
| Alpha Counter |  |
| _CPM_Rate | 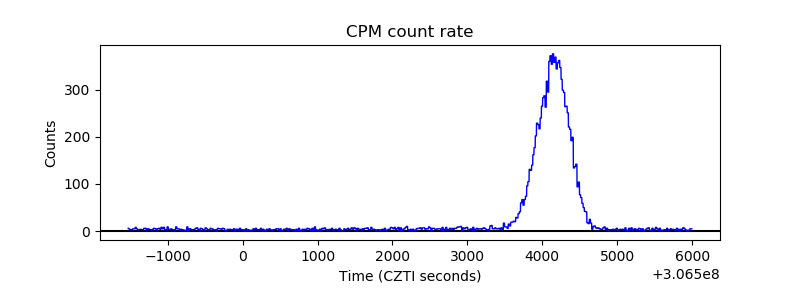 |
| CZT Counter | 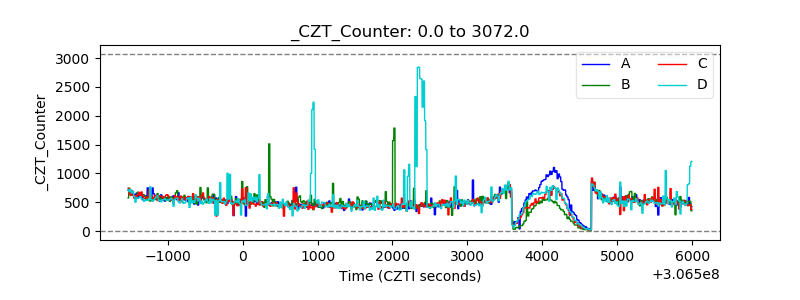 |
| +2.5 Volts monitor |  |
| +5 Volts monitor | 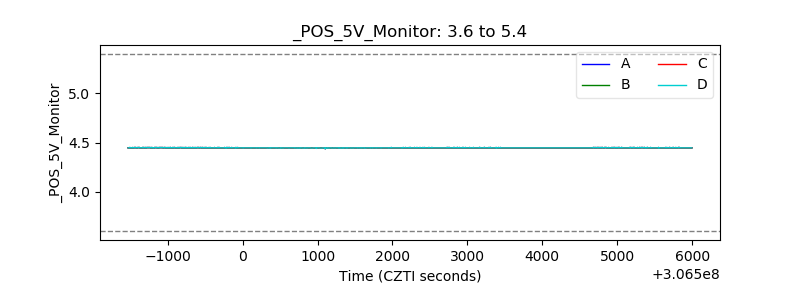 |
| _ROLL_ROT | 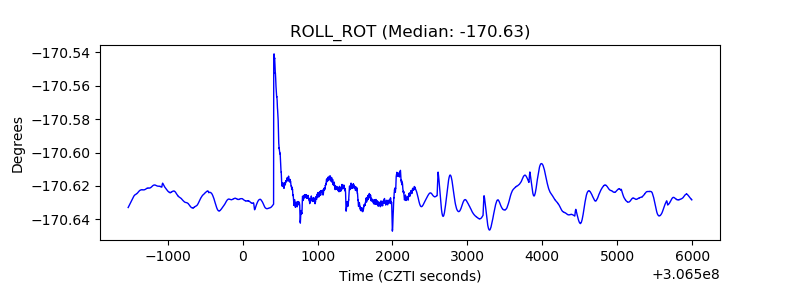 |
| _Roll_DEC | 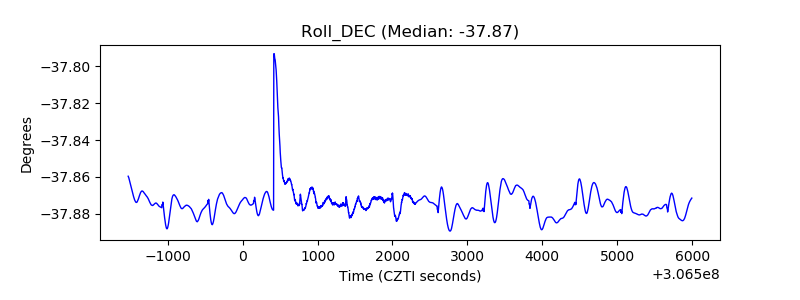 |
| _Roll_RA | 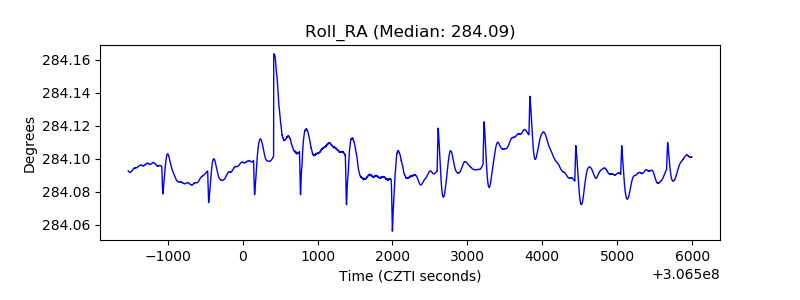 |
| Veto Counter | 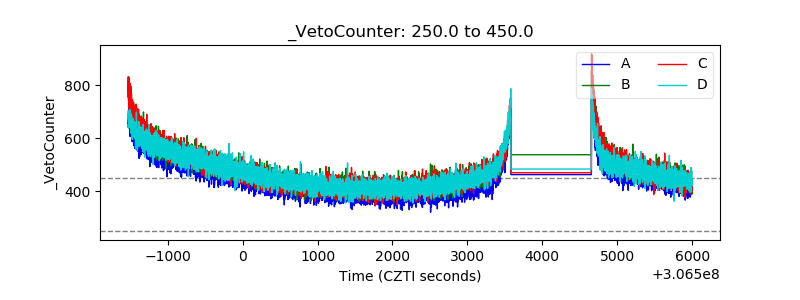 |