| Param | Original file | Final file |
|---|---|---|
| Filename | modeM0/AS1T03_141T01_9000003174_21483cztM0_level2.evt | modeM0/AS1T03_141T01_9000003174_21483cztM0_level2_quad_clean.evt |
| Size (bytes) | 501,036,480 | 104,644,800 |
| Size | 477.8 MB | 99.8 MB |
| Events in quadrant A | 3,196,629 | 693,388 |
| Events in quadrant B | 3,410,125 | 707,252 |
| Events in quadrant C | 3,202,525 | 682,920 |
| Events in quadrant D | 4,914,747 | 623,514 |
| Mode M9 | |||
|---|---|---|---|
| Quadrant | BADHDUFLAG | Total packets | Discarded packets |
| A | 0 | 7 | 0 |
| B | 0 | 7 | 0 |
| C | 0 | 7 | 0 |
| D | 0 | 7 | 0 |
| Mode M0 | |||
|---|---|---|---|
| Quadrant | BADHDUFLAG | Total packets | Discarded packets |
| A | 0 | 13645 | 0 |
| B | 0 | 14139 | 0 |
| C | 0 | 13685 | 0 |
| D | 0 | 18900 | 0 |
| Mode SS | |||
|---|---|---|---|
| Quadrant | BADHDUFLAG | Total packets | Discarded packets |
| A | 0 | 134 | 0 |
| B | 0 | 134 | 0 |
| C | 0 | 134 | 0 |
| D | 0 | 134 | 0 |
| Quadrant | Total seconds | Saturated seconds | Saturation percentage |
|---|---|---|---|
| A | 6625 | 76 | 1.147170% |
| B | 6626 | 106 | 1.599759% |
| C | 6626 | 100 | 1.509206% |
| D | 6626 | 607 | 9.160881% |
Noise dominated data is calculated using 1-second bins in cleaned event files. If a bin has >2000 counts, and if more than 50% of those come from <1% of pixels, then it is considered to be noise-dominated and hence unusable.
| Quadrant | # 1 sec bins | Bins with >0 counts | Bins with >2000 counts | High rate bins dominated by noise | Noise dominated (total time) | Noise dominated (detector-on time) | Marked lightcurve |
|---|---|---|---|---|---|---|---|
| A | 7350 | 6625 | 0 | 0 | 0.00% | 0.00% |  |
| B | 7351 | 6626 | 21 | 21 | 0.29% | 0.32% | 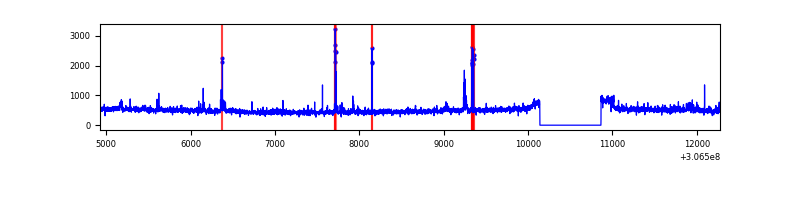 |
| C | 7351 | 6626 | 0 | 0 | 0.00% | 0.00% | 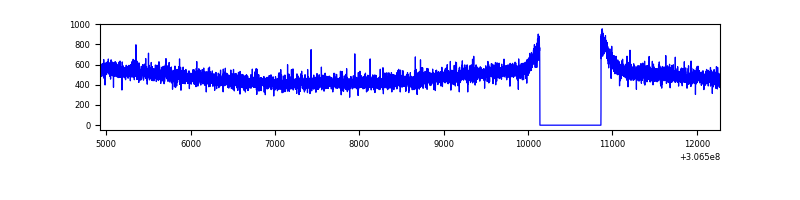 |
| D | 7351 | 6626 | 539 | 539 | 7.33% | 8.13% | 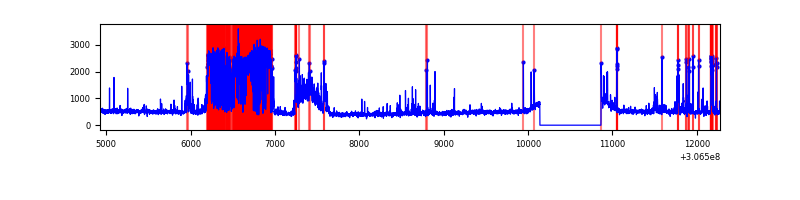 |
Top three noisy pixels from each quadrant. If the there are fewer than three noisy pixels in the level2.evt file, extra rows are filled as -1
| Pixel properties | Quadrant properties | ||||||
|---|---|---|---|---|---|---|---|
| Quadrant | DetID | PixID | Counts | Sigma | Mean | Median | Sigma |
| A | 13 | 254 | 10127 | 56.2 | 829 | 812 | 165.7 |
| A | 0 | 226 | 7076 | 37.79 | 829 | 812 | 165.7 |
| A | 3 | 137 | 6754 | 35.85 | 829 | 812 | 165.7 |
| B | 3 | 64 | 89586 | 565.69 | 824 | 804 | 156.9 |
| B | 0 | 230 | 54521 | 342.27 | 824 | 804 | 156.9 |
| B | 0 | 190 | 28845 | 178.67 | 824 | 804 | 156.9 |
| C | 14 | 238 | 124371 | 671.64 | 789 | 795 | 184.0 |
| C | 13 | 61 | 5649 | 26.38 | 789 | 795 | 184.0 |
| C | 3 | 202 | 1863 | 5.8 | 789 | 795 | 184.0 |
| D | 5 | 222 | 1135424 | 6097.74 | 770 | 749 | 186.1 |
| D | 7 | 38 | 598172 | 3210.55 | 770 | 749 | 186.1 |
| D | 13 | 153 | 86708 | 461.94 | 770 | 749 | 186.1 |
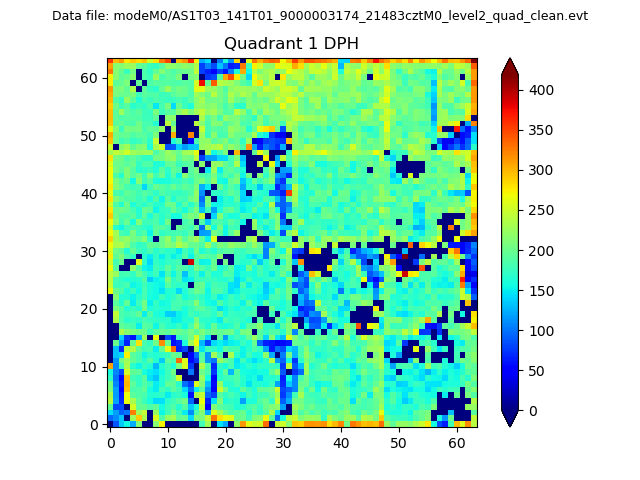
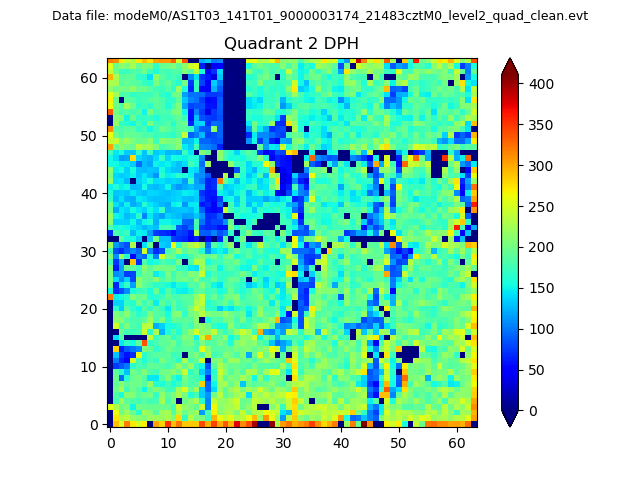
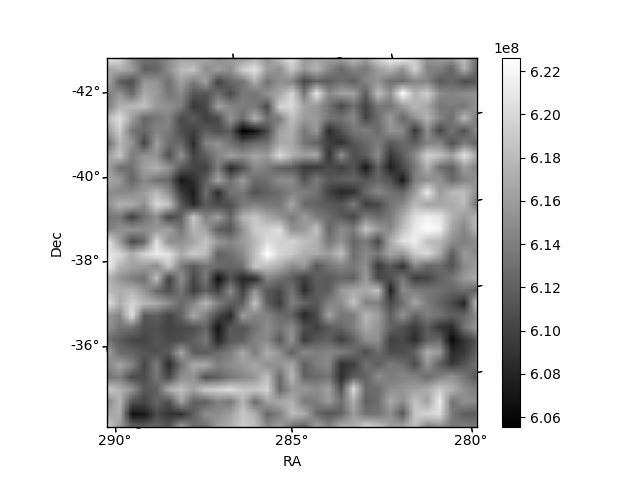
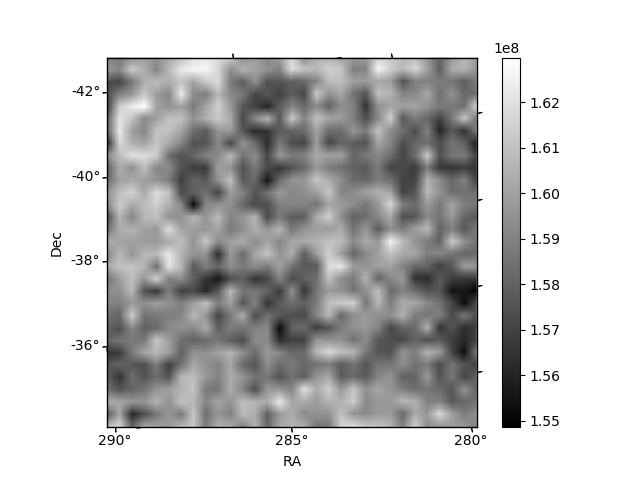
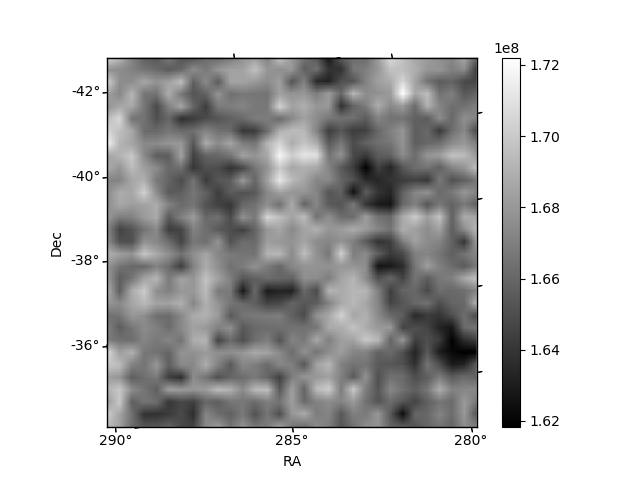
Histogram calculated using DETX and DETY for each event in the final _common_clean file
| Quadrant A | 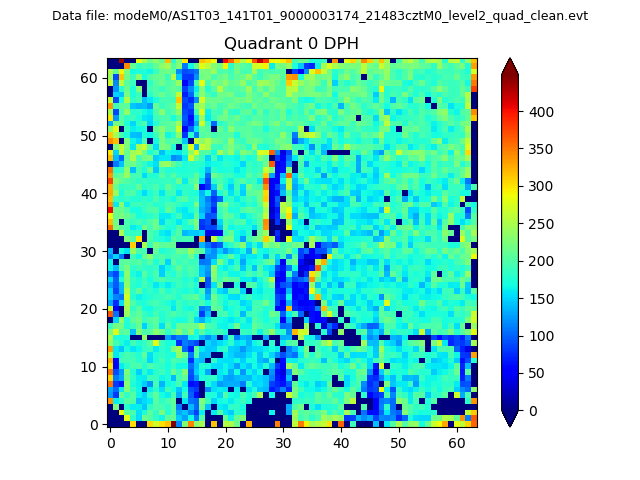 |
 |
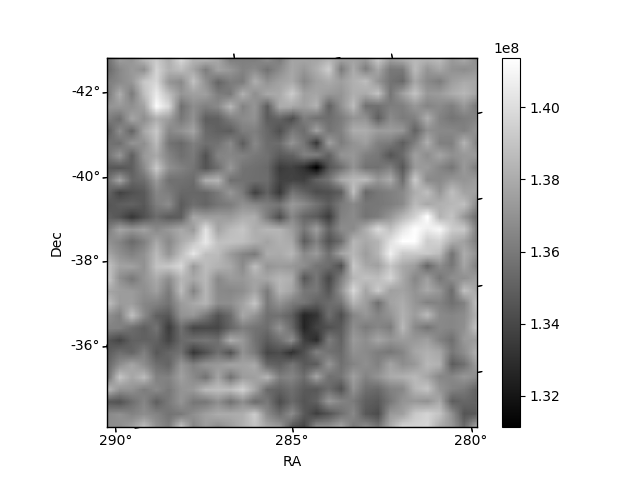
Quadrant B |
|---|---|---|---|
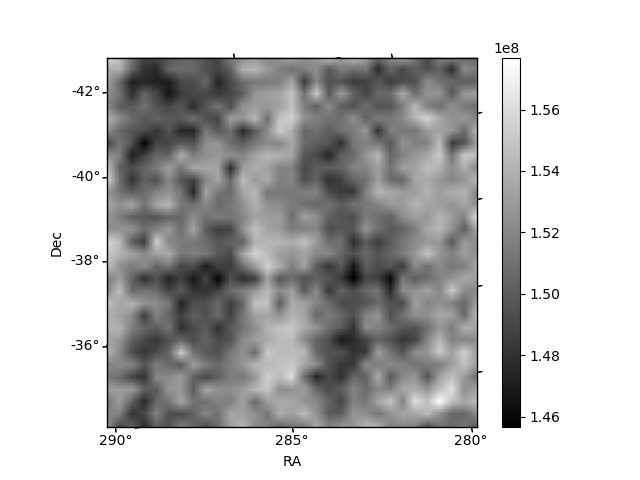
| Quadrant D | 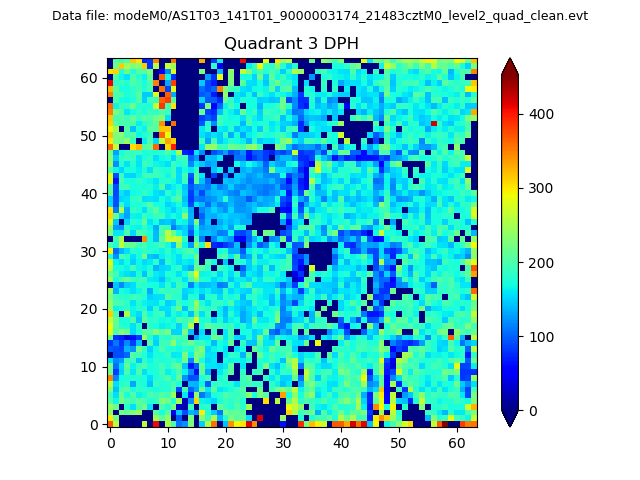 |
 |
Quadrant C |
| Plot type | Count rate plots | Images |
|---|---|---|
| Comparison with Poisson distribution Blue bars denote a histogram of data divided into 1 sec bins. Red curve is a Poisson curve with rate = median count rate of data. |
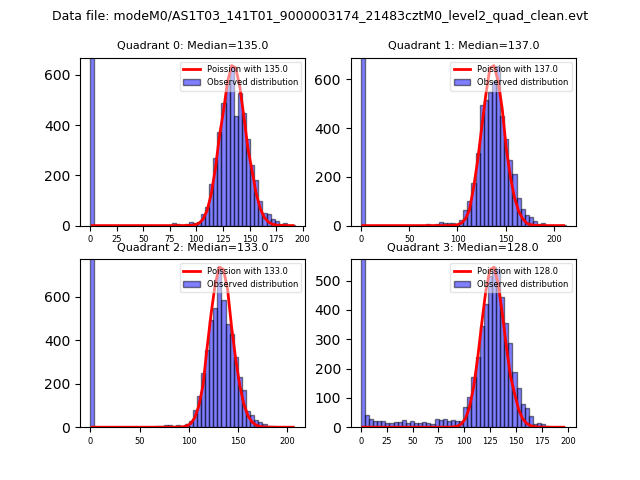 |
 |
| Quadrant-wise count rates Data is divided into 100 sec bins |
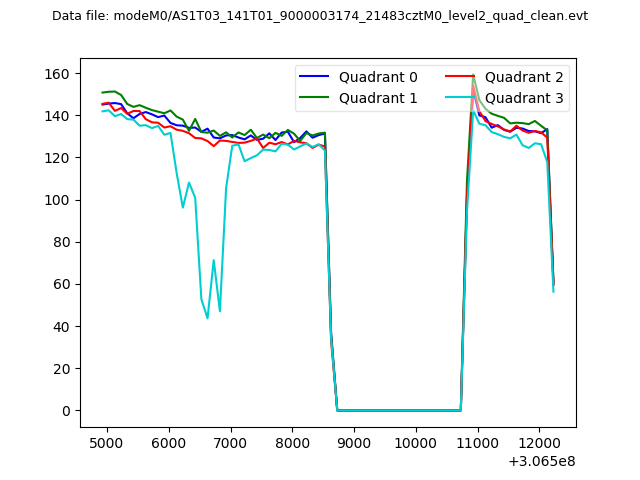 |
|
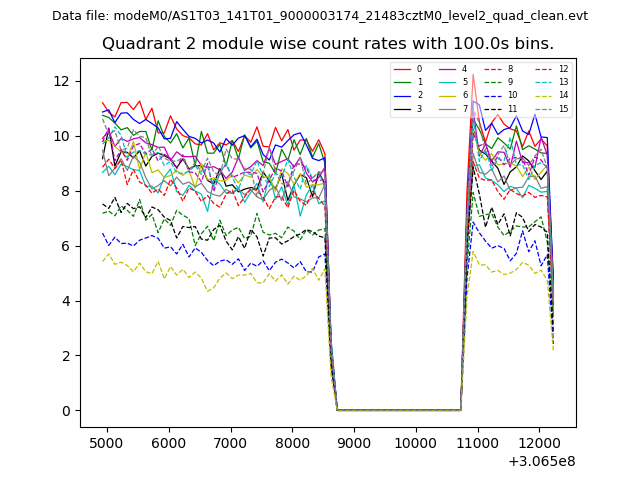
| Module-wise count rates for Quadrant A Data is divided into 100 sec bins |
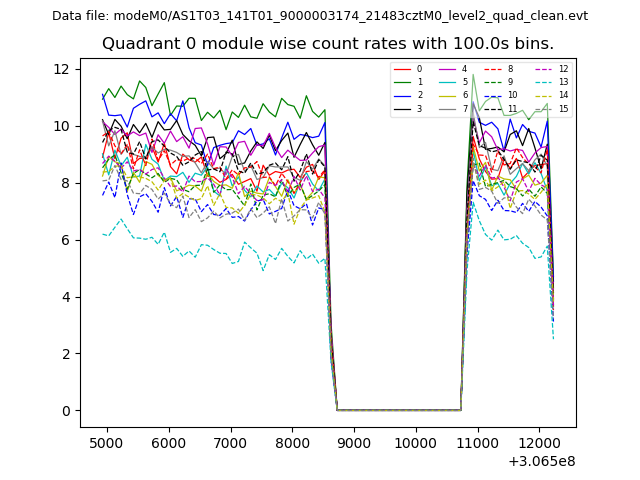 |
 |
| Module-wise count rates for Quadrant B Data is divided into 100 sec bins |
 |
 |
| Module-wise count rates for Quadrant C Data is divided into 100 sec bins |
 |
 |
| Module-wise count rates for Quadrant D Data is divided into 100 sec bins |
 |
 |
| Parameter | Plot |
|---|---|
| CZT HV Monitor | 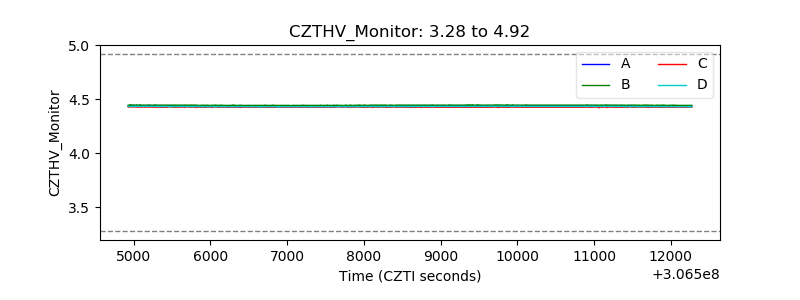 |
| D_VDD | 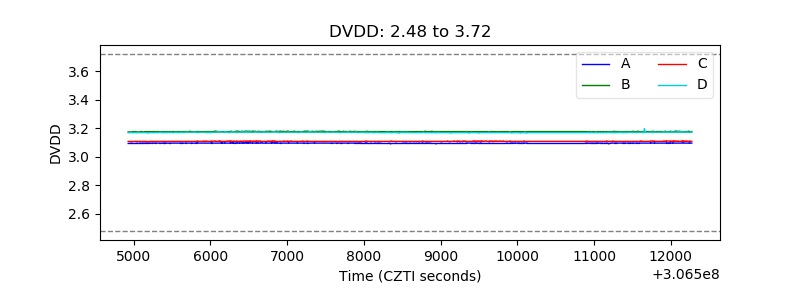 |
| Temperature 1 | 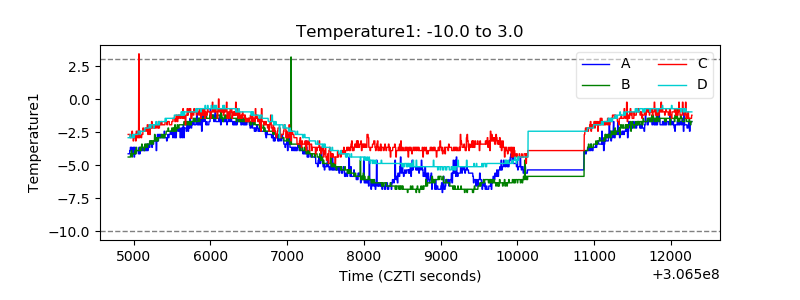 |
| Veto HV Monitor | 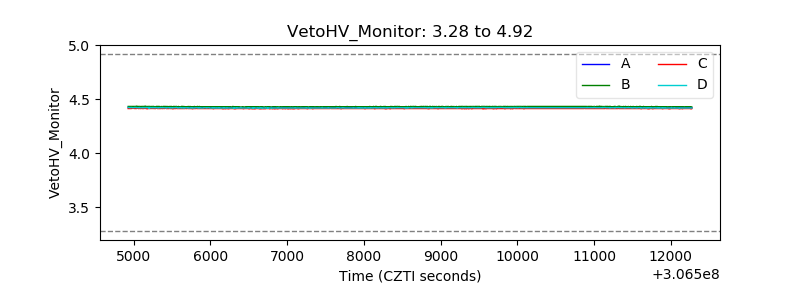 |
| Veto LLD | 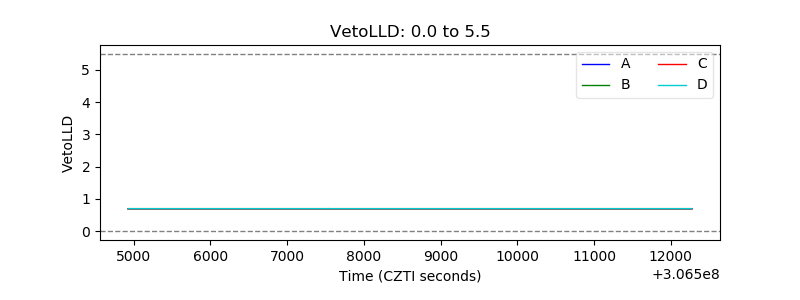 |
| Alpha Counter | 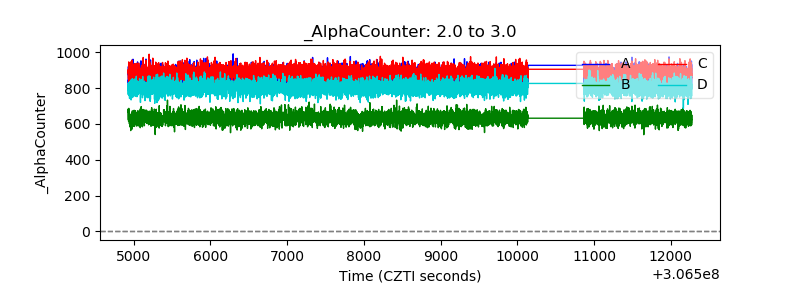 |
| _CPM_Rate | 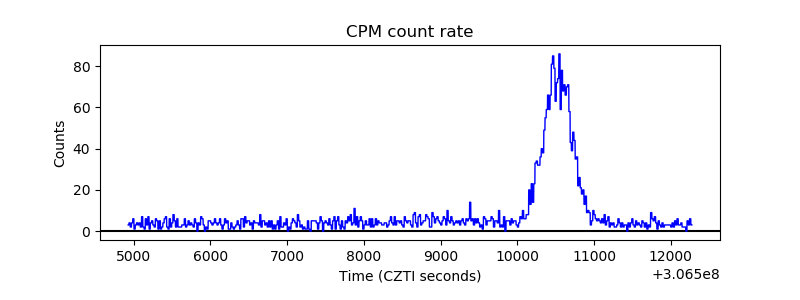 |
| CZT Counter | 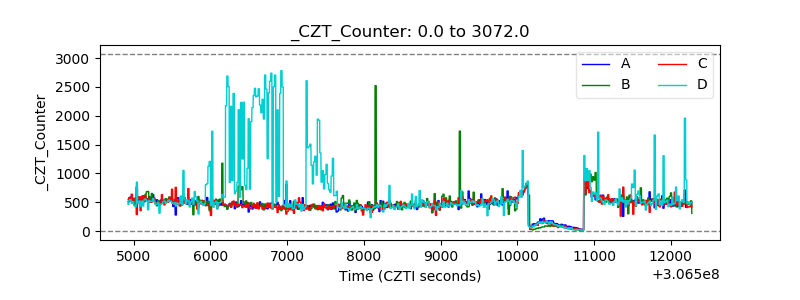 |
| +2.5 Volts monitor |  |
| +5 Volts monitor | 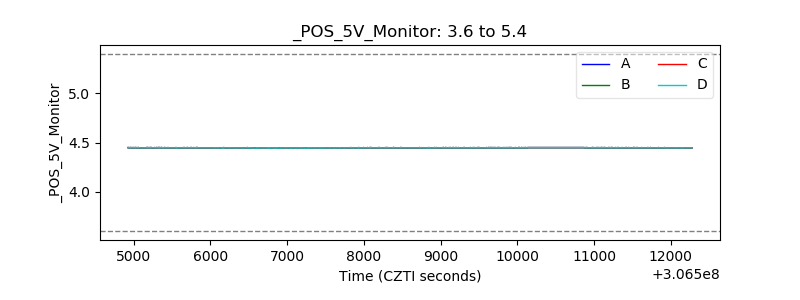 |
| _ROLL_ROT |  |
| _Roll_DEC | 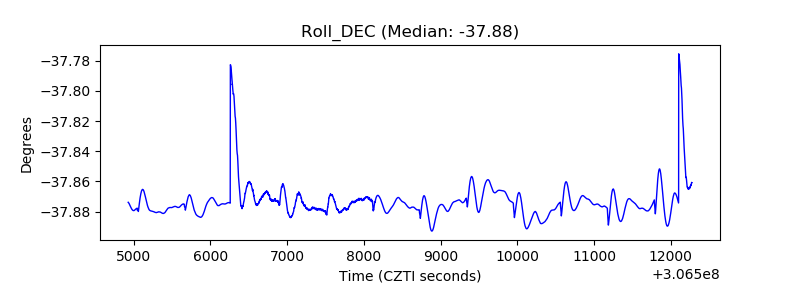 |
| _Roll_RA | 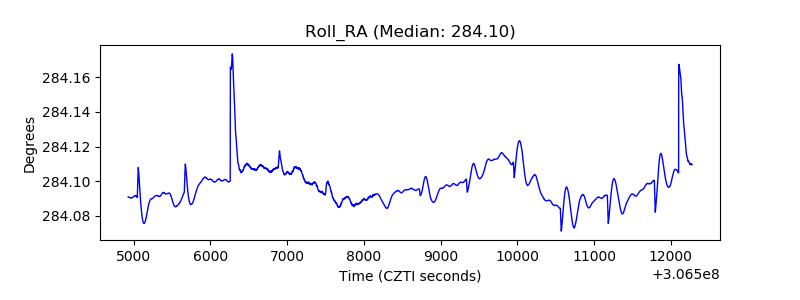 |
| Veto Counter | 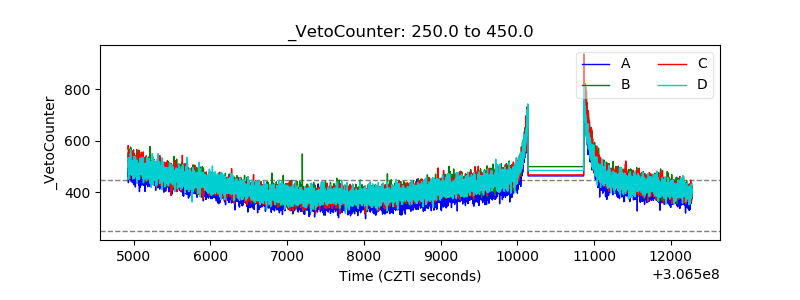 |