| Param | Original file | Final file |
|---|---|---|
| Filename | modeM0/AS1T03_141T01_9000003174_21486cztM0_level2.evt | modeM0/AS1T03_141T01_9000003174_21486cztM0_level2_quad_clean.evt |
| Size (bytes) | 523,932,480 | 110,946,240 |
| Size | 499.7 MB | 105.8 MB |
| Events in quadrant A | 3,588,349 | 715,645 |
| Events in quadrant B | 3,796,066 | 724,922 |
| Events in quadrant C | 3,604,389 | 706,157 |
| Events in quadrant D | 4,359,755 | 681,930 |
| Mode M9 | |||
|---|---|---|---|
| Quadrant | BADHDUFLAG | Total packets | Discarded packets |
| A | 0 | 6 | 0 |
| B | 0 | 6 | 0 |
| C | 0 | 6 | 0 |
| D | 0 | 6 | 0 |
| Mode M0 | |||
|---|---|---|---|
| Quadrant | BADHDUFLAG | Total packets | Discarded packets |
| A | 0 | 15807 | 0 |
| B | 0 | 16328 | 0 |
| C | 0 | 15851 | 0 |
| D | 0 | 18185 | 0 |
| Mode SS | |||
|---|---|---|---|
| Quadrant | BADHDUFLAG | Total packets | Discarded packets |
| A | 0 | 158 | 0 |
| B | 0 | 158 | 0 |
| C | 0 | 158 | 0 |
| D | 0 | 158 | 0 |
| Quadrant | Total seconds | Saturated seconds | Saturation percentage |
|---|---|---|---|
| A | 7635 | 54 | 0.707269% |
| B | 7636 | 117 | 1.532216% |
| C | 7635 | 101 | 1.322855% |
| D | 7635 | 183 | 2.396857% |
Noise dominated data is calculated using 1-second bins in cleaned event files. If a bin has >2000 counts, and if more than 50% of those come from <1% of pixels, then it is considered to be noise-dominated and hence unusable.
| Quadrant | # 1 sec bins | Bins with >0 counts | Bins with >2000 counts | High rate bins dominated by noise | Noise dominated (total time) | Noise dominated (detector-on time) | Marked lightcurve |
|---|---|---|---|---|---|---|---|
| A | 8315 | 7636 | 0 | 0 | 0.00% | 0.00% | 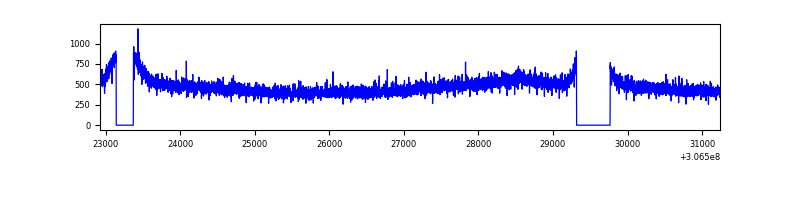 |
| B | 8316 | 7638 | 2 | 2 | 0.02% | 0.03% | 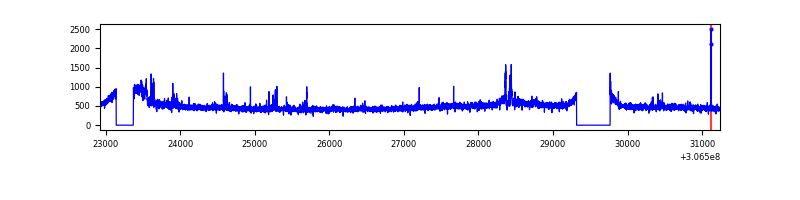 |
| C | 8315 | 7636 | 0 | 0 | 0.00% | 0.00% | 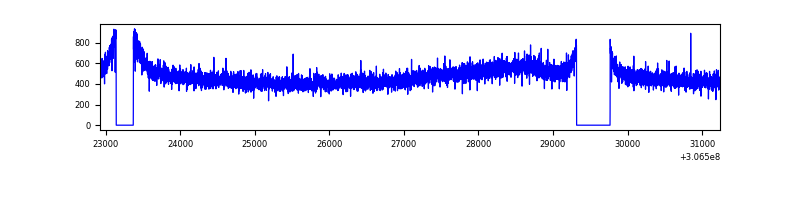 |
| D | 8315 | 7637 | 136 | 136 | 1.64% | 1.78% | 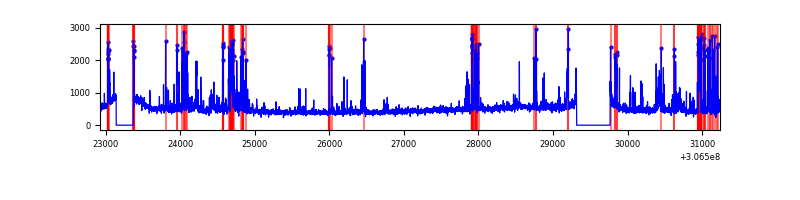 |
Top three noisy pixels from each quadrant. If the there are fewer than three noisy pixels in the level2.evt file, extra rows are filled as -1
| Pixel properties | Quadrant properties | ||||||
|---|---|---|---|---|---|---|---|
| Quadrant | DetID | PixID | Counts | Sigma | Mean | Median | Sigma |
| A | 13 | 254 | 12320 | 60.37 | 930 | 908 | 189.0 |
| A | 0 | 226 | 8055 | 37.81 | 930 | 908 | 189.0 |
| A | 3 | 137 | 7737 | 36.13 | 930 | 908 | 189.0 |
| B | 0 | 190 | 41437 | 226.46 | 929 | 904 | 179.0 |
| B | 0 | 229 | 38929 | 212.45 | 929 | 904 | 179.0 |
| B | 0 | 230 | 28624 | 154.87 | 929 | 904 | 179.0 |
| C | 14 | 238 | 139730 | 664.26 | 889 | 895 | 209.0 |
| C | 13 | 61 | 6325 | 25.98 | 889 | 895 | 209.0 |
| C | 14 | 111 | 2070 | 5.62 | 889 | 895 | 209.0 |
| D | 7 | 38 | 405626 | 1873.36 | 893 | 869 | 216.1 |
| D | 1 | 52 | 181260 | 834.91 | 893 | 869 | 216.1 |
| D | 13 | 153 | 177646 | 818.19 | 893 | 869 | 216.1 |
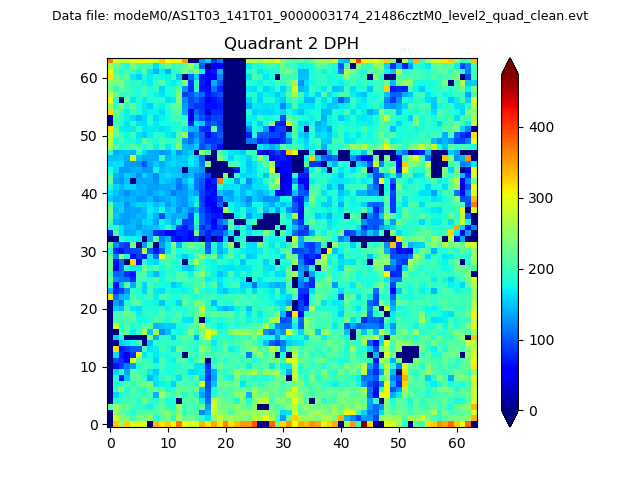
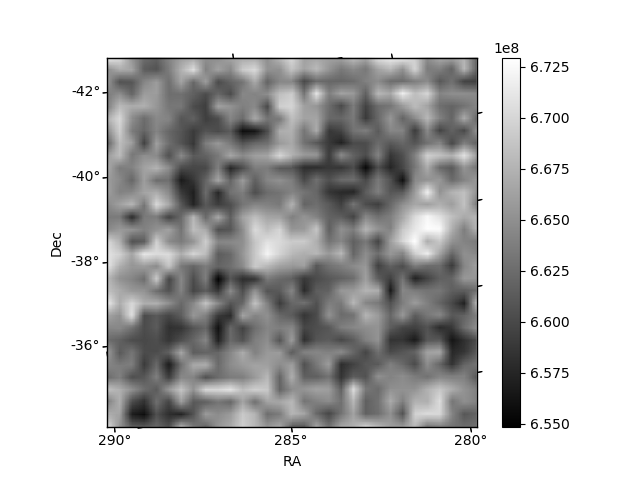
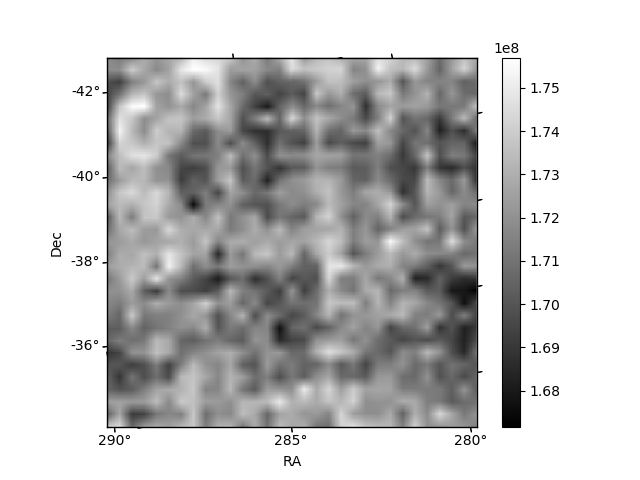
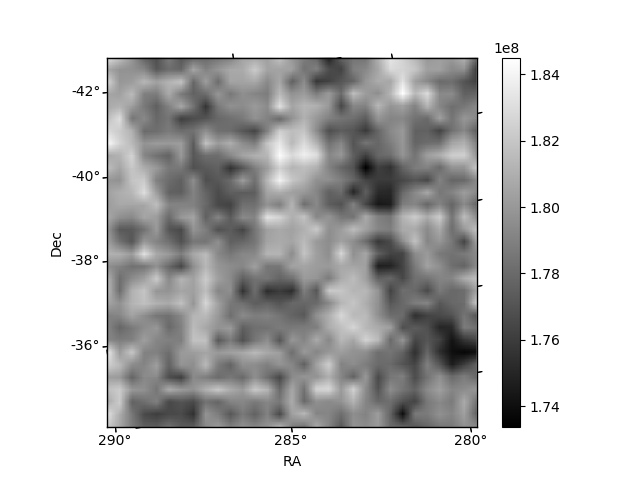
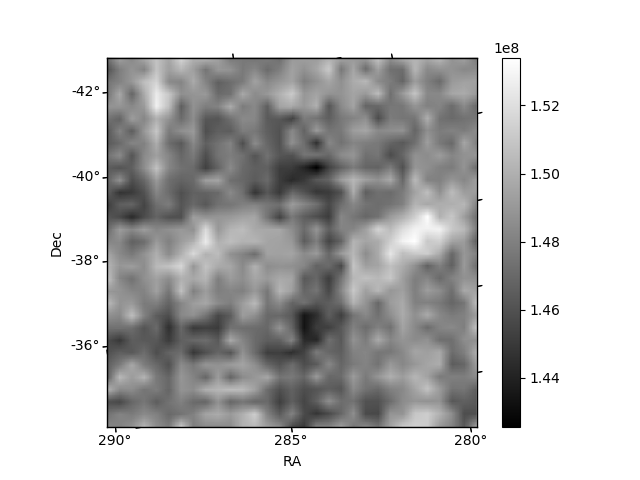
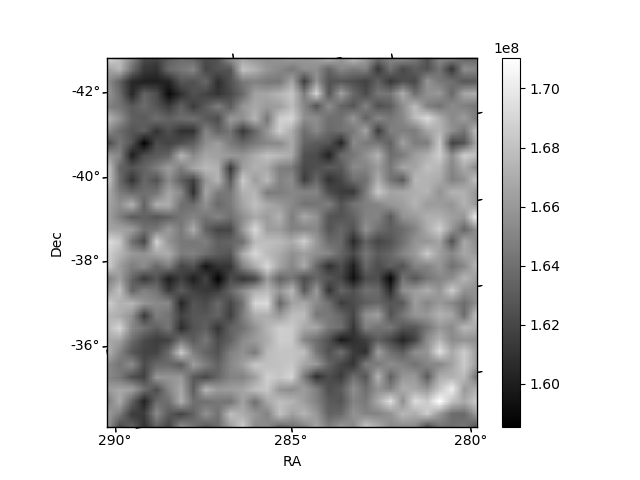
Histogram calculated using DETX and DETY for each event in the final _common_clean file
| Quadrant A | 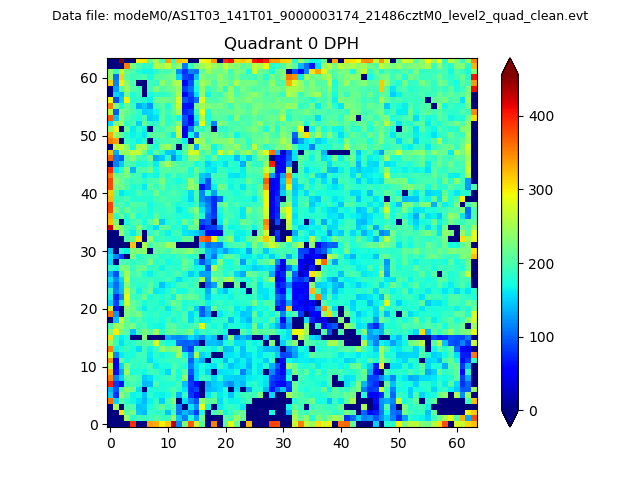 |
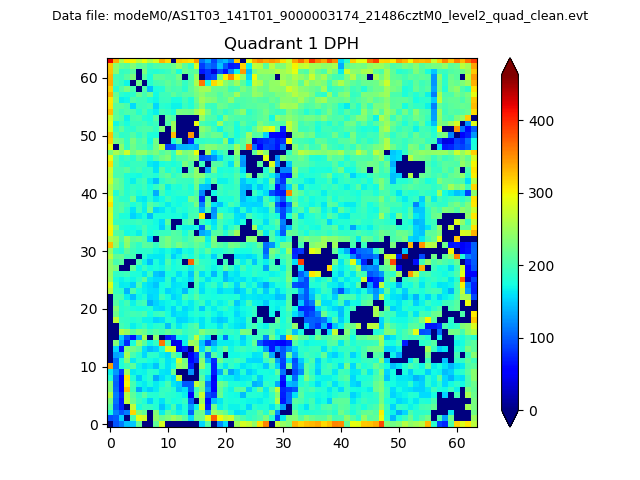 |
Quadrant B |
|---|---|---|---|
| Quadrant D | 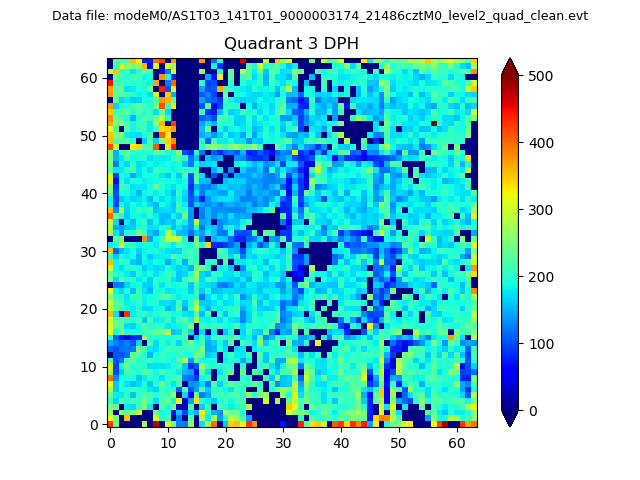 |
 |
Quadrant C |
| Plot type | Count rate plots | Images |
|---|---|---|
| Comparison with Poisson distribution Blue bars denote a histogram of data divided into 1 sec bins. Red curve is a Poisson curve with rate = median count rate of data. |
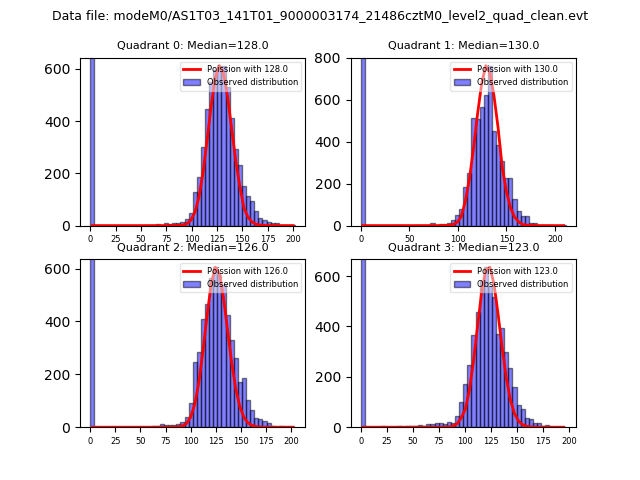 |
 |
| Quadrant-wise count rates Data is divided into 100 sec bins |
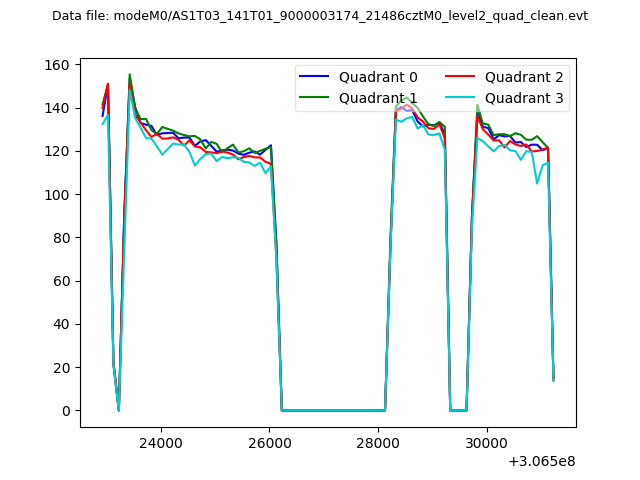 |
|
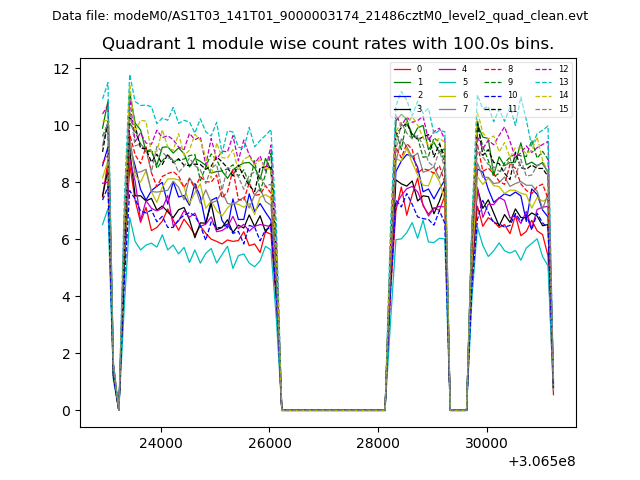
| Module-wise count rates for Quadrant A Data is divided into 100 sec bins |
 |
 |
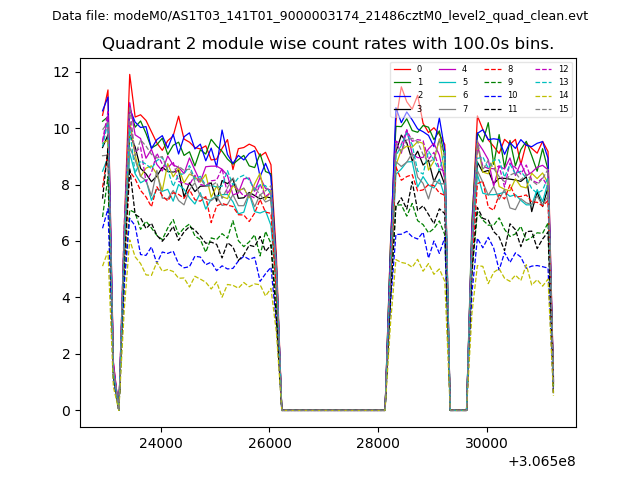
| Module-wise count rates for Quadrant B Data is divided into 100 sec bins |
 |
 |
| Module-wise count rates for Quadrant C Data is divided into 100 sec bins |
 |
 |
| Module-wise count rates for Quadrant D Data is divided into 100 sec bins |
 |
 |
| Parameter | Plot |
|---|---|
| CZT HV Monitor | 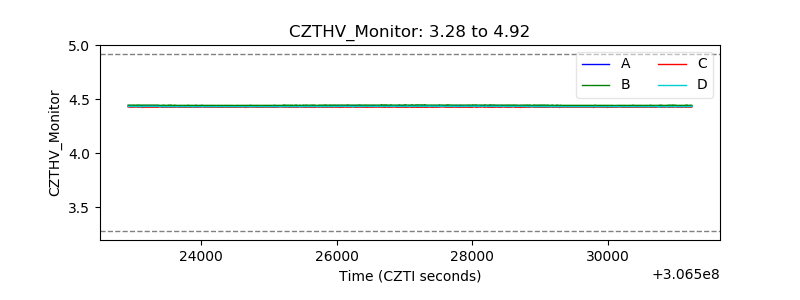 |
| D_VDD |  |
| Temperature 1 | 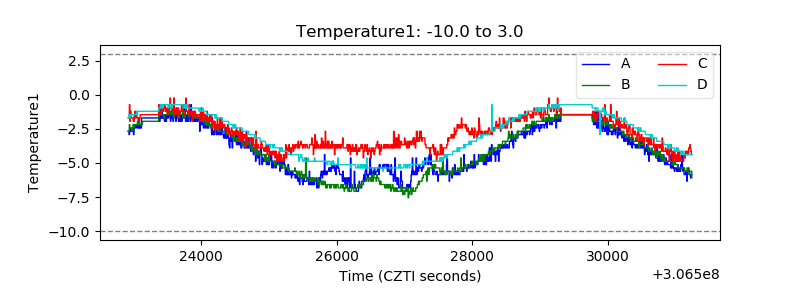 |
| Veto HV Monitor | 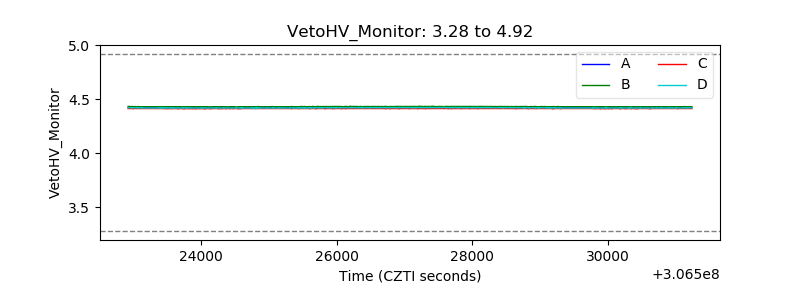 |
| Veto LLD |  |
| Alpha Counter | 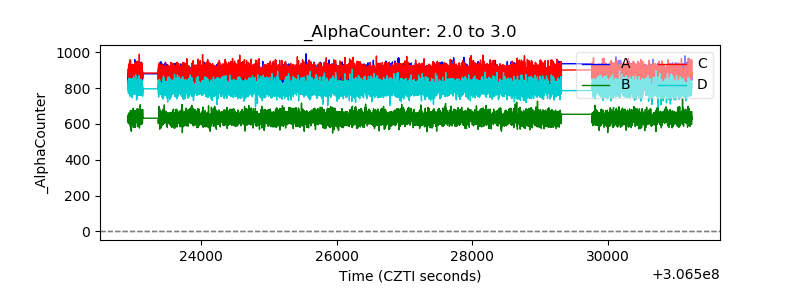 |
| _CPM_Rate | 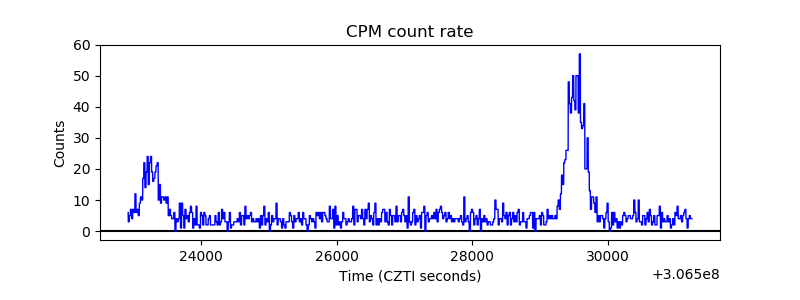 |
| CZT Counter | 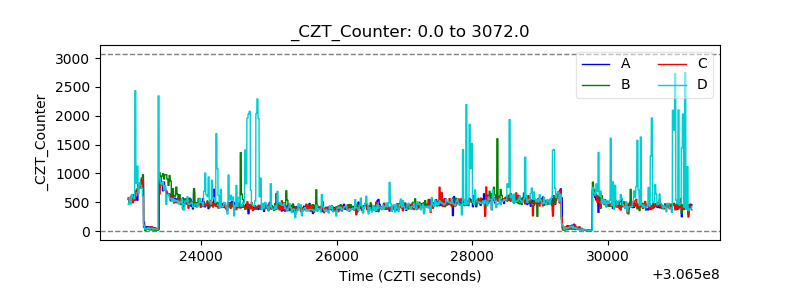 |
| +2.5 Volts monitor |  |
| +5 Volts monitor |  |
| _ROLL_ROT |  |
| _Roll_DEC | 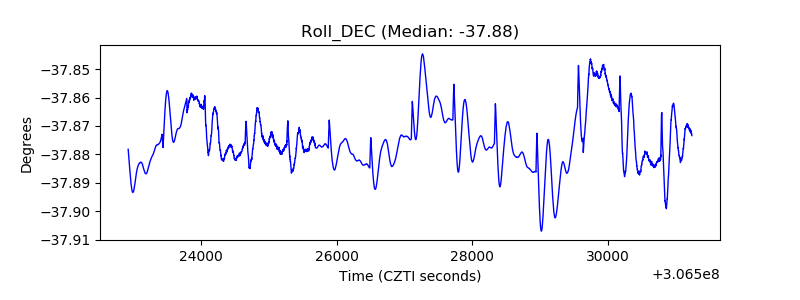 |
| _Roll_RA | 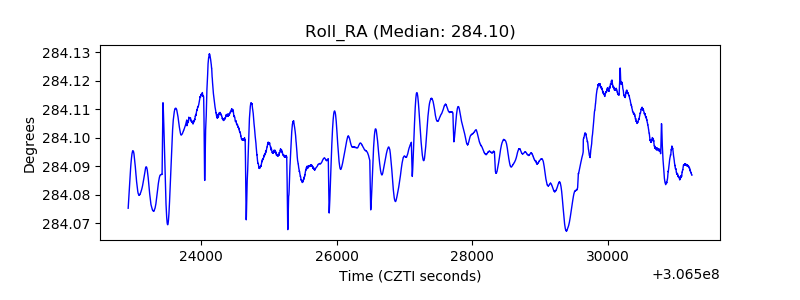 |
| Veto Counter | 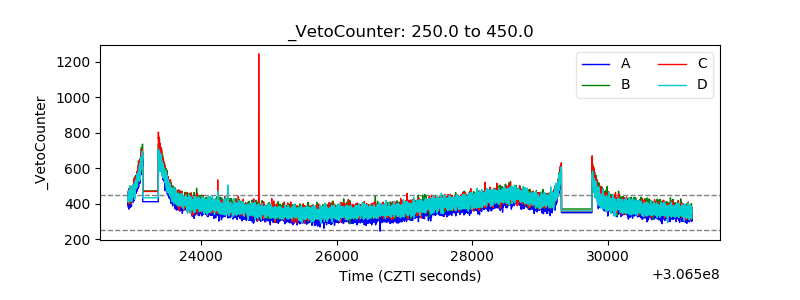 |