| Param | Original file | Final file |
|---|---|---|
| Filename | modeM0/AS1T03_141T01_9000003174_21489cztM0_level2.evt | modeM0/AS1T03_141T01_9000003174_21489cztM0_level2_quad_clean.evt |
| Size (bytes) | 491,068,800 | 99,002,880 |
| Size | 468.3 MB | 94.4 MB |
| Events in quadrant A | 3,450,941 | 623,661 |
| Events in quadrant B | 3,613,355 | 638,811 |
| Events in quadrant C | 3,508,917 | 616,543 |
| Events in quadrant D | 3,793,094 | 601,257 |
| Mode M9 | |||
|---|---|---|---|
| Quadrant | BADHDUFLAG | Total packets | Discarded packets |
| A | 0 | 18 | 0 |
| B | 0 | 18 | 0 |
| C | 0 | 18 | 0 |
| D | 0 | 18 | 0 |
| Mode M0 | |||
|---|---|---|---|
| Quadrant | BADHDUFLAG | Total packets | Discarded packets |
| A | 0 | 15091 | 0 |
| B | 0 | 15380 | 0 |
| C | 0 | 15085 | 0 |
| D | 0 | 16455 | 0 |
| Mode SS | |||
|---|---|---|---|
| Quadrant | BADHDUFLAG | Total packets | Discarded packets |
| A | 0 | 152 | 0 |
| B | 0 | 152 | 0 |
| C | 0 | 152 | 0 |
| D | 0 | 152 | 0 |
| Quadrant | Total seconds | Saturated seconds | Saturation percentage |
|---|---|---|---|
| A | 7445 | 25 | 0.335796% |
| B | 7445 | 42 | 0.564137% |
| C | 7446 | 43 | 0.577491% |
| D | 7446 | 93 | 1.248993% |
Noise dominated data is calculated using 1-second bins in cleaned event files. If a bin has >2000 counts, and if more than 50% of those come from <1% of pixels, then it is considered to be noise-dominated and hence unusable.
| Quadrant | # 1 sec bins | Bins with >0 counts | Bins with >2000 counts | High rate bins dominated by noise | Noise dominated (total time) | Noise dominated (detector-on time) | Marked lightcurve |
|---|---|---|---|---|---|---|---|
| A | 9185 | 7446 | 0 | 0 | 0.00% | 0.00% | 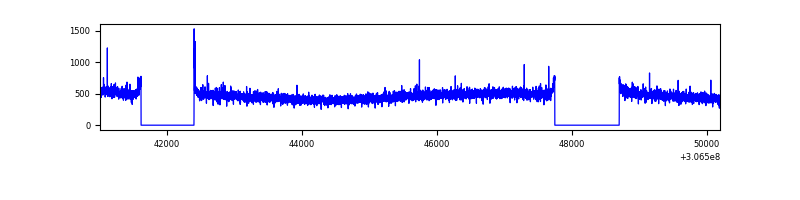 |
| B | 9185 | 7445 | 12 | 12 | 0.13% | 0.16% | 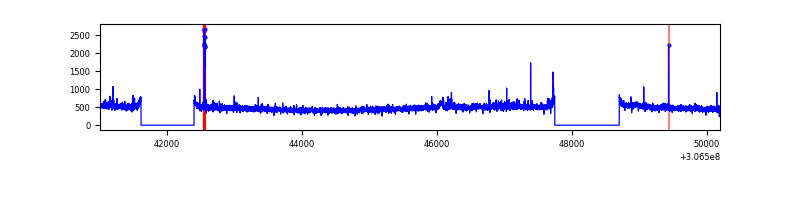 |
| C | 9186 | 7446 | 0 | 0 | 0.00% | 0.00% | 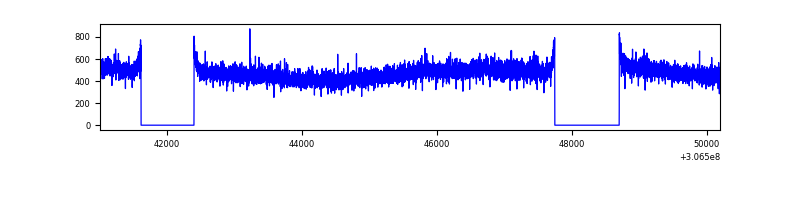 |
| D | 9186 | 7448 | 71 | 71 | 0.77% | 0.95% |  |
Top three noisy pixels from each quadrant. If the there are fewer than three noisy pixels in the level2.evt file, extra rows are filled as -1
| Pixel properties | Quadrant properties | ||||||
|---|---|---|---|---|---|---|---|
| Quadrant | DetID | PixID | Counts | Sigma | Mean | Median | Sigma |
| A | 13 | 254 | 11566 | 59.53 | 894 | 875 | 179.6 |
| A | 0 | 226 | 7677 | 37.88 | 894 | 875 | 179.6 |
| A | 3 | 137 | 7476 | 36.76 | 894 | 875 | 179.6 |
| B | 3 | 64 | 39364 | 222.68 | 897 | 874 | 172.8 |
| B | 0 | 230 | 33500 | 188.75 | 897 | 874 | 172.8 |
| B | 12 | 111 | 20656 | 114.45 | 897 | 874 | 172.8 |
| C | 14 | 238 | 136021 | 670.75 | 859 | 865 | 201.5 |
| C | 3 | 233 | 11736 | 53.95 | 859 | 865 | 201.5 |
| C | 0 | 239 | 11389 | 52.23 | 859 | 865 | 201.5 |
| D | 7 | 38 | 303994 | 1437.24 | 863 | 837 | 210.9 |
| D | 1 | 52 | 69068 | 323.48 | 863 | 837 | 210.9 |
| D | 13 | 153 | 62228 | 291.05 | 863 | 837 | 210.9 |
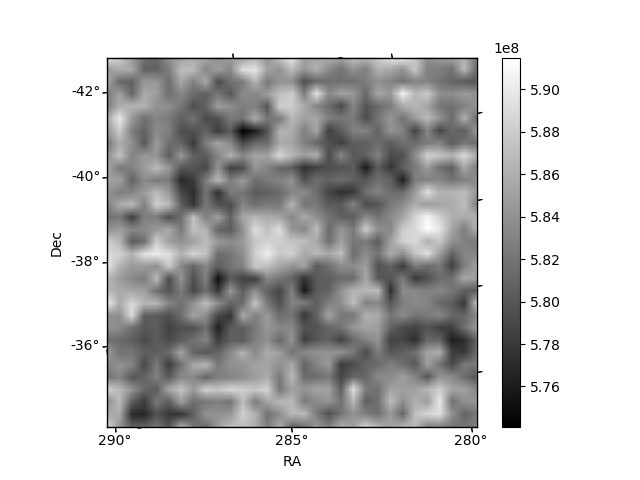
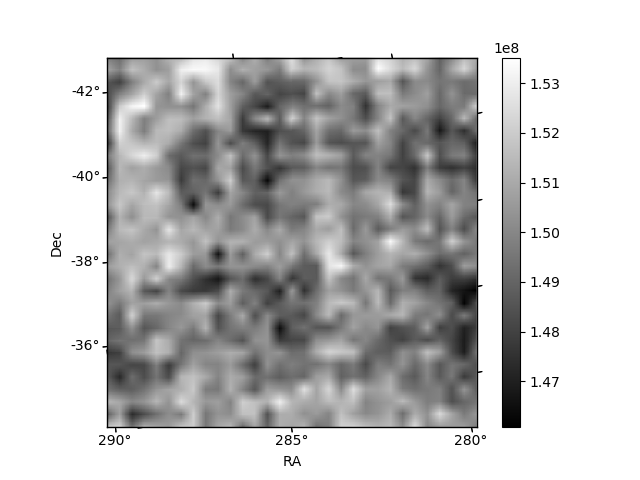
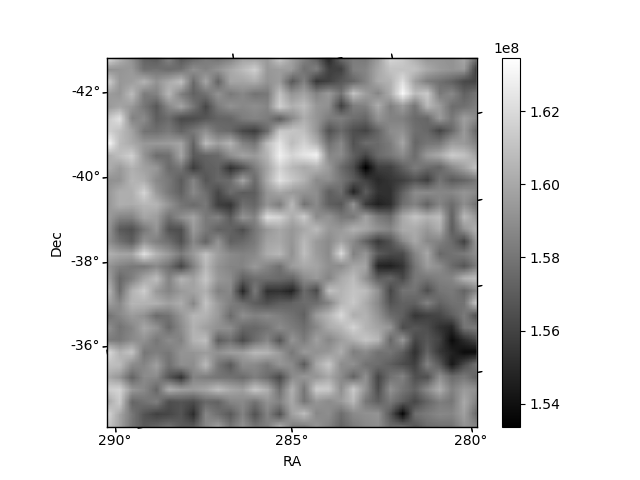
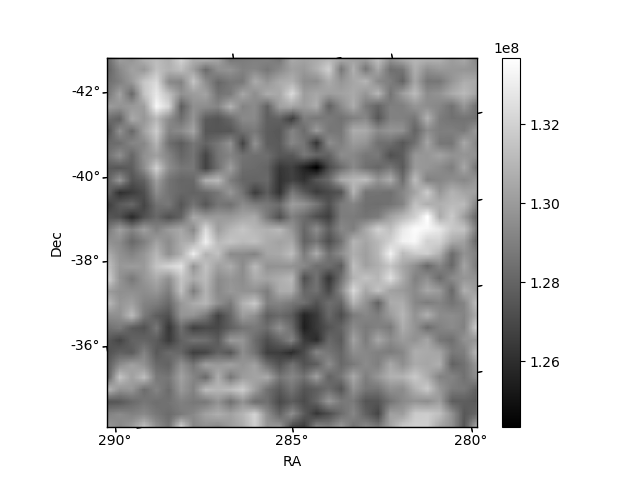
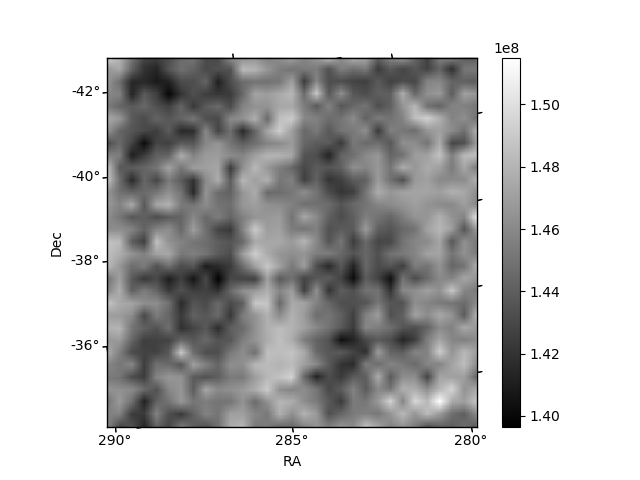
Histogram calculated using DETX and DETY for each event in the final _common_clean file
| Quadrant A | 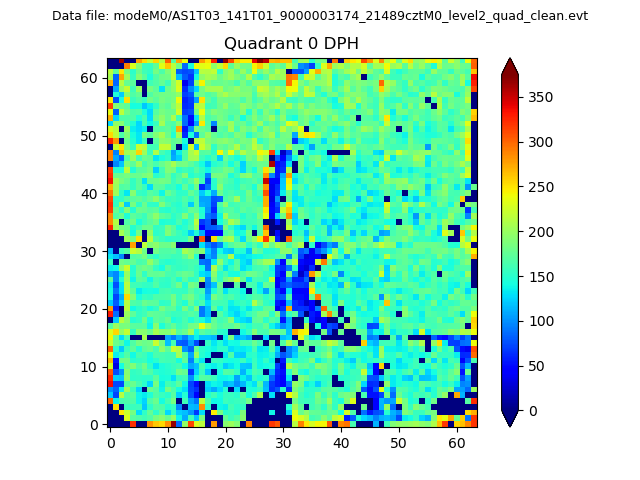 |
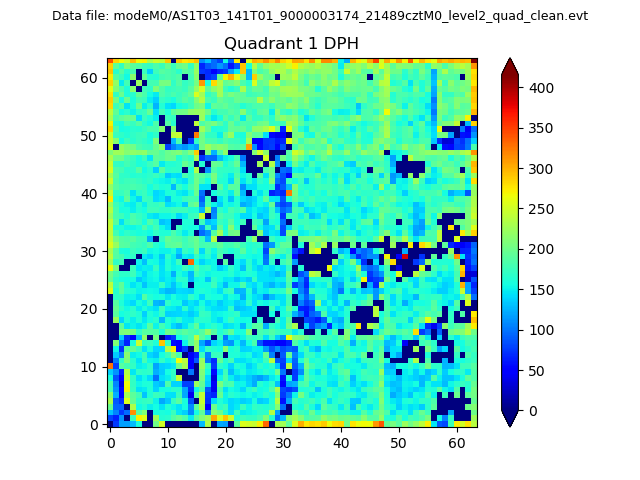 |
Quadrant B |
|---|---|---|---|
| Quadrant D | 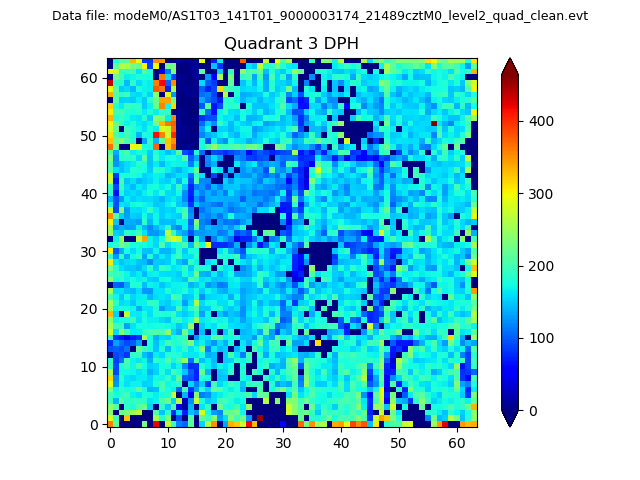 |
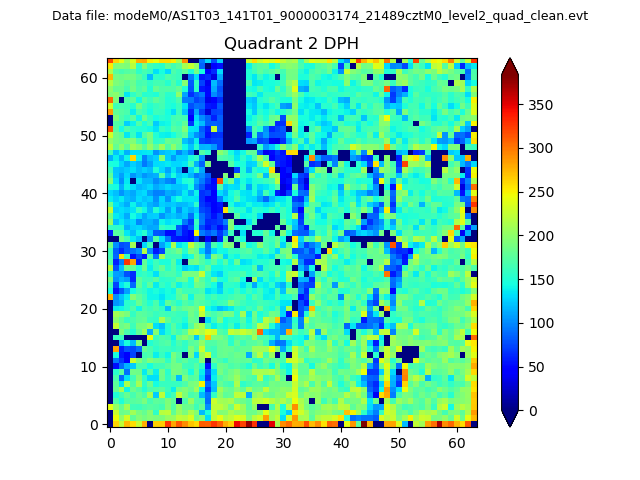 |
Quadrant C |
| Plot type | Count rate plots | Images |
|---|---|---|
| Comparison with Poisson distribution Blue bars denote a histogram of data divided into 1 sec bins. Red curve is a Poisson curve with rate = median count rate of data. |
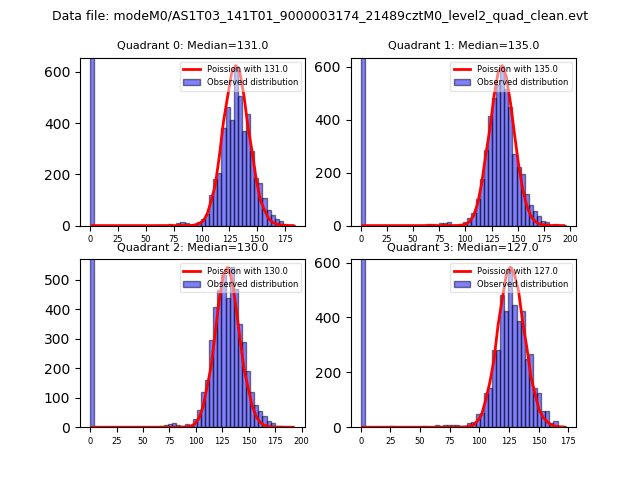 |
 |
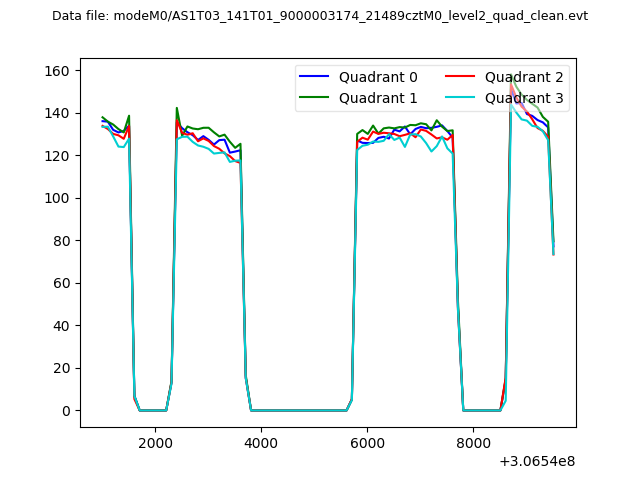
| Quadrant-wise count rates Data is divided into 100 sec bins |
 |
|
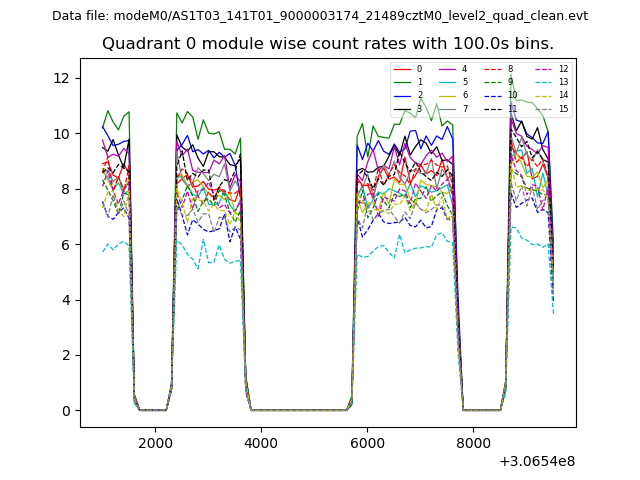
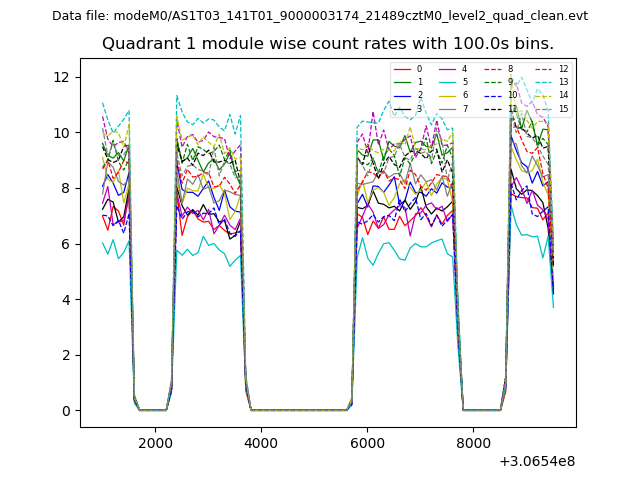
| Module-wise count rates for Quadrant A Data is divided into 100 sec bins |
 |
 |
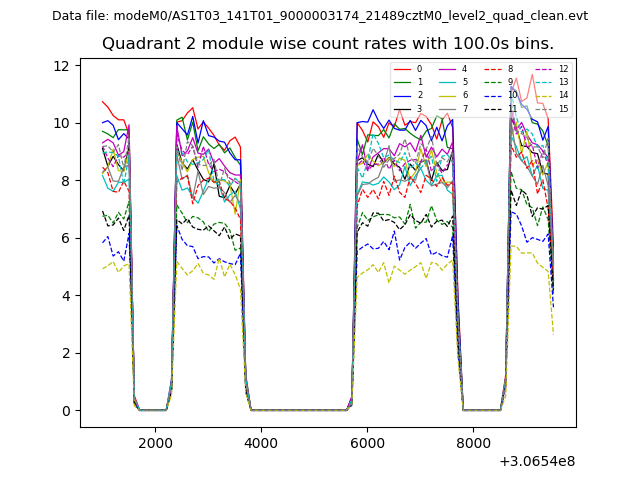
| Module-wise count rates for Quadrant B Data is divided into 100 sec bins |
 |
 |
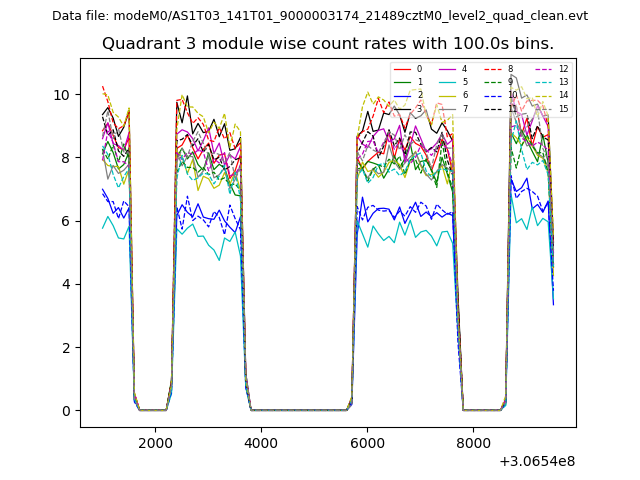
| Module-wise count rates for Quadrant C Data is divided into 100 sec bins |
 |
 |
| Module-wise count rates for Quadrant D Data is divided into 100 sec bins |
 |
 |
| Parameter | Plot |
|---|---|
| CZT HV Monitor | 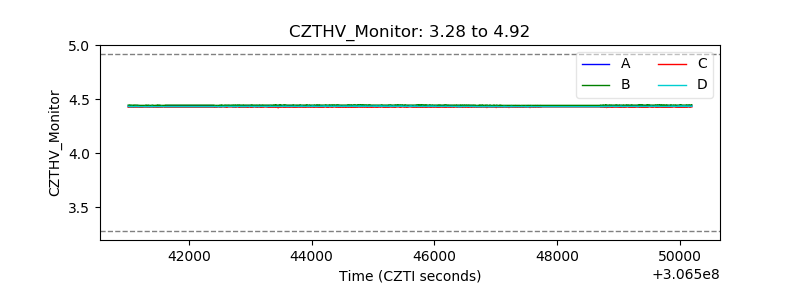 |
| D_VDD |  |
| Temperature 1 | 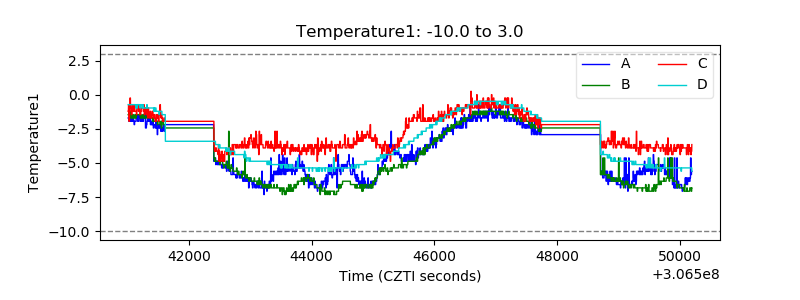 |
| Veto HV Monitor | 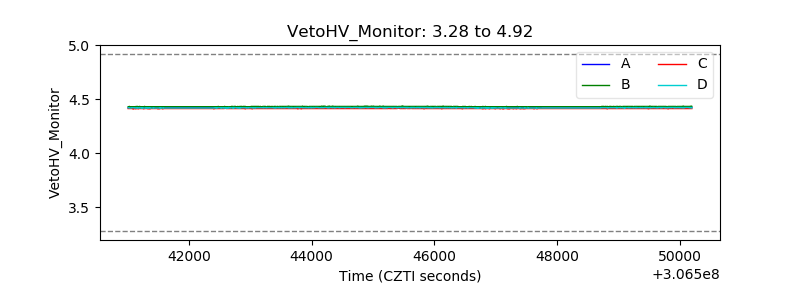 |
| Veto LLD | 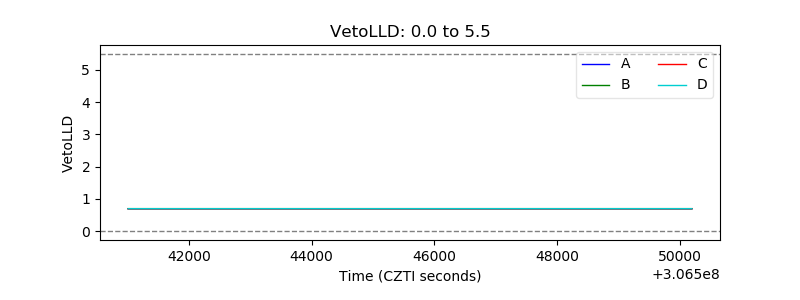 |
| Alpha Counter | 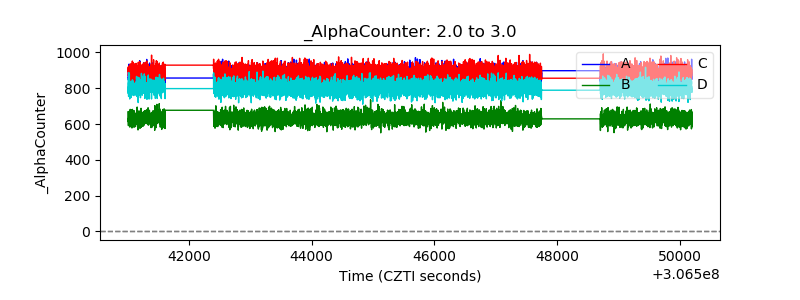 |
| _CPM_Rate | 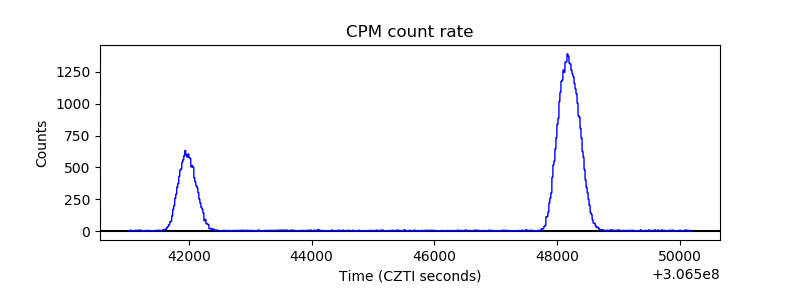 |
| CZT Counter | 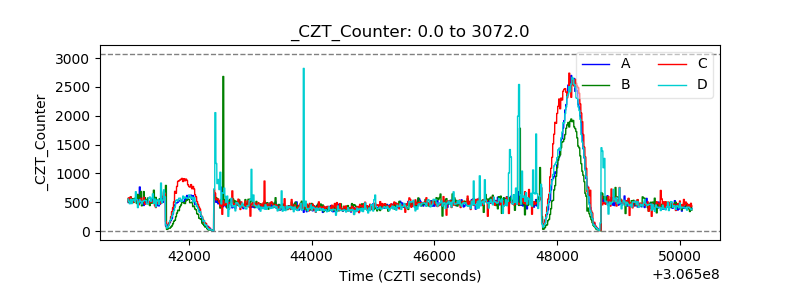 |
| +2.5 Volts monitor |  |
| +5 Volts monitor | 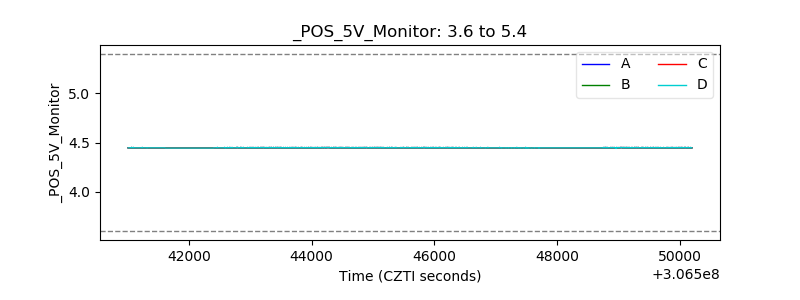 |
| _ROLL_ROT | 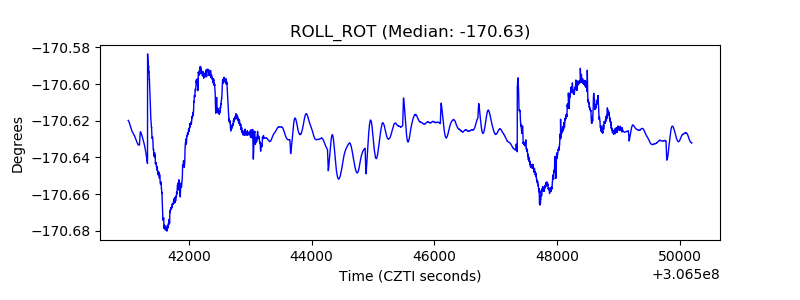 |
| _Roll_DEC | 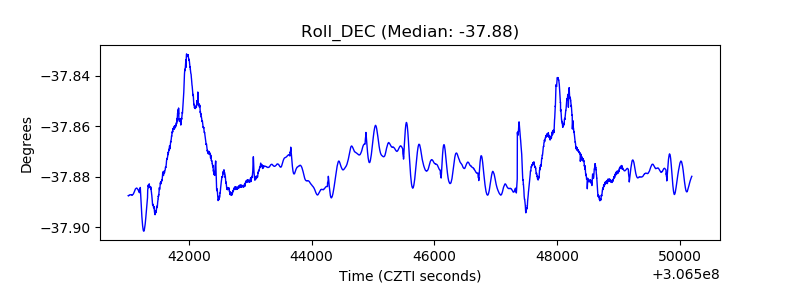 |
| _Roll_RA | 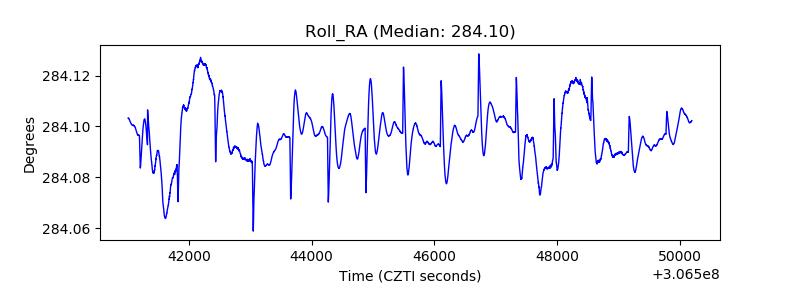 |
| Veto Counter | 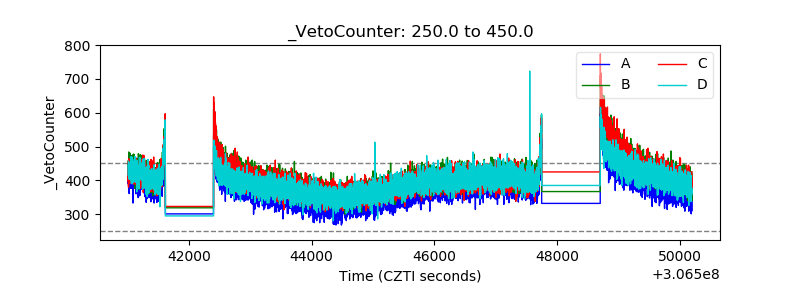 |