| Param | Original file | Final file |
|---|---|---|
| Filename | modeM0/AS1T03_141T01_9000003174_21490cztM0_level2.evt | modeM0/AS1T03_141T01_9000003174_21490cztM0_level2_quad_clean.evt |
| Size (bytes) | 430,128,000 | 78,842,880 |
| Size | 410.2 MB | 75.2 MB |
| Events in quadrant A | 3,050,742 | 484,502 |
| Events in quadrant B | 3,207,911 | 499,483 |
| Events in quadrant C | 3,157,123 | 481,994 |
| Events in quadrant D | 3,170,545 | 470,013 |
| Mode M9 | |||
|---|---|---|---|
| Quadrant | BADHDUFLAG | Total packets | Discarded packets |
| A | 0 | 10 | 0 |
| B | 0 | 10 | 0 |
| C | 0 | 10 | 0 |
| D | 0 | 10 | 0 |
| Mode M0 | |||
|---|---|---|---|
| Quadrant | BADHDUFLAG | Total packets | Discarded packets |
| A | 0 | 13180 | 0 |
| B | 0 | 13551 | 0 |
| C | 0 | 13400 | 0 |
| D | 0 | 13717 | 0 |
| Mode SS | |||
|---|---|---|---|
| Quadrant | BADHDUFLAG | Total packets | Discarded packets |
| A | 0 | 132 | 0 |
| B | 0 | 132 | 0 |
| C | 0 | 132 | 0 |
| D | 0 | 132 | 0 |
| Quadrant | Total seconds | Saturated seconds | Saturation percentage |
|---|---|---|---|
| A | 6470 | 19 | 0.293663% |
| B | 6471 | 35 | 0.540875% |
| C | 6470 | 47 | 0.726430% |
| D | 6470 | 28 | 0.432767% |
Noise dominated data is calculated using 1-second bins in cleaned event files. If a bin has >2000 counts, and if more than 50% of those come from <1% of pixels, then it is considered to be noise-dominated and hence unusable.
| Quadrant | # 1 sec bins | Bins with >0 counts | Bins with >2000 counts | High rate bins dominated by noise | Noise dominated (total time) | Noise dominated (detector-on time) | Marked lightcurve |
|---|---|---|---|---|---|---|---|
| A | 7545 | 6470 | 0 | 0 | 0.00% | 0.00% | 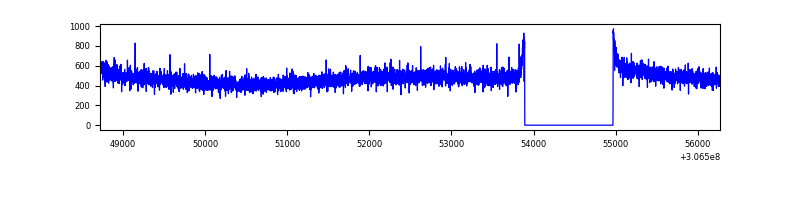 |
| B | 7546 | 6471 | 3 | 3 | 0.04% | 0.05% | 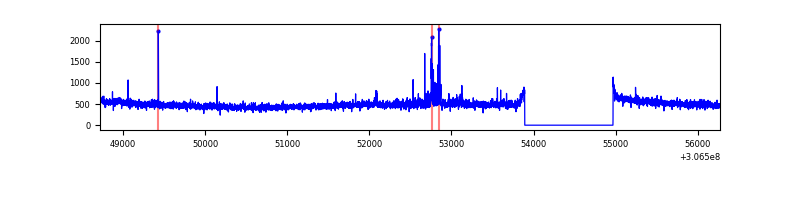 |
| C | 7545 | 6470 | 0 | 0 | 0.00% | 0.00% | 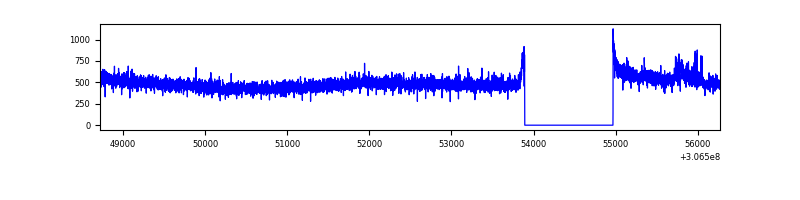 |
| D | 7545 | 6470 | 6 | 6 | 0.08% | 0.09% | 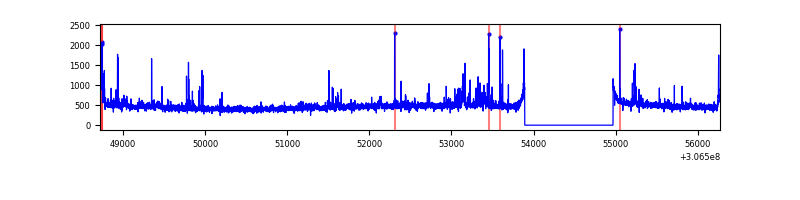 |
Top three noisy pixels from each quadrant. If the there are fewer than three noisy pixels in the level2.evt file, extra rows are filled as -1
| Pixel properties | Quadrant properties | ||||||
|---|---|---|---|---|---|---|---|
| Quadrant | DetID | PixID | Counts | Sigma | Mean | Median | Sigma |
| A | 13 | 254 | 10155 | 58.97 | 791 | 777 | 159.0 |
| A | 0 | 226 | 6721 | 37.37 | 791 | 777 | 159.0 |
| A | 3 | 137 | 6516 | 36.08 | 791 | 777 | 159.0 |
| B | 0 | 244 | 26419 | 169.16 | 799 | 779 | 151.6 |
| B | 0 | 190 | 23735 | 151.45 | 799 | 779 | 151.6 |
| B | 0 | 230 | 22277 | 141.83 | 799 | 779 | 151.6 |
| C | 14 | 238 | 122245 | 677.44 | 768 | 773 | 179.3 |
| C | 3 | 233 | 32954 | 179.47 | 768 | 773 | 179.3 |
| C | 0 | 239 | 6746 | 33.31 | 768 | 773 | 179.3 |
| D | 7 | 38 | 58838 | 295.42 | 767 | 748 | 196.6 |
| D | 13 | 153 | 45000 | 225.04 | 767 | 748 | 196.6 |
| D | 12 | 235 | 34553 | 171.92 | 767 | 748 | 196.6 |
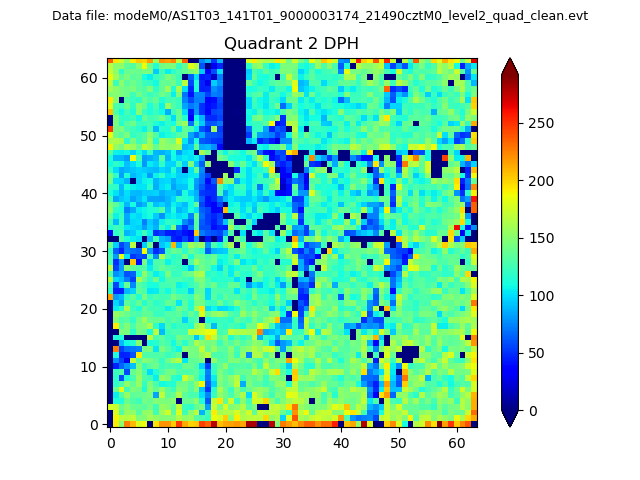
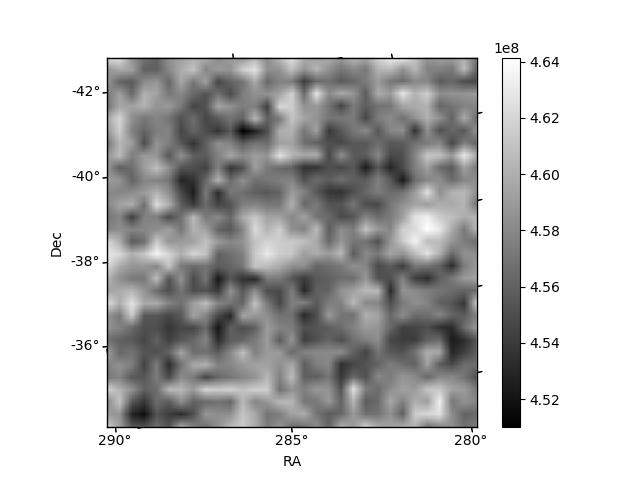
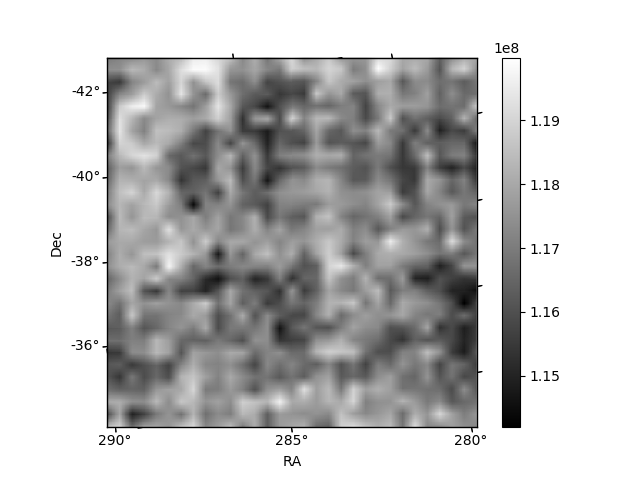
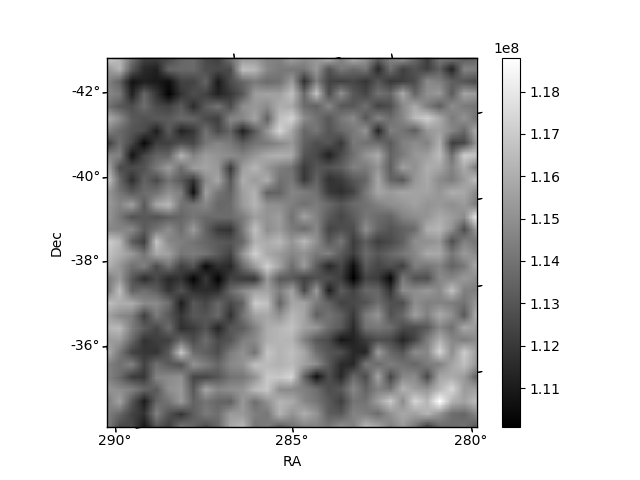
Histogram calculated using DETX and DETY for each event in the final _common_clean file
| Quadrant A | 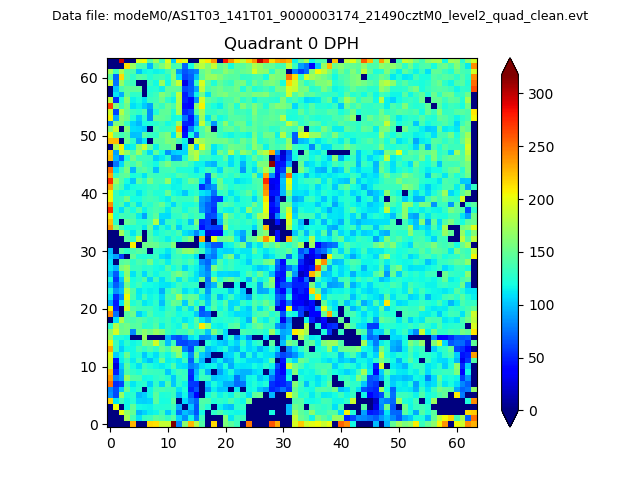 |
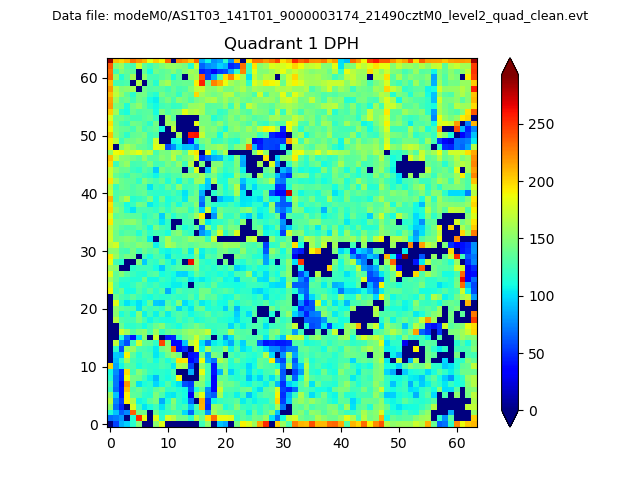 |
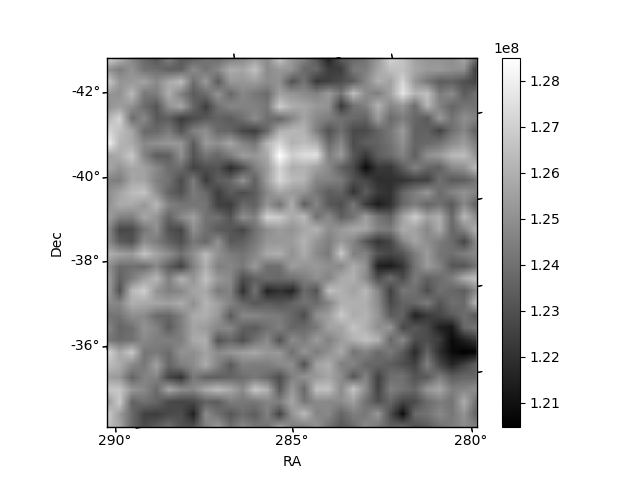
Quadrant B |
|---|---|---|---|
| Quadrant D | 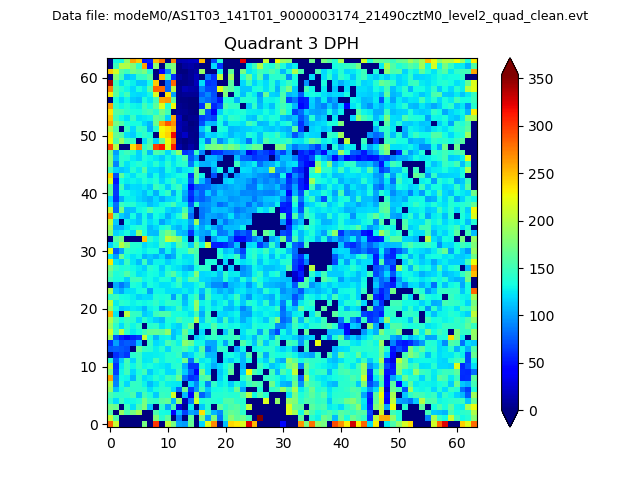 |
 |
Quadrant C |
| Plot type | Count rate plots | Images |
|---|---|---|
| Comparison with Poisson distribution Blue bars denote a histogram of data divided into 1 sec bins. Red curve is a Poisson curve with rate = median count rate of data. |
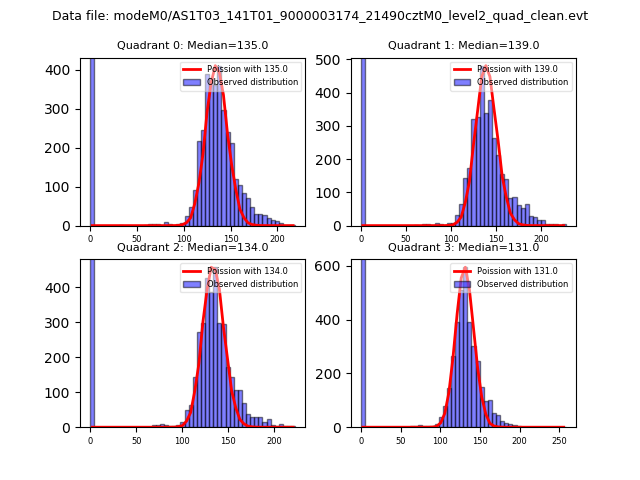 |
 |
| Quadrant-wise count rates Data is divided into 100 sec bins |
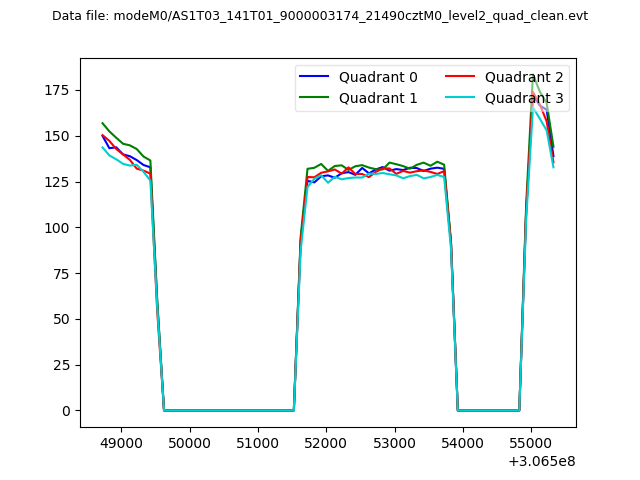 |
|
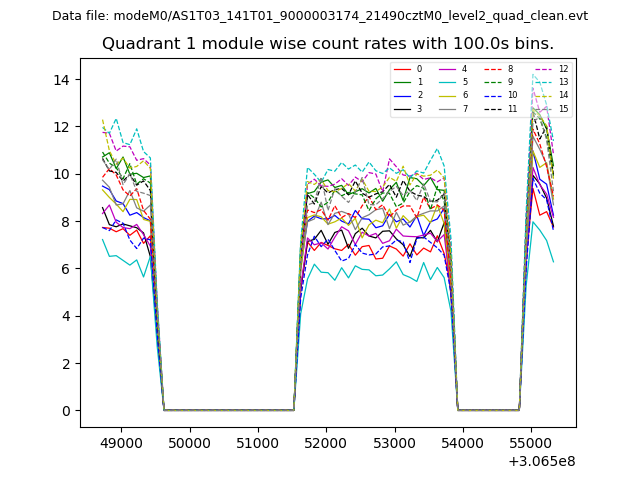
| Module-wise count rates for Quadrant A Data is divided into 100 sec bins |
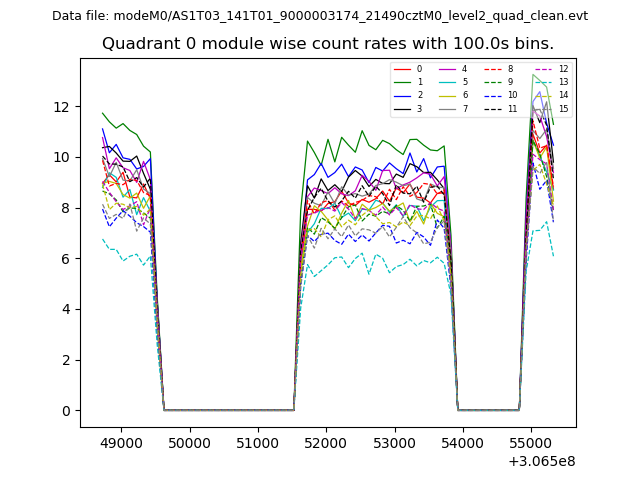 |
 |
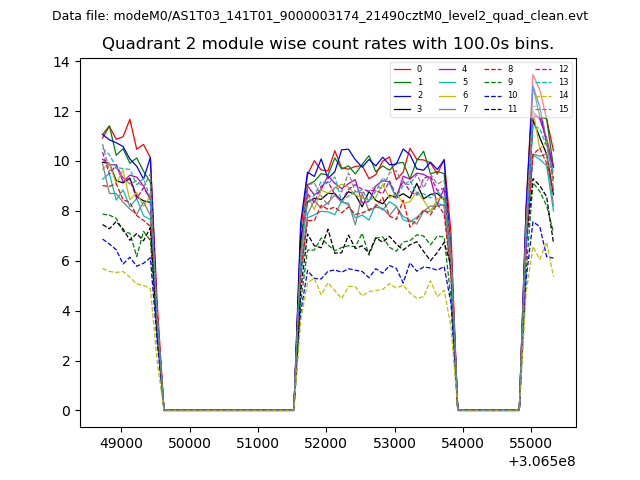
| Module-wise count rates for Quadrant B Data is divided into 100 sec bins |
 |
 |
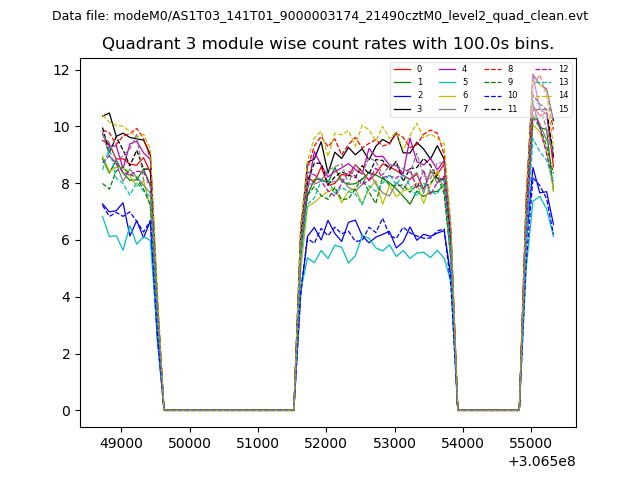
| Module-wise count rates for Quadrant C Data is divided into 100 sec bins |
 |
 |
| Module-wise count rates for Quadrant D Data is divided into 100 sec bins |
 |
 |
| Parameter | Plot |
|---|---|
| CZT HV Monitor | 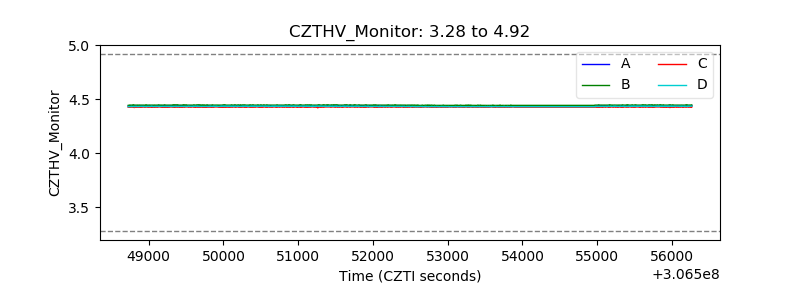 |
| D_VDD | 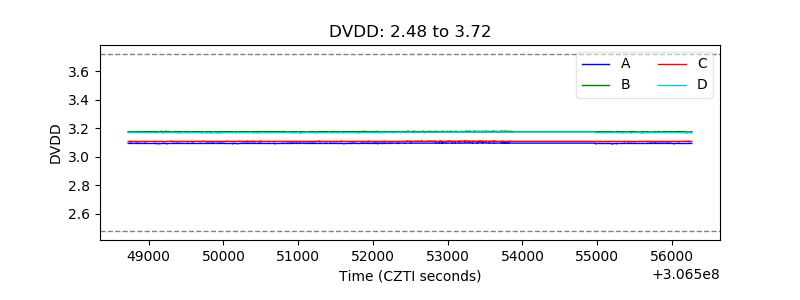 |
| Temperature 1 |  |
| Veto HV Monitor | 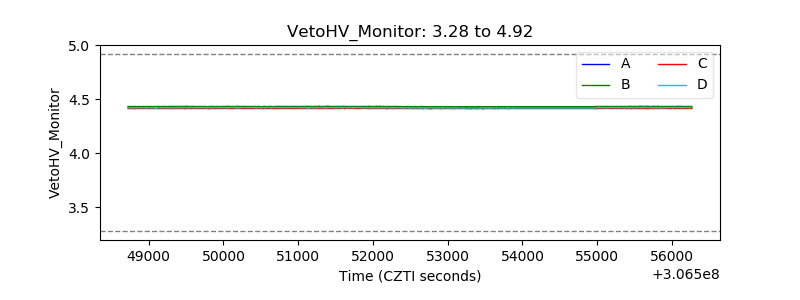 |
| Veto LLD | 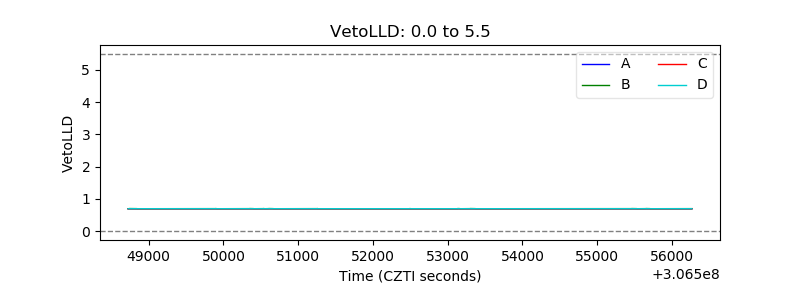 |
| Alpha Counter | 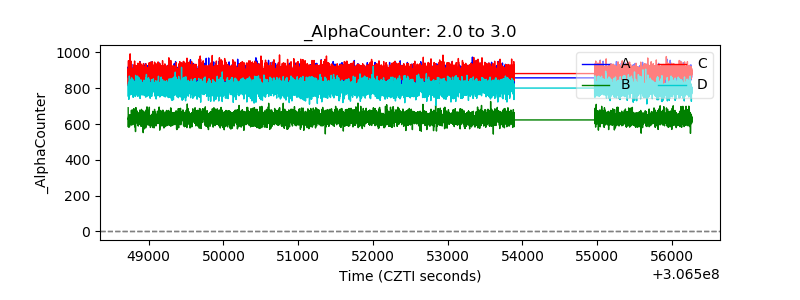 |
| _CPM_Rate | 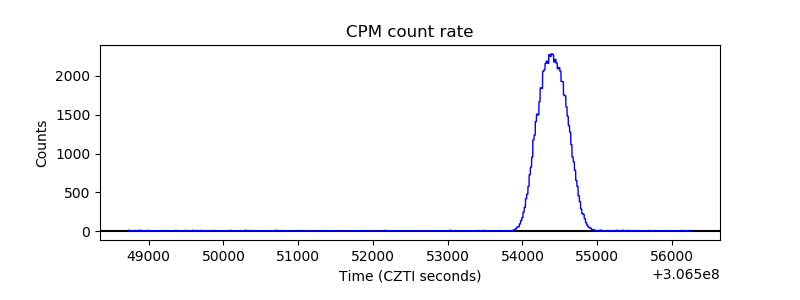 |
| CZT Counter | 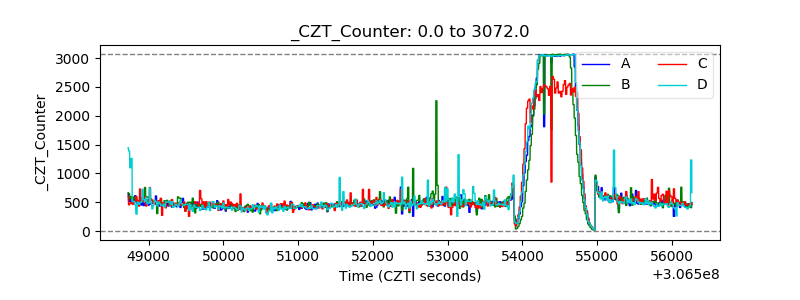 |
| +2.5 Volts monitor |  |
| +5 Volts monitor |  |
| _ROLL_ROT | 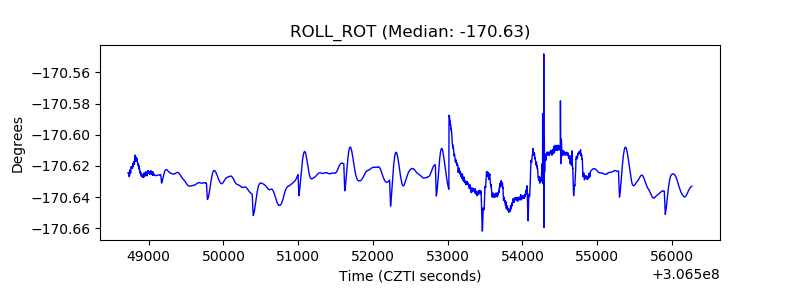 |
| _Roll_DEC |  |
| _Roll_RA | 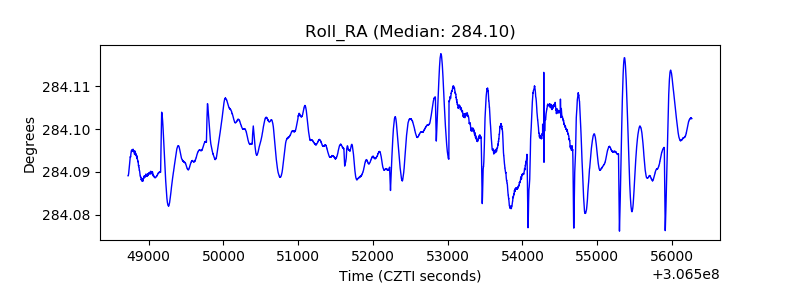 |
| Veto Counter | 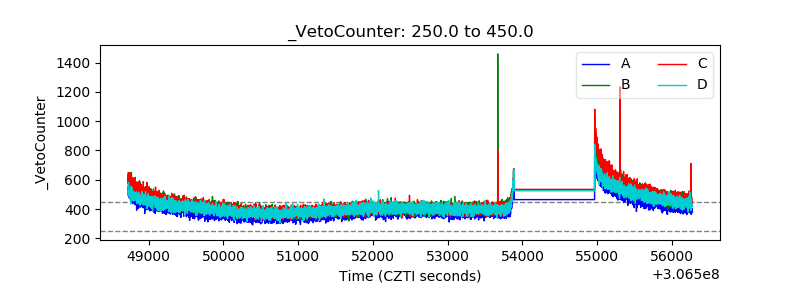 |