| Param | Original file | Final file |
|---|---|---|
| Filename | modeM0/AS1T03_141T01_9000003174_21493cztM0_level2.evt | modeM0/AS1T03_141T01_9000003174_21493cztM0_level2_quad_clean.evt |
| Size (bytes) | 474,886,080 | 68,086,080 |
| Size | 452.9 MB | 64.9 MB |
| Events in quadrant A | 3,346,637 | 406,614 |
| Events in quadrant B | 3,564,746 | 416,324 |
| Events in quadrant C | 3,440,107 | 405,377 |
| Events in quadrant D | 3,601,376 | 391,922 |
| Mode M9 | |||
|---|---|---|---|
| Quadrant | BADHDUFLAG | Total packets | Discarded packets |
| A | 0 | 15 | 0 |
| B | 0 | 16 | 0 |
| C | 0 | 16 | 0 |
| D | 0 | 16 | 0 |
| Mode M0 | |||
|---|---|---|---|
| Quadrant | BADHDUFLAG | Total packets | Discarded packets |
| A | 0 | 13776 | 0 |
| B | 0 | 14423 | 0 |
| C | 0 | 14118 | 0 |
| D | 0 | 14570 | 0 |
| Mode SS | |||
|---|---|---|---|
| Quadrant | BADHDUFLAG | Total packets | Discarded packets |
| A | 0 | 130 | 0 |
| B | 0 | 130 | 0 |
| C | 0 | 130 | 0 |
| D | 0 | 130 | 0 |
| Quadrant | Total seconds | Saturated seconds | Saturation percentage |
|---|---|---|---|
| A | 6318 | 46 | 0.728079% |
| B | 6318 | 88 | 1.392846% |
| C | 6318 | 113 | 1.788541% |
| D | 6318 | 102 | 1.614435% |
Noise dominated data is calculated using 1-second bins in cleaned event files. If a bin has >2000 counts, and if more than 50% of those come from <1% of pixels, then it is considered to be noise-dominated and hence unusable.
| Quadrant | # 1 sec bins | Bins with >0 counts | Bins with >2000 counts | High rate bins dominated by noise | Noise dominated (total time) | Noise dominated (detector-on time) | Marked lightcurve |
|---|---|---|---|---|---|---|---|
| A | 7593 | 6318 | 0 | 0 | 0.00% | 0.00% |  |
| B | 7593 | 6318 | 18 | 18 | 0.24% | 0.28% | 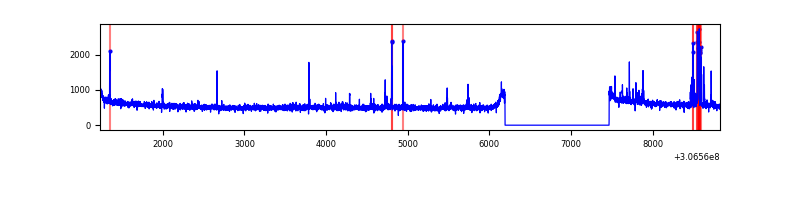 |
| C | 7593 | 6318 | 0 | 0 | 0.00% | 0.00% | 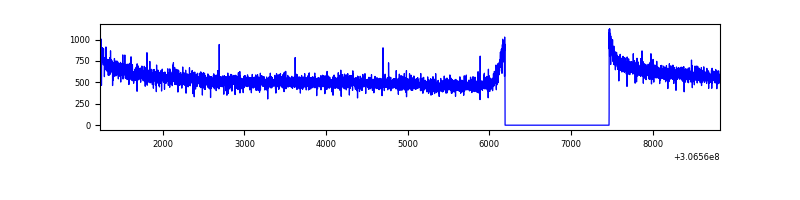 |
| D | 7593 | 6318 | 60 | 60 | 0.79% | 0.95% |  |
Top three noisy pixels from each quadrant. If the there are fewer than three noisy pixels in the level2.evt file, extra rows are filled as -1
| Pixel properties | Quadrant properties | ||||||
|---|---|---|---|---|---|---|---|
| Quadrant | DetID | PixID | Counts | Sigma | Mean | Median | Sigma |
| A | 13 | 254 | 8587 | 45.13 | 869 | 857 | 171.3 |
| A | 0 | 226 | 7439 | 38.43 | 869 | 857 | 171.3 |
| A | 3 | 137 | 6406 | 32.4 | 869 | 857 | 171.3 |
| B | 3 | 64 | 127354 | 797.09 | 869 | 849 | 158.7 |
| B | 12 | 111 | 18317 | 110.06 | 869 | 849 | 158.7 |
| B | 0 | 230 | 17372 | 104.11 | 869 | 849 | 158.7 |
| C | 14 | 238 | 136965 | 705.14 | 846 | 854 | 193.0 |
| C | 13 | 61 | 6086 | 27.11 | 846 | 854 | 193.0 |
| C | 4 | 175 | 4020 | 16.4 | 846 | 854 | 193.0 |
| D | 7 | 38 | 180001 | 882.37 | 851 | 827 | 203.1 |
| D | 1 | 20 | 105968 | 517.78 | 851 | 827 | 203.1 |
| D | 12 | 235 | 36643 | 176.38 | 851 | 827 | 203.1 |
Histogram calculated using DETX and DETY for each event in the final _common_clean file
| Quadrant A | 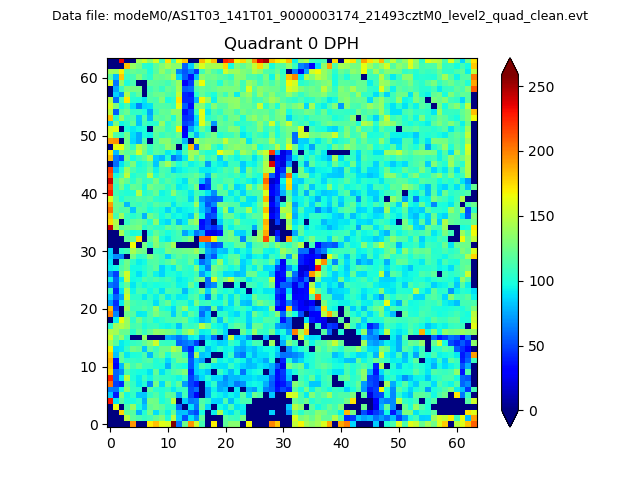 |
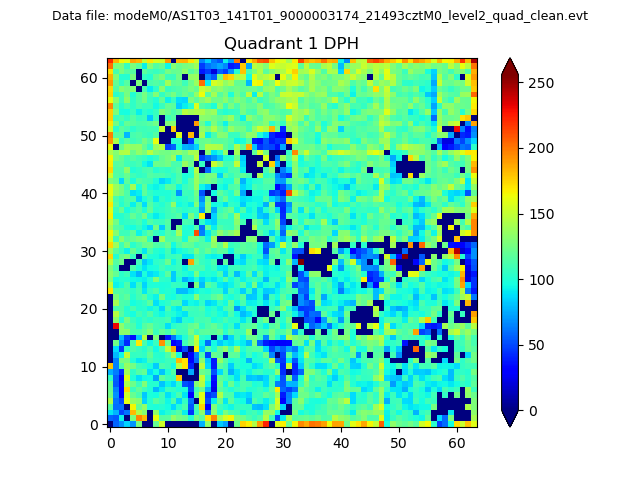 |
Quadrant B |
|---|---|---|---|
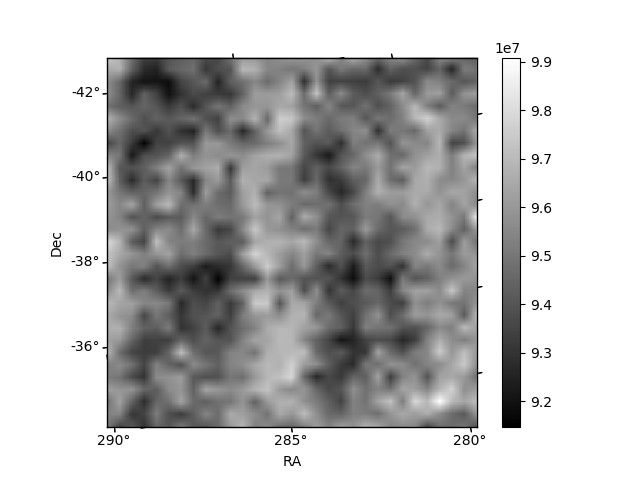
| Quadrant D | 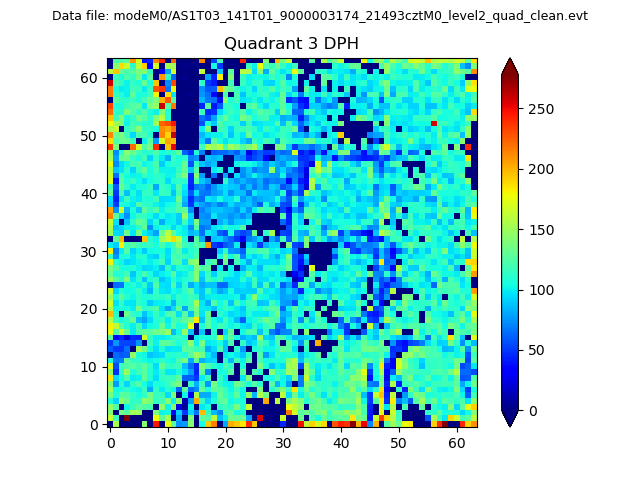 |
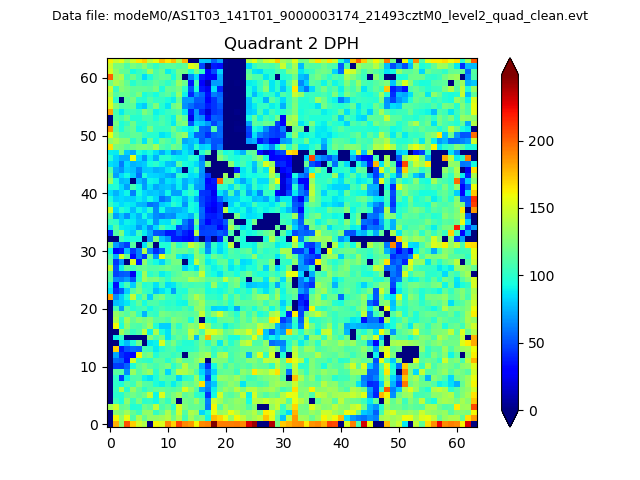 |
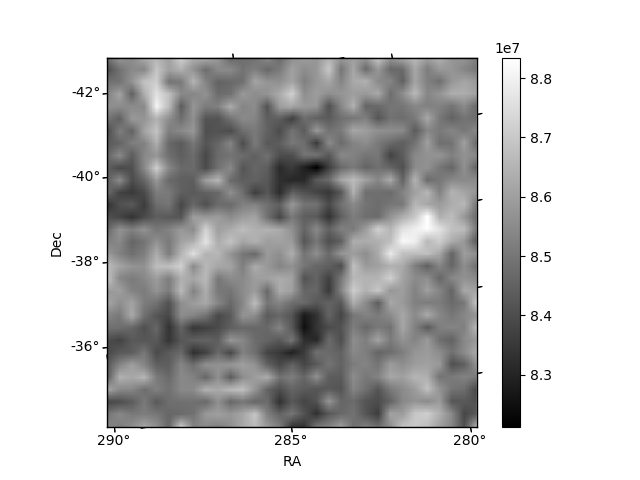
Quadrant C |
| Plot type | Count rate plots | Images |
|---|---|---|
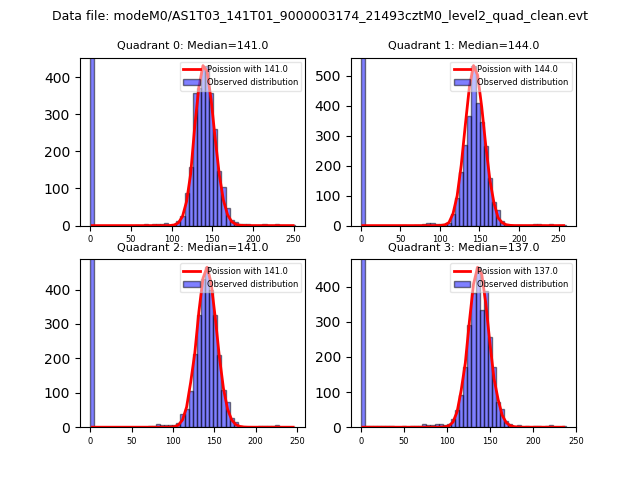
| Comparison with Poisson distribution Blue bars denote a histogram of data divided into 1 sec bins. Red curve is a Poisson curve with rate = median count rate of data. |
 |
 |
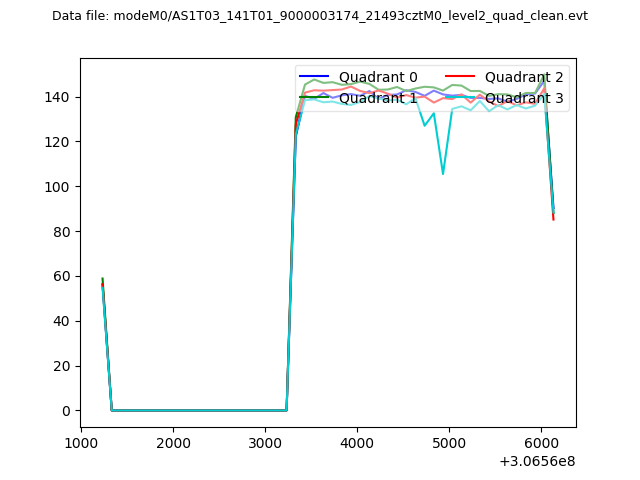
| Quadrant-wise count rates Data is divided into 100 sec bins |
 |
|
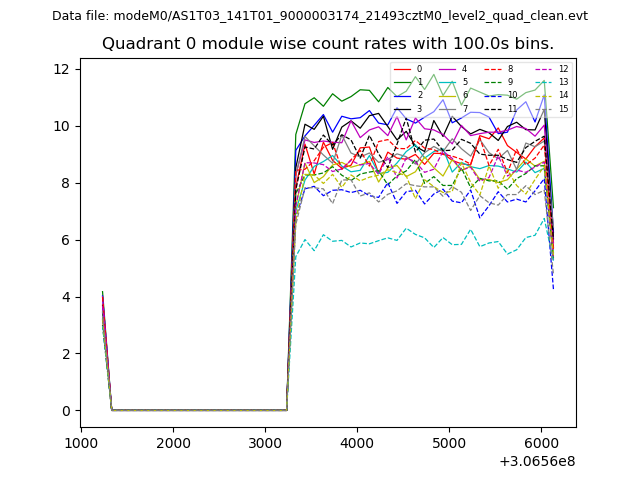
| Module-wise count rates for Quadrant A Data is divided into 100 sec bins |
 |
 |
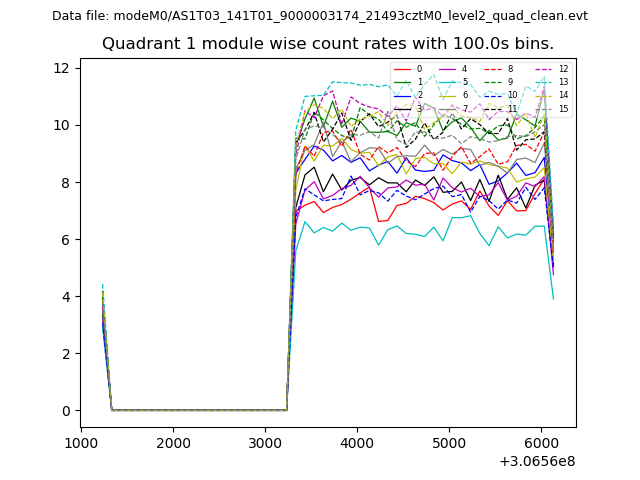
| Module-wise count rates for Quadrant B Data is divided into 100 sec bins |
 |
 |
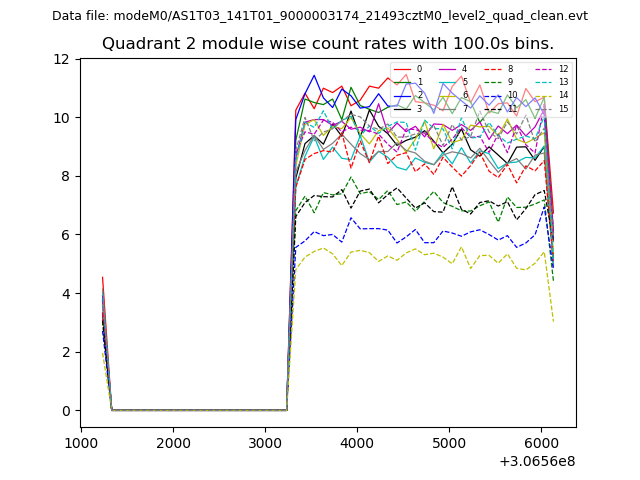
| Module-wise count rates for Quadrant C Data is divided into 100 sec bins |
 |
 |
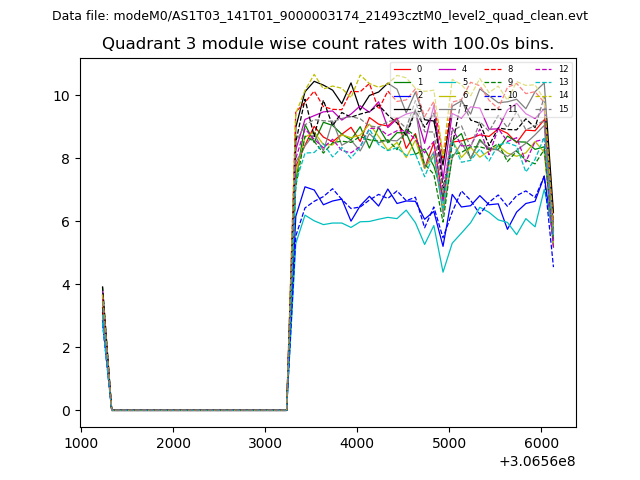
| Module-wise count rates for Quadrant D Data is divided into 100 sec bins |
 |
 |
| Parameter | Plot |
|---|---|
| CZT HV Monitor | 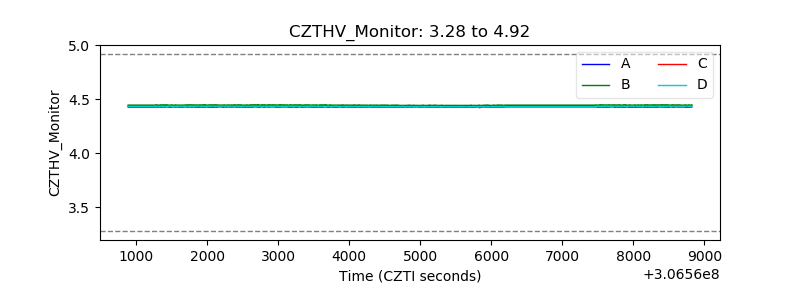 |
| D_VDD | 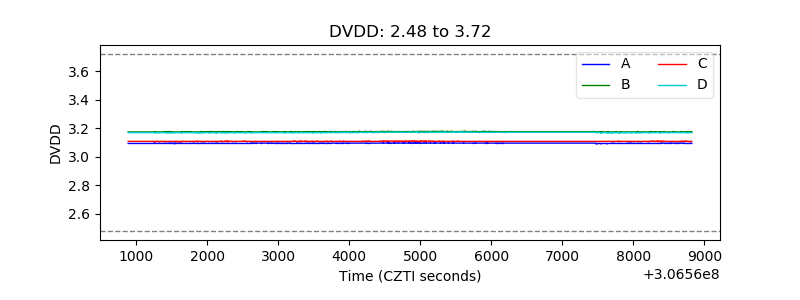 |
| Temperature 1 | 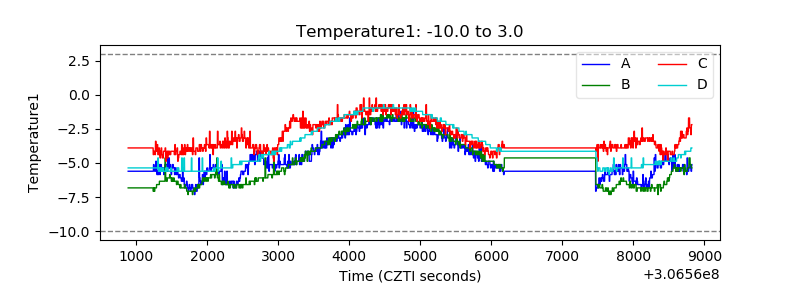 |
| Veto HV Monitor | 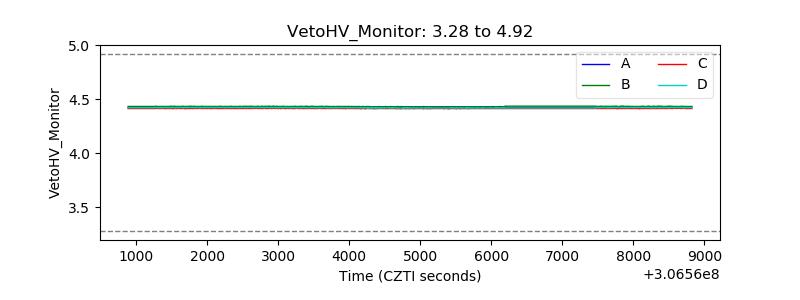 |
| Veto LLD | 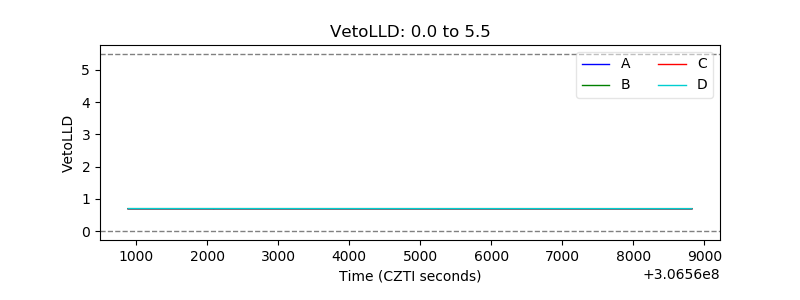 |
| Alpha Counter | 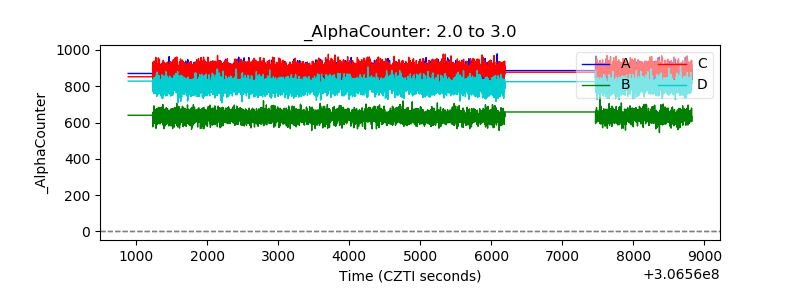 |
| _CPM_Rate | 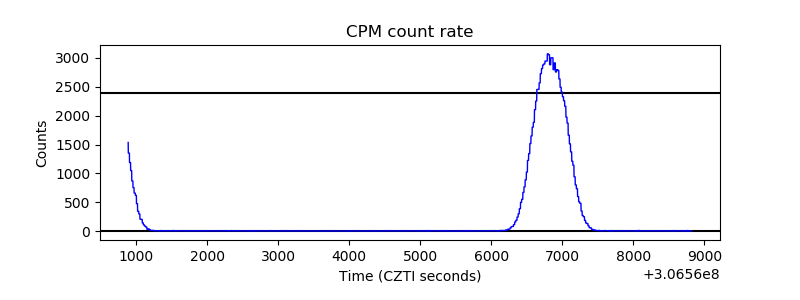 |
| CZT Counter | 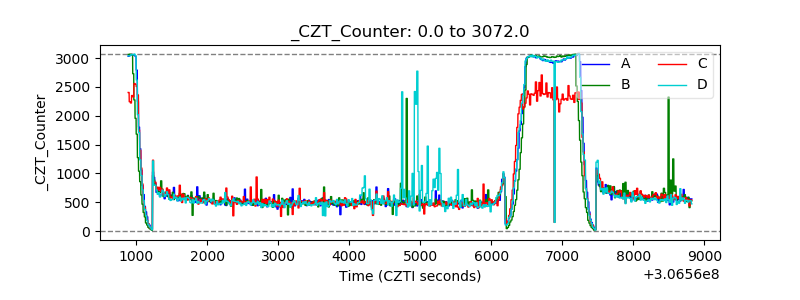 |
| +2.5 Volts monitor |  |
| +5 Volts monitor |  |
| _ROLL_ROT | 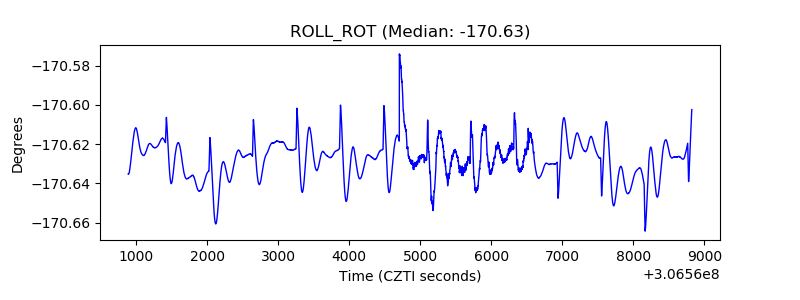 |
| _Roll_DEC | 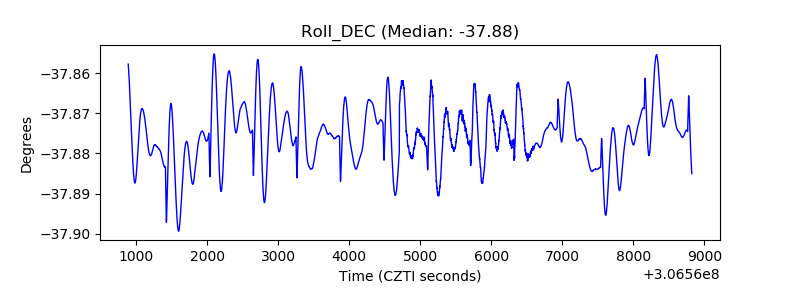 |
| _Roll_RA | 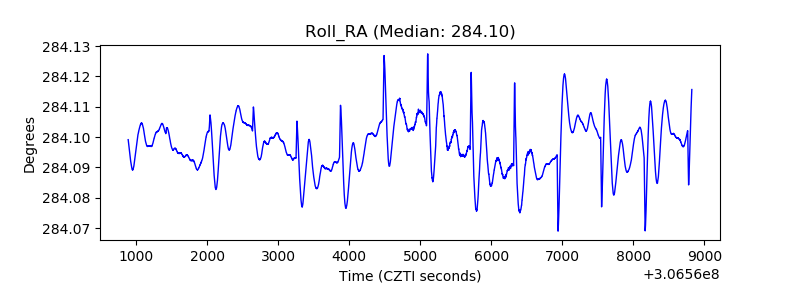 |
| Veto Counter | 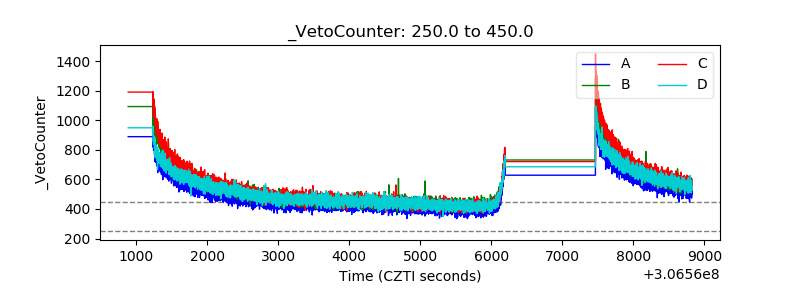 |