| Param | Original file | Final file |
|---|---|---|
| Filename | modeM0/AS1T03_141T01_9000003174_21494cztM0_level2.evt | modeM0/AS1T03_141T01_9000003174_21494cztM0_level2_quad_clean.evt |
| Size (bytes) | 490,265,280 | 76,936,320 |
| Size | 467.6 MB | 73.4 MB |
| Events in quadrant A | 3,473,499 | 473,732 |
| Events in quadrant B | 3,676,611 | 485,032 |
| Events in quadrant C | 3,545,223 | 472,740 |
| Events in quadrant D | 3,726,831 | 460,691 |
| Mode M9 | |||
|---|---|---|---|
| Quadrant | BADHDUFLAG | Total packets | Discarded packets |
| A | 0 | 19 | 0 |
| B | 0 | 20 | 0 |
| C | 0 | 20 | 0 |
| D | 0 | 20 | 0 |
| Mode M0 | |||
|---|---|---|---|
| Quadrant | BADHDUFLAG | Total packets | Discarded packets |
| A | 0 | 14175 | 0 |
| B | 0 | 14800 | 0 |
| C | 0 | 14531 | 0 |
| D | 0 | 14862 | 0 |
| Mode SS | |||
|---|---|---|---|
| Quadrant | BADHDUFLAG | Total packets | Discarded packets |
| A | 0 | 128 | 0 |
| B | 0 | 128 | 0 |
| C | 0 | 128 | 0 |
| D | 0 | 128 | 0 |
| Quadrant | Total seconds | Saturated seconds | Saturation percentage |
|---|---|---|---|
| A | 6266 | 124 | 1.978934% |
| B | 6266 | 164 | 2.617300% |
| C | 6266 | 187 | 2.984360% |
| D | 6266 | 161 | 2.569422% |
Noise dominated data is calculated using 1-second bins in cleaned event files. If a bin has >2000 counts, and if more than 50% of those come from <1% of pixels, then it is considered to be noise-dominated and hence unusable.
| Quadrant | # 1 sec bins | Bins with >0 counts | Bins with >2000 counts | High rate bins dominated by noise | Noise dominated (total time) | Noise dominated (detector-on time) | Marked lightcurve |
|---|---|---|---|---|---|---|---|
| A | 7556 | 6266 | 0 | 0 | 0.00% | 0.00% | 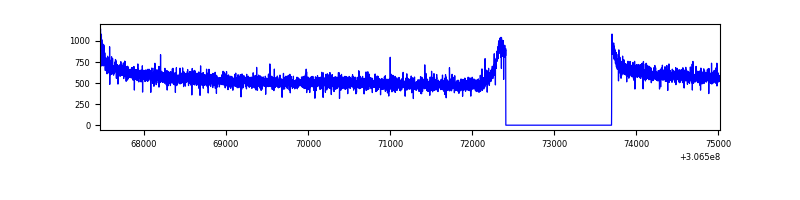 |
| B | 7556 | 6266 | 15 | 15 | 0.20% | 0.24% | 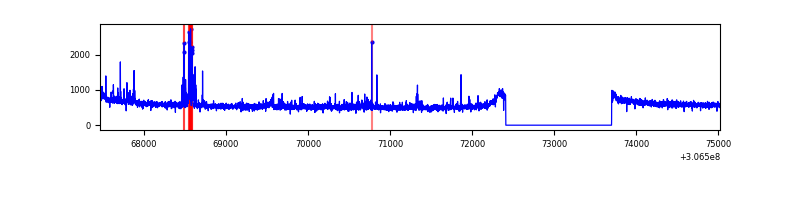 |
| C | 7556 | 6266 | 0 | 0 | 0.00% | 0.00% | 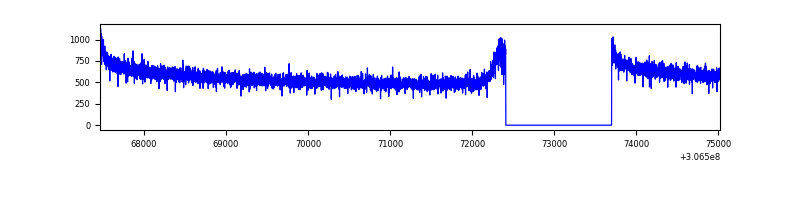 |
| D | 7556 | 6266 | 53 | 53 | 0.70% | 0.85% | 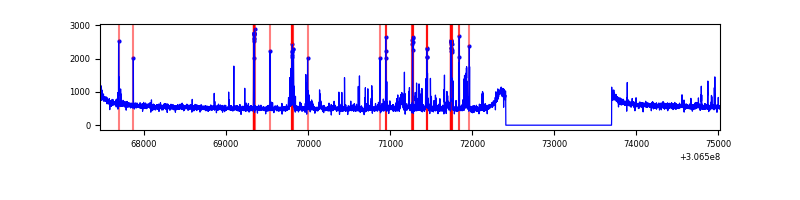 |
Top three noisy pixels from each quadrant. If the there are fewer than three noisy pixels in the level2.evt file, extra rows are filled as -1
| Pixel properties | Quadrant properties | ||||||
|---|---|---|---|---|---|---|---|
| Quadrant | DetID | PixID | Counts | Sigma | Mean | Median | Sigma |
| A | 13 | 254 | 8550 | 43.09 | 902 | 888 | 177.8 |
| A | 0 | 226 | 7721 | 38.42 | 902 | 888 | 177.8 |
| A | 3 | 137 | 6707 | 32.72 | 902 | 888 | 177.8 |
| B | 3 | 64 | 111380 | 667.68 | 896 | 877 | 165.5 |
| B | 0 | 230 | 33077 | 194.56 | 896 | 877 | 165.5 |
| B | 12 | 111 | 18548 | 106.77 | 896 | 877 | 165.5 |
| C | 14 | 238 | 140229 | 701.46 | 873 | 881 | 198.7 |
| C | 13 | 61 | 6343 | 27.5 | 873 | 881 | 198.7 |
| C | 3 | 202 | 2089 | 6.08 | 873 | 881 | 198.7 |
| D | 13 | 153 | 119619 | 564.82 | 885 | 860 | 210.3 |
| D | 7 | 38 | 104796 | 494.32 | 885 | 860 | 210.3 |
| D | 5 | 222 | 43311 | 201.9 | 885 | 860 | 210.3 |
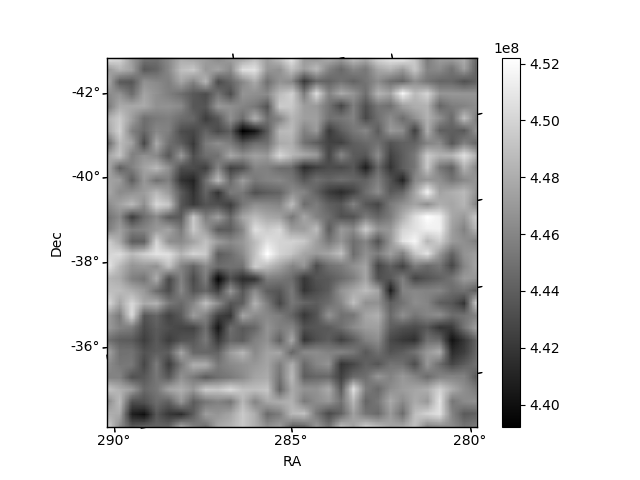
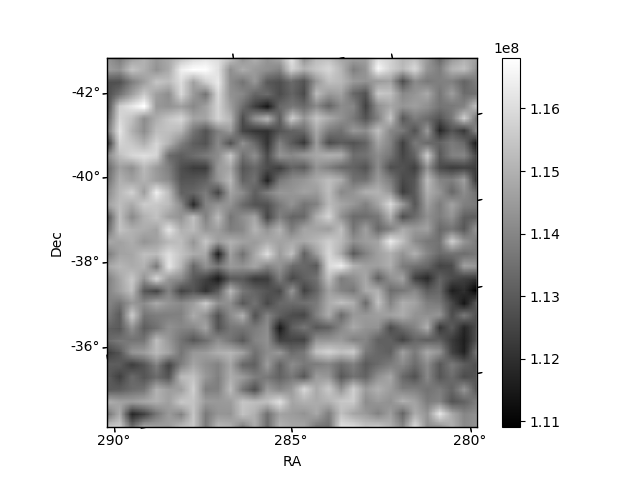
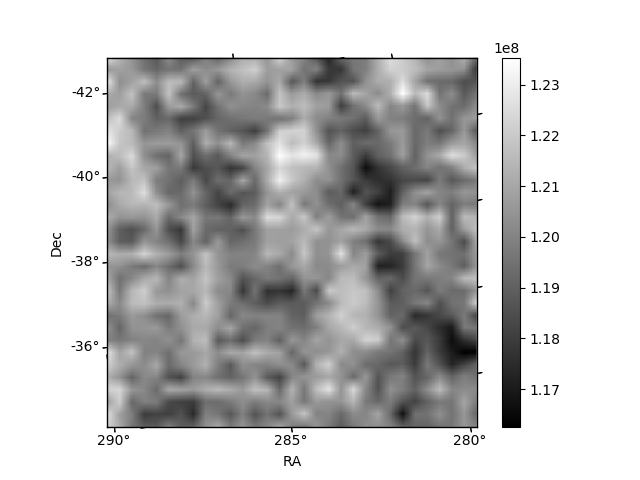
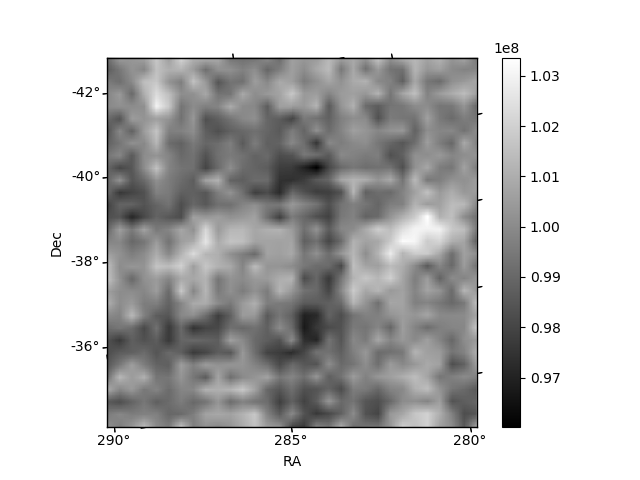
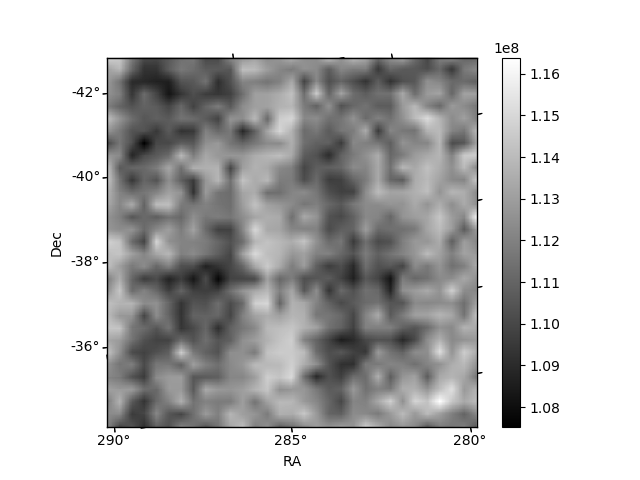
Histogram calculated using DETX and DETY for each event in the final _common_clean file
| Quadrant A | 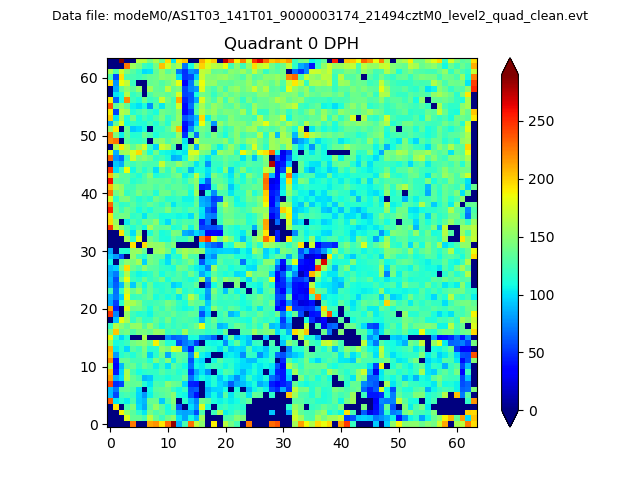 |
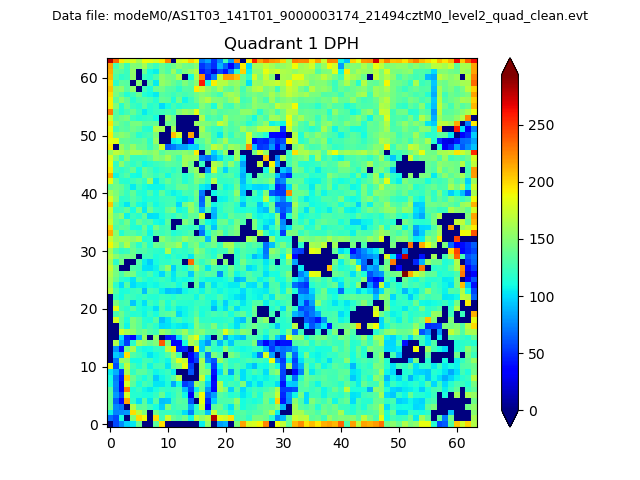 |
Quadrant B |
|---|---|---|---|
| Quadrant D | 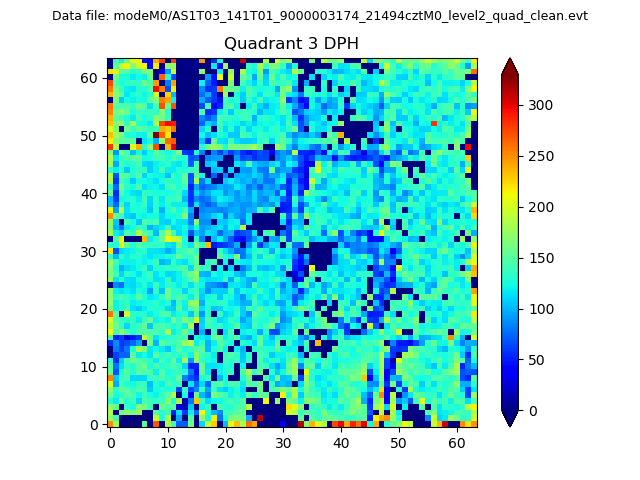 |
 |
Quadrant C |
| Plot type | Count rate plots | Images |
|---|---|---|
| Comparison with Poisson distribution Blue bars denote a histogram of data divided into 1 sec bins. Red curve is a Poisson curve with rate = median count rate of data. |
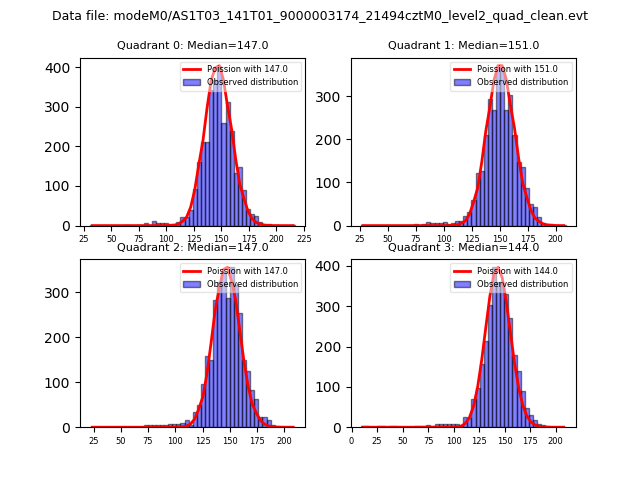 |
 |
| Quadrant-wise count rates Data is divided into 100 sec bins |
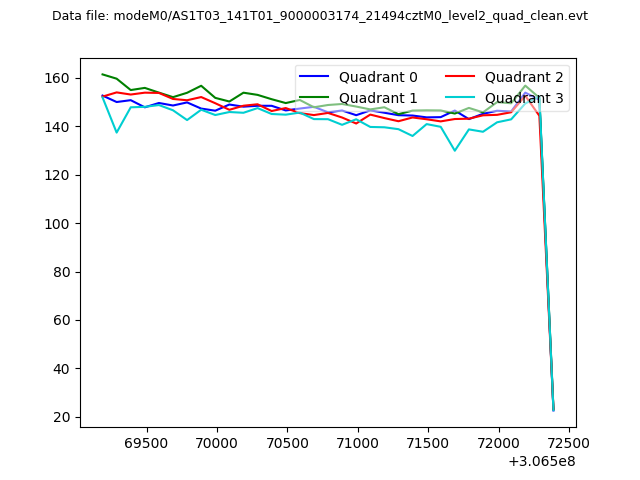 |
|
| Module-wise count rates for Quadrant A Data is divided into 100 sec bins |
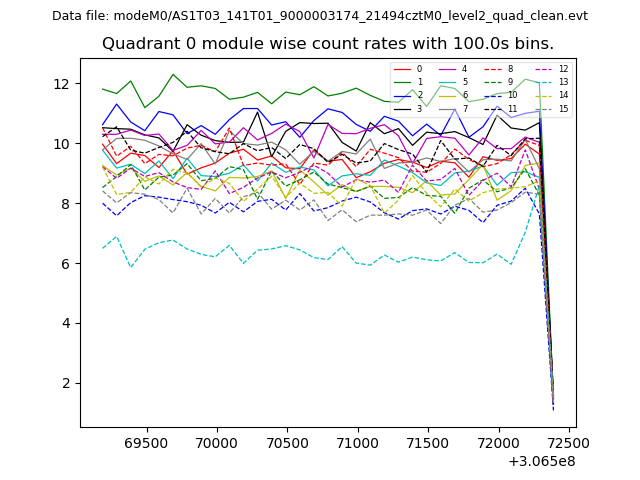 |
 |
| Module-wise count rates for Quadrant B Data is divided into 100 sec bins |
 |
 |
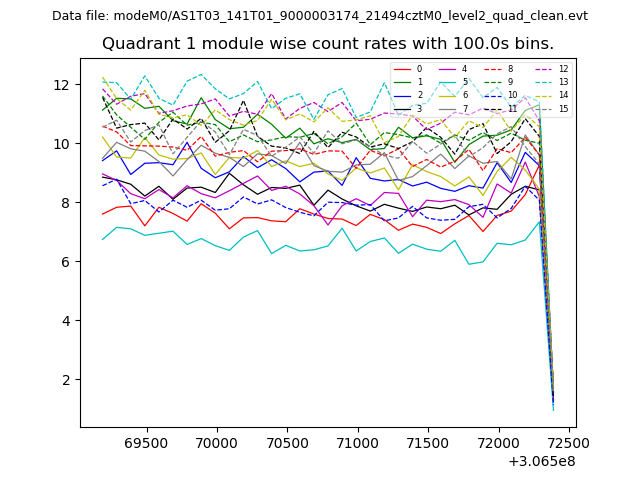
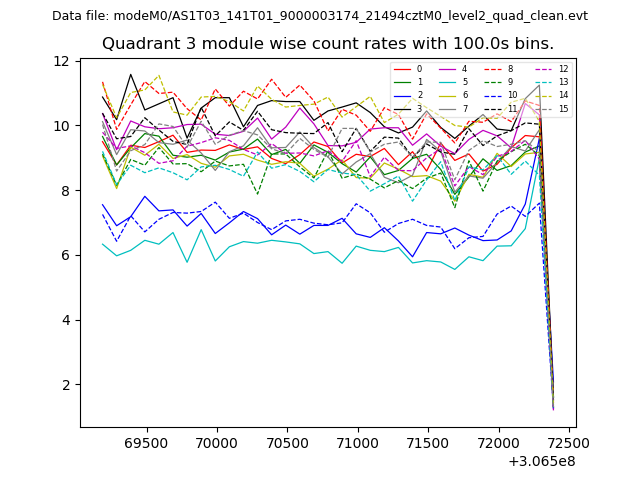
| Module-wise count rates for Quadrant C Data is divided into 100 sec bins |
 |
 |
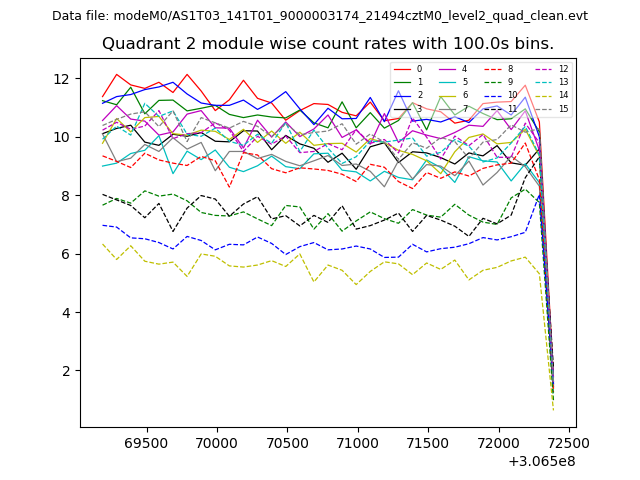
| Module-wise count rates for Quadrant D Data is divided into 100 sec bins |
 |
 |
| Parameter | Plot |
|---|---|
| CZT HV Monitor | 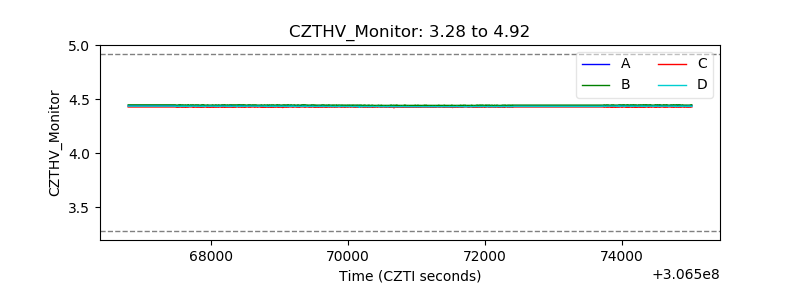 |
| D_VDD | 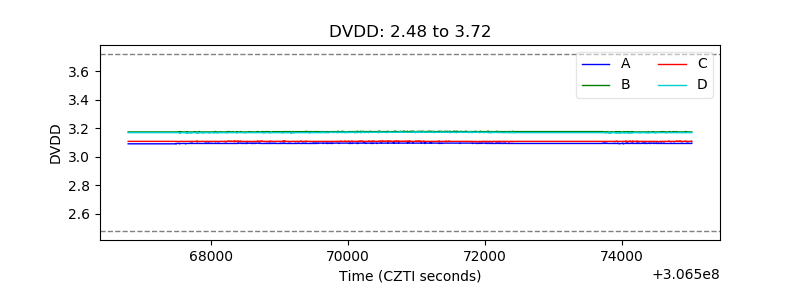 |
| Temperature 1 | 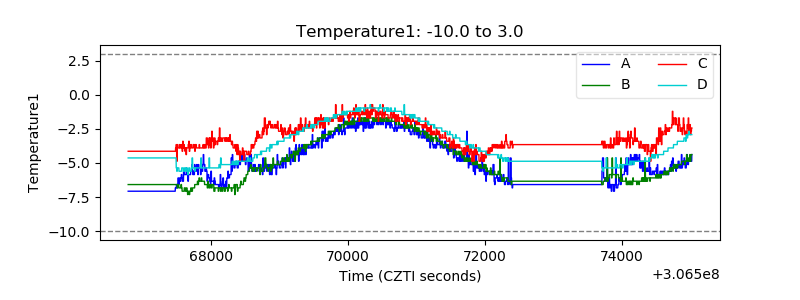 |
| Veto HV Monitor | 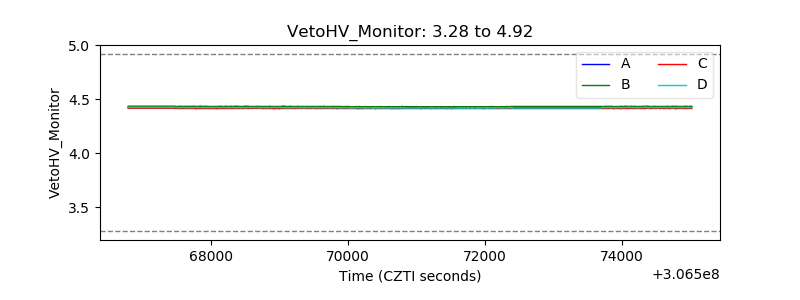 |
| Veto LLD | 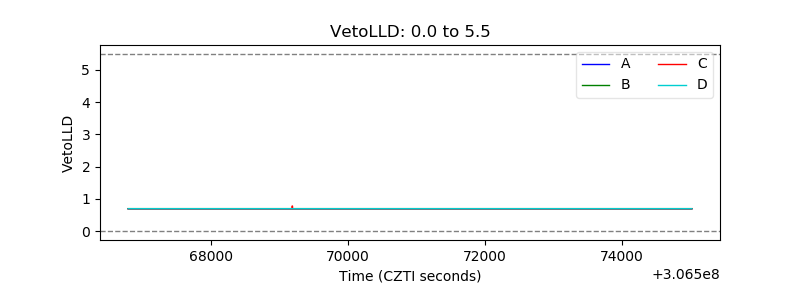 |
| Alpha Counter | 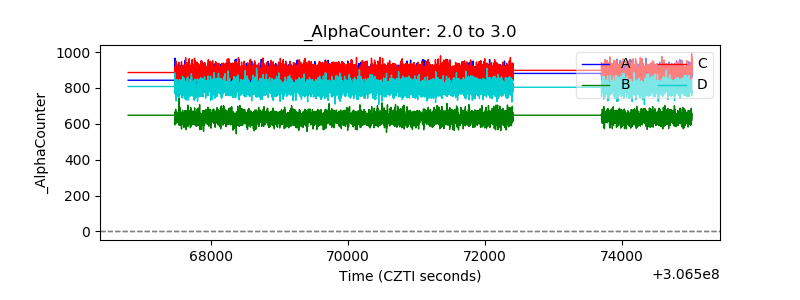 |
| _CPM_Rate | 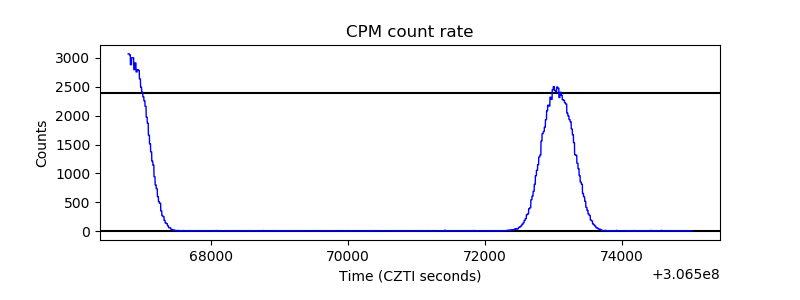 |
| CZT Counter |  |
| +2.5 Volts monitor |  |
| +5 Volts monitor | 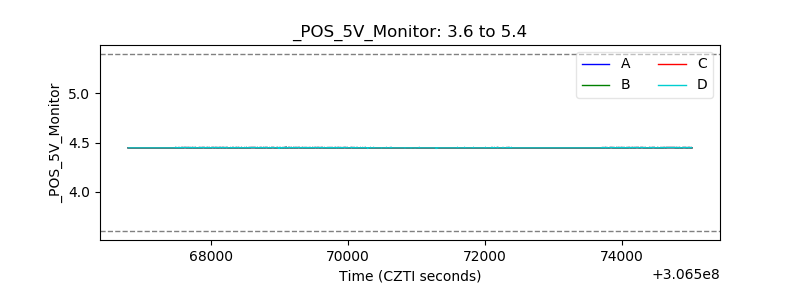 |
| _ROLL_ROT | 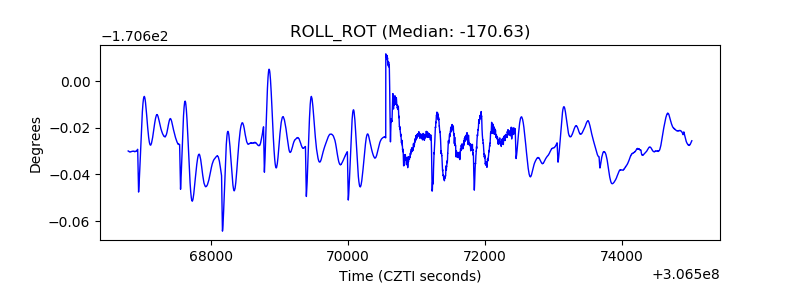 |
| _Roll_DEC | 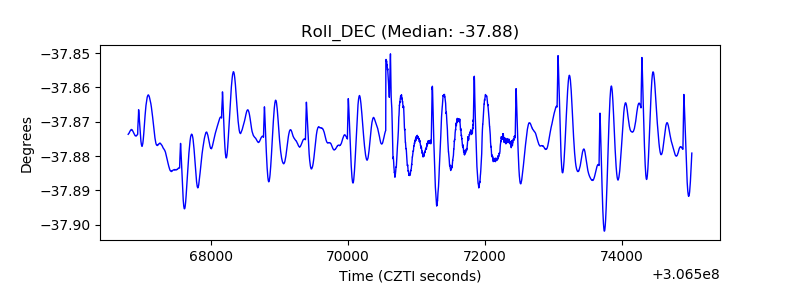 |
| _Roll_RA |  |
| Veto Counter | 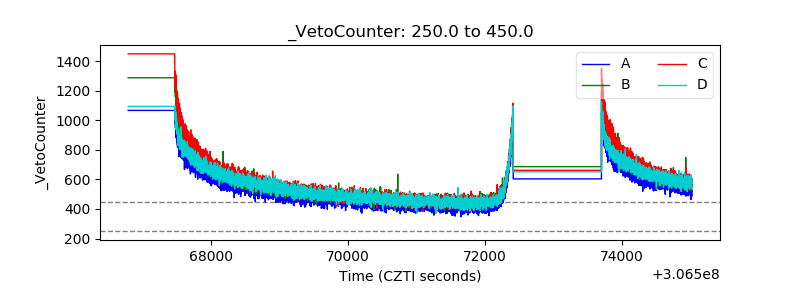 |