| Param | Original file | Final file |
|---|---|---|
| Filename | modeM0/AS1T03_141T01_9000003174_21495cztM0_level2.evt | modeM0/AS1T03_141T01_9000003174_21495cztM0_level2_quad_clean.evt |
| Size (bytes) | 478,529,280 | 93,588,480 |
| Size | 456.4 MB | 89.3 MB |
| Events in quadrant A | 3,428,967 | 601,418 |
| Events in quadrant B | 3,512,813 | 613,735 |
| Events in quadrant C | 3,465,140 | 597,101 |
| Events in quadrant D | 3,662,918 | 587,448 |
| Mode M9 | |||
|---|---|---|---|
| Quadrant | BADHDUFLAG | Total packets | Discarded packets |
| A | 0 | 14 | 0 |
| B | 0 | 15 | 0 |
| C | 0 | 15 | 0 |
| D | 0 | 15 | 0 |
| Mode M0 | |||
|---|---|---|---|
| Quadrant | BADHDUFLAG | Total packets | Discarded packets |
| A | 0 | 14004 | 0 |
| B | 0 | 14200 | 0 |
| C | 0 | 14282 | 0 |
| D | 0 | 14634 | 0 |
| Mode SS | |||
|---|---|---|---|
| Quadrant | BADHDUFLAG | Total packets | Discarded packets |
| A | 0 | 126 | 0 |
| B | 0 | 126 | 0 |
| C | 0 | 126 | 0 |
| D | 0 | 126 | 0 |
| Quadrant | Total seconds | Saturated seconds | Saturation percentage |
|---|---|---|---|
| A | 6227 | 106 | 1.702264% |
| B | 6227 | 123 | 1.975269% |
| C | 6227 | 160 | 2.569456% |
| D | 6227 | 101 | 1.621969% |
Noise dominated data is calculated using 1-second bins in cleaned event files. If a bin has >2000 counts, and if more than 50% of those come from <1% of pixels, then it is considered to be noise-dominated and hence unusable.
| Quadrant | # 1 sec bins | Bins with >0 counts | Bins with >2000 counts | High rate bins dominated by noise | Noise dominated (total time) | Noise dominated (detector-on time) | Marked lightcurve |
|---|---|---|---|---|---|---|---|
| A | 7561 | 6226 | 0 | 0 | 0.00% | 0.00% | 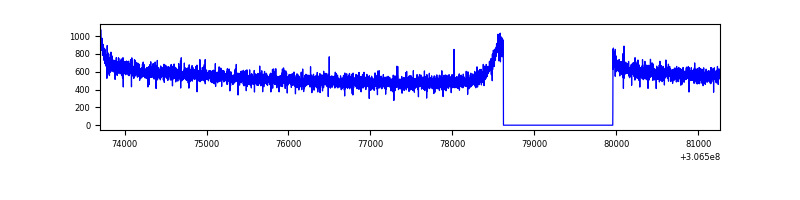 |
| B | 7562 | 6227 | 0 | 0 | 0.00% | 0.00% | 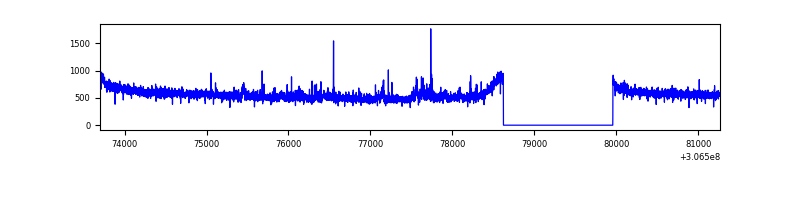 |
| C | 7562 | 6227 | 0 | 0 | 0.00% | 0.00% | 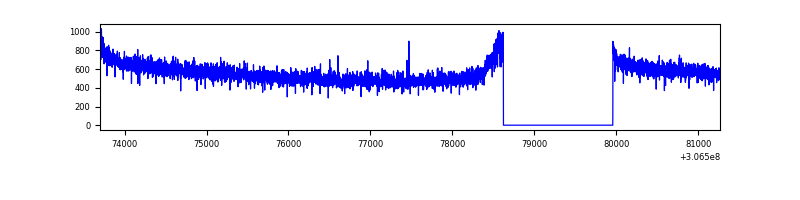 |
| D | 7562 | 6227 | 19 | 19 | 0.25% | 0.31% | 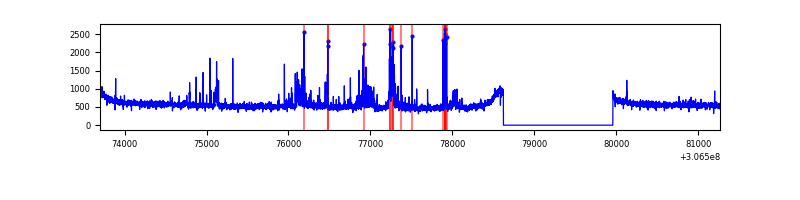 |
Top three noisy pixels from each quadrant. If the there are fewer than three noisy pixels in the level2.evt file, extra rows are filled as -1
| Pixel properties | Quadrant properties | ||||||
|---|---|---|---|---|---|---|---|
| Quadrant | DetID | PixID | Counts | Sigma | Mean | Median | Sigma |
| A | 13 | 254 | 9021 | 46.78 | 888 | 872 | 174.2 |
| A | 0 | 226 | 7791 | 39.72 | 888 | 872 | 174.2 |
| A | 15 | 48 | 7560 | 38.4 | 888 | 872 | 174.2 |
| B | 3 | 64 | 34708 | 208.86 | 877 | 858 | 162.1 |
| B | 0 | 230 | 24100 | 143.41 | 877 | 858 | 162.1 |
| B | 12 | 111 | 18360 | 107.99 | 877 | 858 | 162.1 |
| C | 14 | 238 | 136711 | 697.85 | 853 | 862 | 194.7 |
| C | 13 | 61 | 5924 | 26.0 | 853 | 862 | 194.7 |
| C | 3 | 202 | 2102 | 6.37 | 853 | 862 | 194.7 |
| D | 5 | 222 | 196943 | 859.14 | 863 | 851 | 228.2 |
| D | 7 | 38 | 92182 | 400.15 | 863 | 851 | 228.2 |
| D | 13 | 153 | 35595 | 152.22 | 863 | 851 | 228.2 |
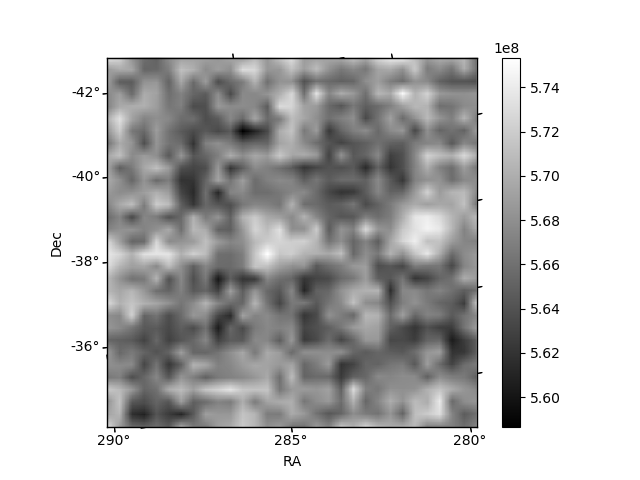
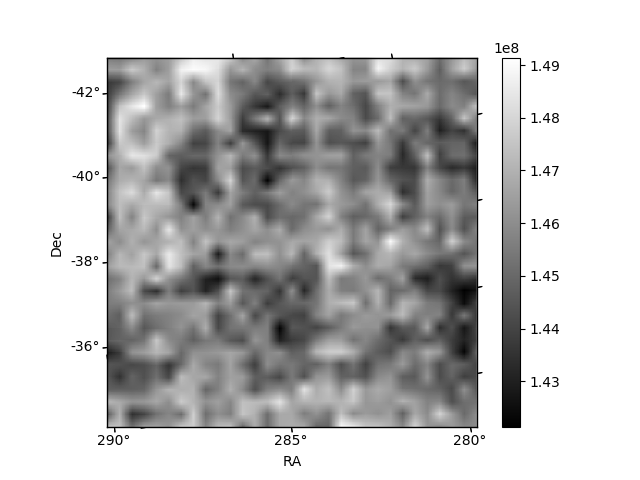
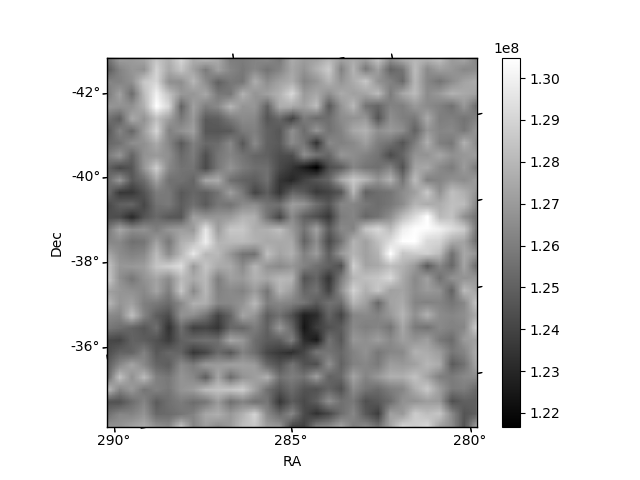
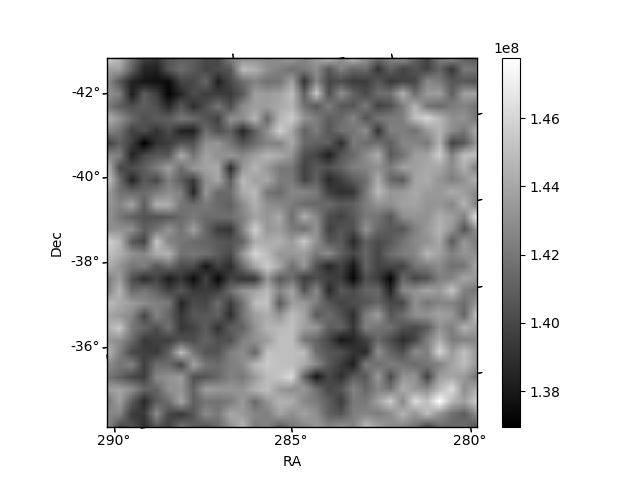
Histogram calculated using DETX and DETY for each event in the final _common_clean file
| Quadrant A | 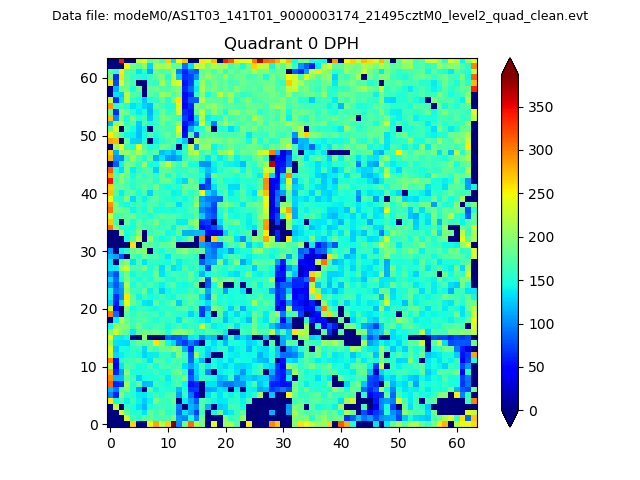 |
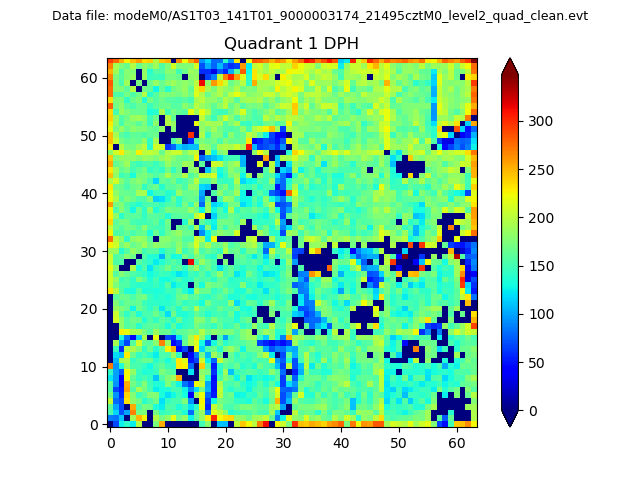 |
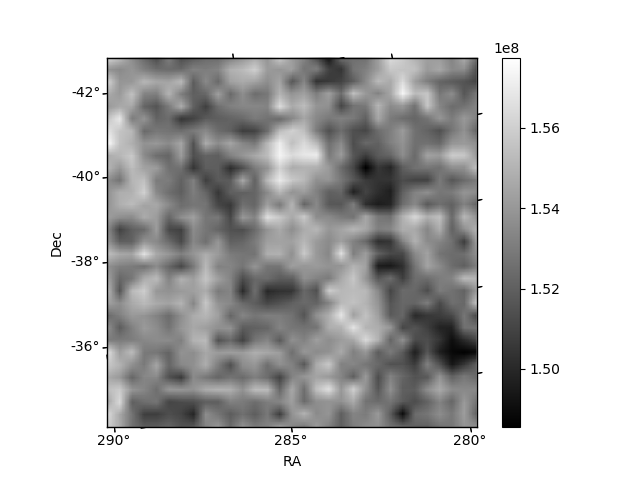
Quadrant B |
|---|---|---|---|
| Quadrant D | 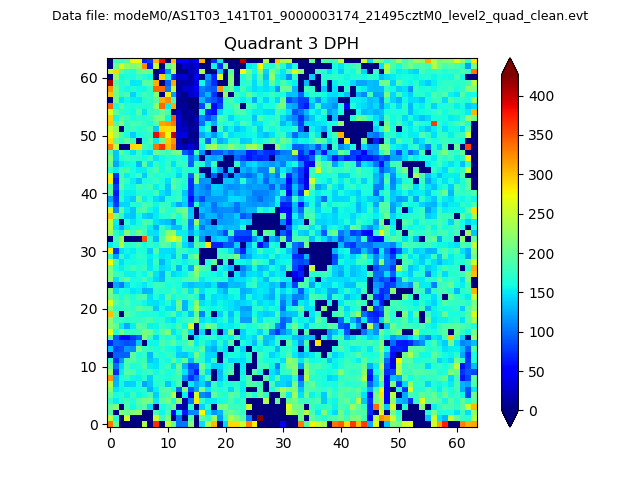 |
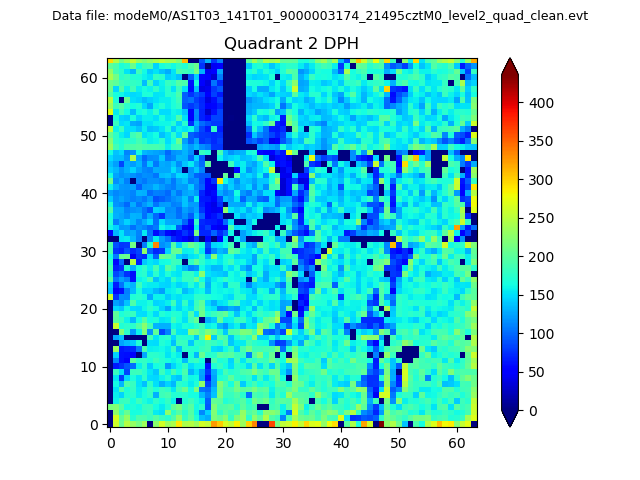 |
Quadrant C |
| Plot type | Count rate plots | Images |
|---|---|---|
| Comparison with Poisson distribution Blue bars denote a histogram of data divided into 1 sec bins. Red curve is a Poisson curve with rate = median count rate of data. |
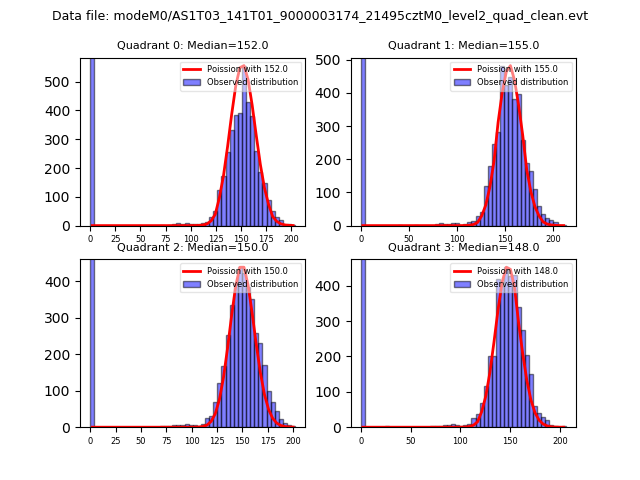 |
 |
| Quadrant-wise count rates Data is divided into 100 sec bins |
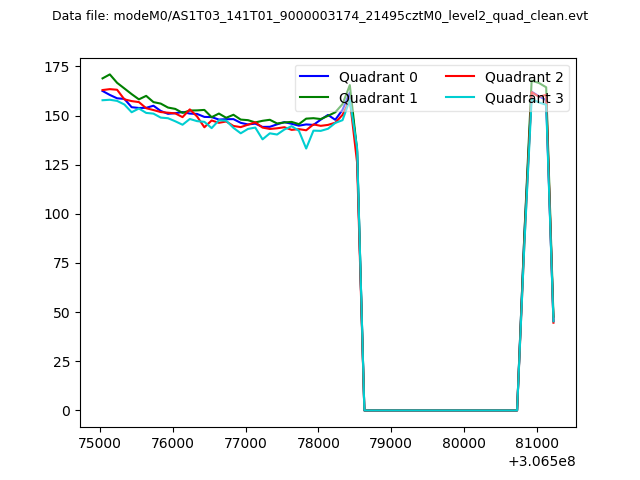 |
|
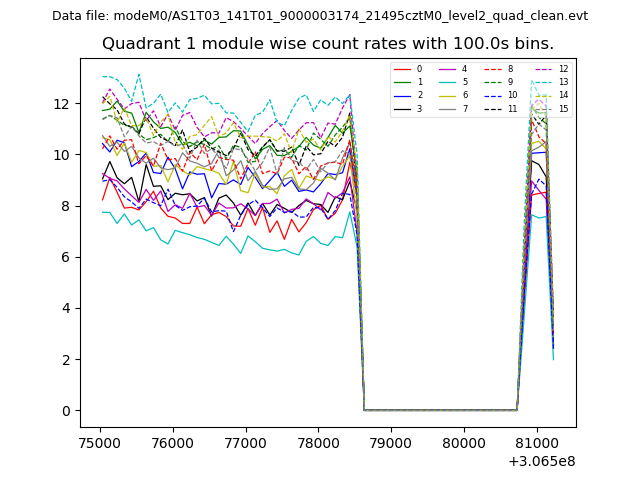
| Module-wise count rates for Quadrant A Data is divided into 100 sec bins |
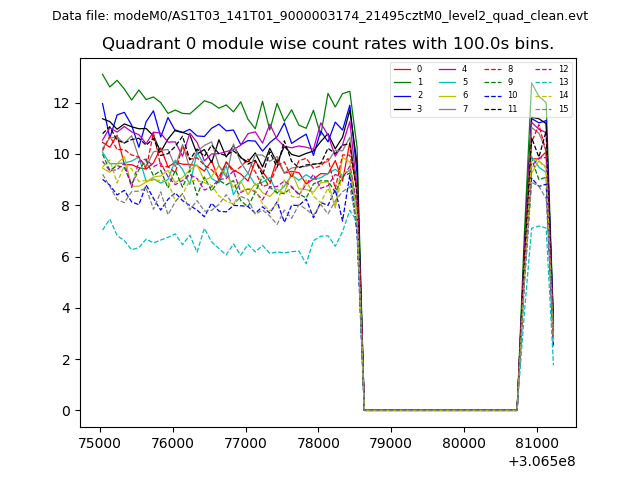 |
 |
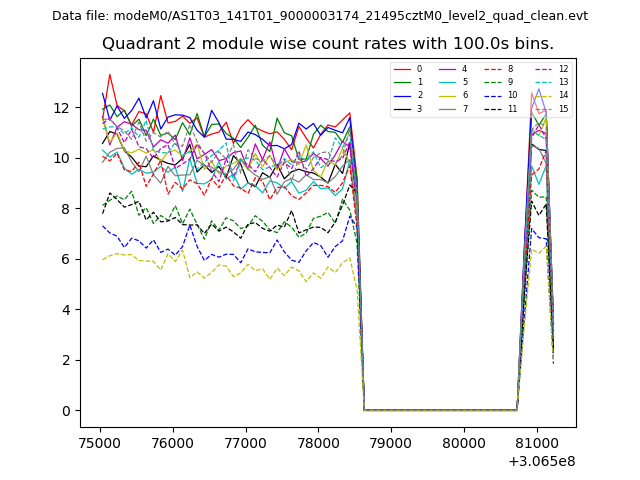
| Module-wise count rates for Quadrant B Data is divided into 100 sec bins |
 |
 |
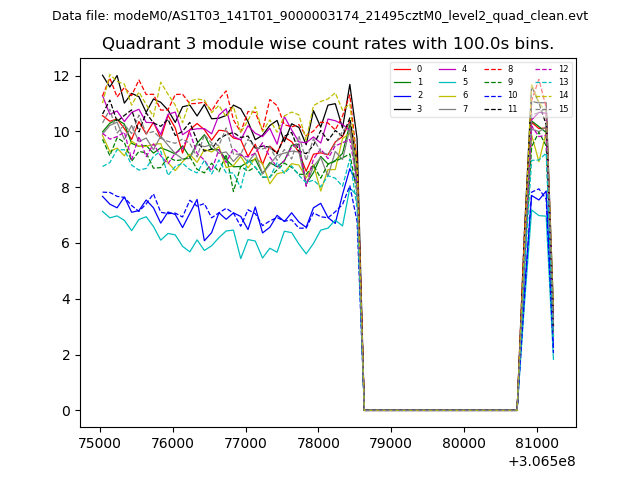
| Module-wise count rates for Quadrant C Data is divided into 100 sec bins |
 |
 |
| Module-wise count rates for Quadrant D Data is divided into 100 sec bins |
 |
 |
| Parameter | Plot |
|---|---|
| CZT HV Monitor | 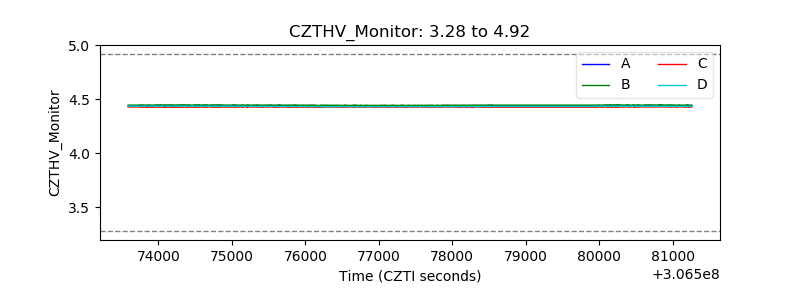 |
| D_VDD |  |
| Temperature 1 | 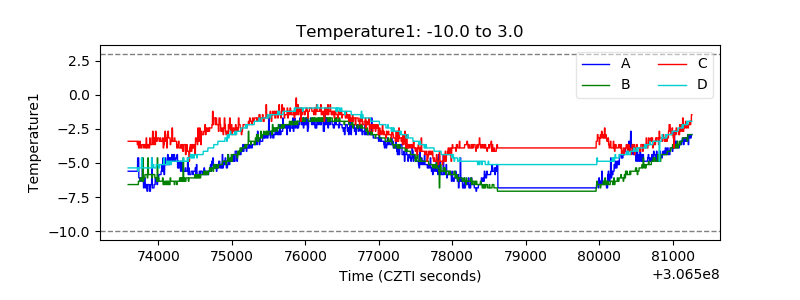 |
| Veto HV Monitor | 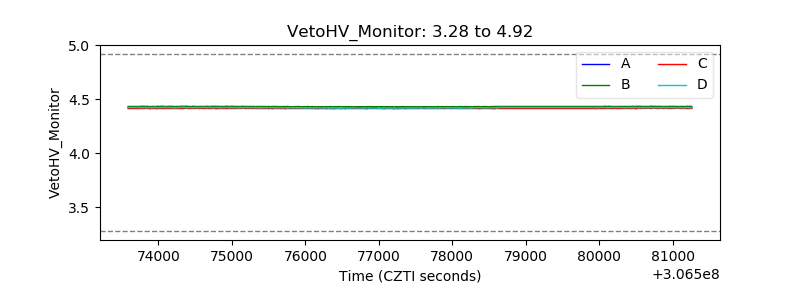 |
| Veto LLD | 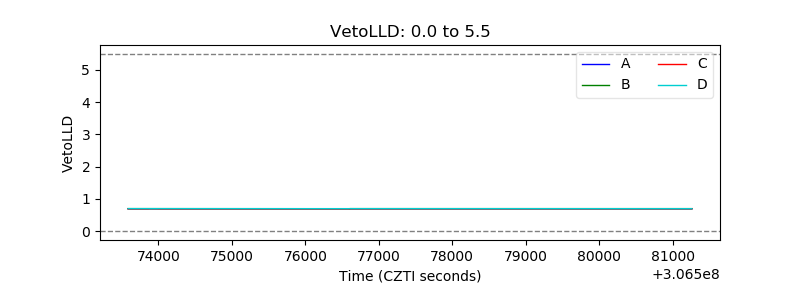 |
| Alpha Counter | 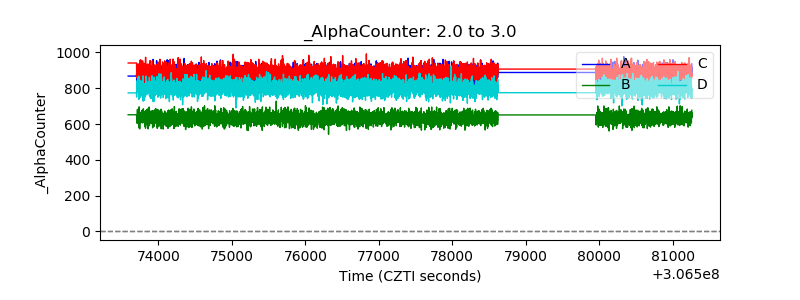 |
| _CPM_Rate | 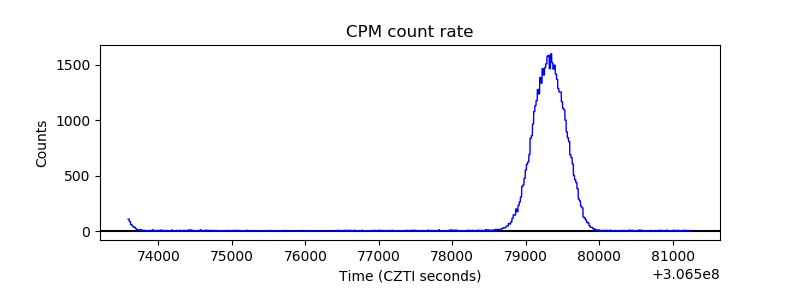 |
| CZT Counter | 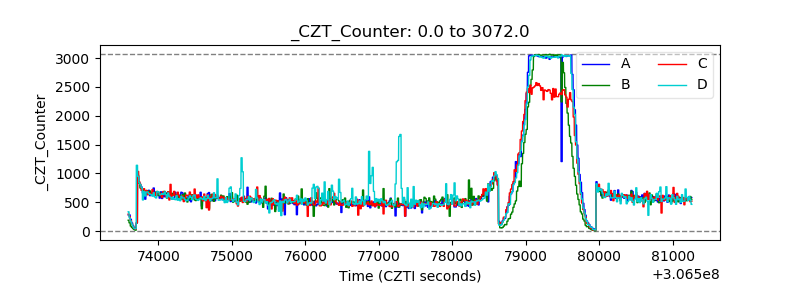 |
| +2.5 Volts monitor |  |
| +5 Volts monitor |  |
| _ROLL_ROT | 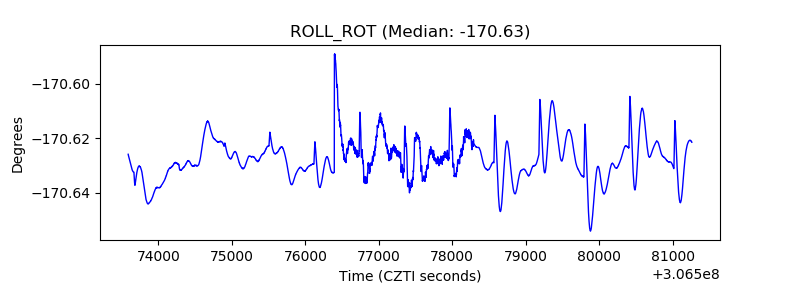 |
| _Roll_DEC | 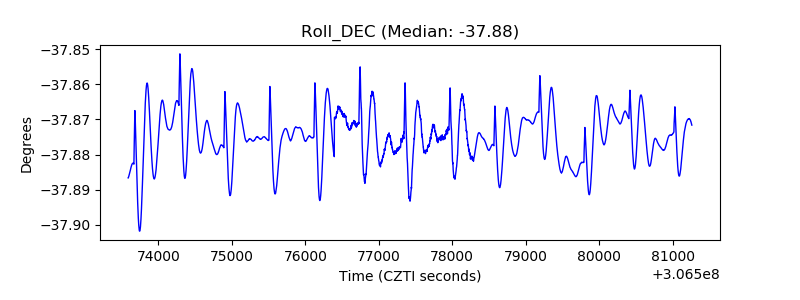 |
| _Roll_RA | 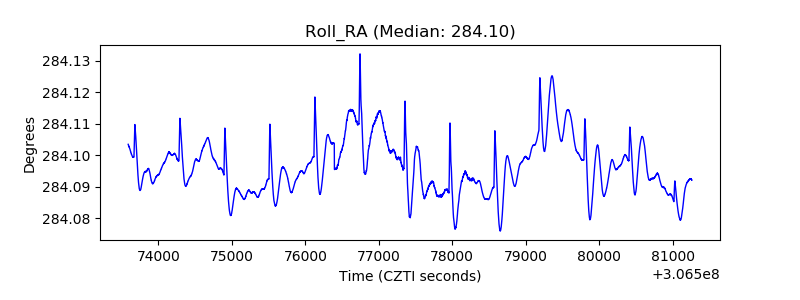 |
| Veto Counter | 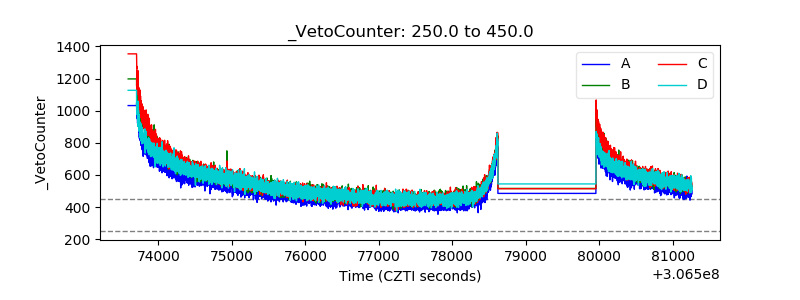 |