| Param | Original file | Final file |
|---|---|---|
| Filename | modeM0/AS1T03_141T01_9000003174_21497cztM0_level2.evt | modeM0/AS1T03_141T01_9000003174_21497cztM0_level2_quad_clean.evt |
| Size (bytes) | 580,115,520 | 103,728,960 |
| Size | 553.2 MB | 98.9 MB |
| Events in quadrant A | 3,293,900 | 687,881 |
| Events in quadrant B | 3,410,682 | 698,552 |
| Events in quadrant C | 3,305,287 | 678,861 |
| Events in quadrant D | 7,109,015 | 613,351 |
| Mode M9 | |||
|---|---|---|---|
| Quadrant | BADHDUFLAG | Total packets | Discarded packets |
| A | 0 | 9 | 0 |
| B | 0 | 9 | 0 |
| C | 0 | 9 | 0 |
| D | 0 | 9 | 0 |
| Mode M0 | |||
|---|---|---|---|
| Quadrant | BADHDUFLAG | Total packets | Discarded packets |
| A | 0 | 13843 | 0 |
| B | 0 | 14108 | 0 |
| C | 0 | 13889 | 0 |
| D | 0 | 25573 | 0 |
| Mode SS | |||
|---|---|---|---|
| Quadrant | BADHDUFLAG | Total packets | Discarded packets |
| A | 0 | 134 | 0 |
| B | 0 | 134 | 0 |
| C | 0 | 134 | 0 |
| D | 0 | 134 | 0 |
| Quadrant | Total seconds | Saturated seconds | Saturation percentage |
|---|---|---|---|
| A | 6638 | 113 | 1.702320% |
| B | 6638 | 124 | 1.868033% |
| C | 6638 | 147 | 2.214522% |
| D | 6638 | 1114 | 16.782163% |
Noise dominated data is calculated using 1-second bins in cleaned event files. If a bin has >2000 counts, and if more than 50% of those come from <1% of pixels, then it is considered to be noise-dominated and hence unusable.
| Quadrant | # 1 sec bins | Bins with >0 counts | Bins with >2000 counts | High rate bins dominated by noise | Noise dominated (total time) | Noise dominated (detector-on time) | Marked lightcurve |
|---|---|---|---|---|---|---|---|
| A | 7527 | 6637 | 0 | 0 | 0.00% | 0.00% | 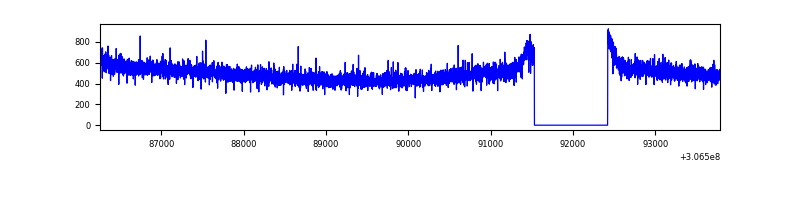 |
| B | 7527 | 6637 | 3 | 3 | 0.04% | 0.05% | 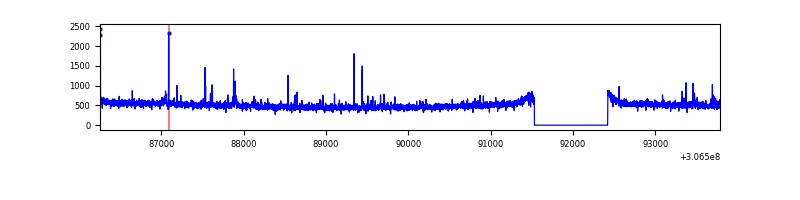 |
| C | 7527 | 6637 | 0 | 0 | 0.00% | 0.00% | 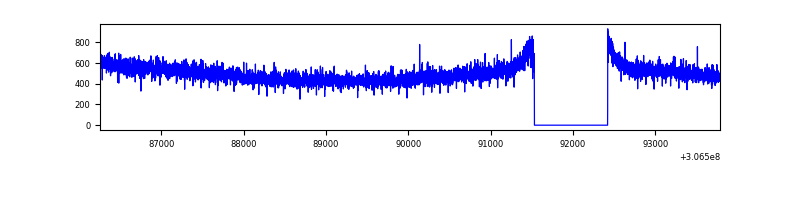 |
| D | 7527 | 6637 | 1095 | 1095 | 14.55% | 16.50% | 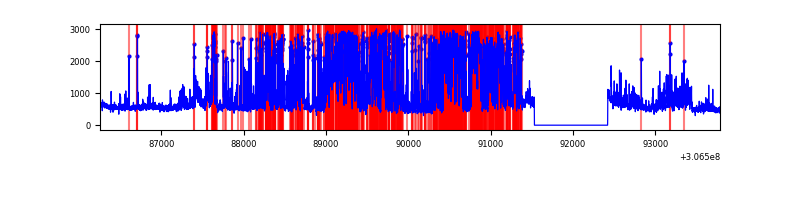 |
Top three noisy pixels from each quadrant. If the there are fewer than three noisy pixels in the level2.evt file, extra rows are filled as -1
| Pixel properties | Quadrant properties | ||||||
|---|---|---|---|---|---|---|---|
| Quadrant | DetID | PixID | Counts | Sigma | Mean | Median | Sigma |
| A | 13 | 254 | 10775 | 58.35 | 854 | 838 | 170.3 |
| A | 0 | 226 | 7374 | 38.38 | 854 | 838 | 170.3 |
| A | 3 | 137 | 7002 | 36.19 | 854 | 838 | 170.3 |
| B | 0 | 190 | 33036 | 201.61 | 845 | 825 | 159.8 |
| B | 0 | 230 | 27690 | 168.15 | 845 | 825 | 159.8 |
| B | 3 | 64 | 21505 | 129.44 | 845 | 825 | 159.8 |
| C | 14 | 238 | 128307 | 676.72 | 813 | 820 | 188.4 |
| C | 13 | 61 | 5756 | 26.2 | 813 | 820 | 188.4 |
| C | 4 | 175 | 3657 | 15.06 | 813 | 820 | 188.4 |
| D | 1 | 52 | 3846153 | 18257.73 | 771 | 754 | 210.6 |
| D | 7 | 38 | 87999 | 414.23 | 771 | 754 | 210.6 |
| D | 14 | 35 | 68515 | 321.73 | 771 | 754 | 210.6 |
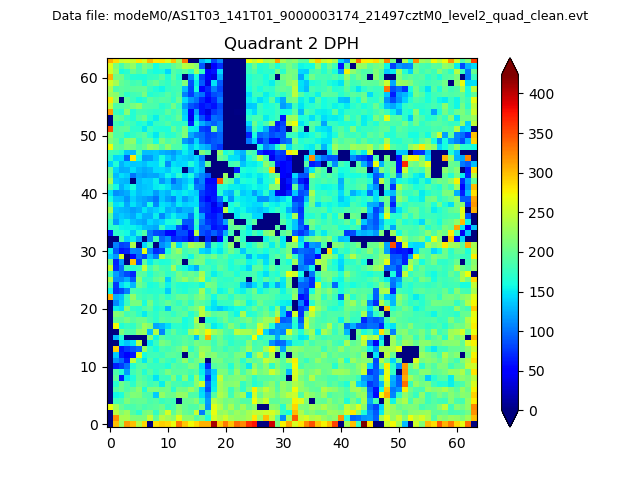
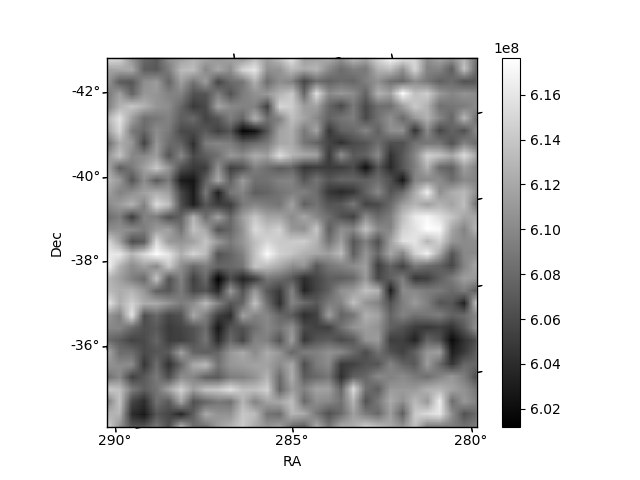
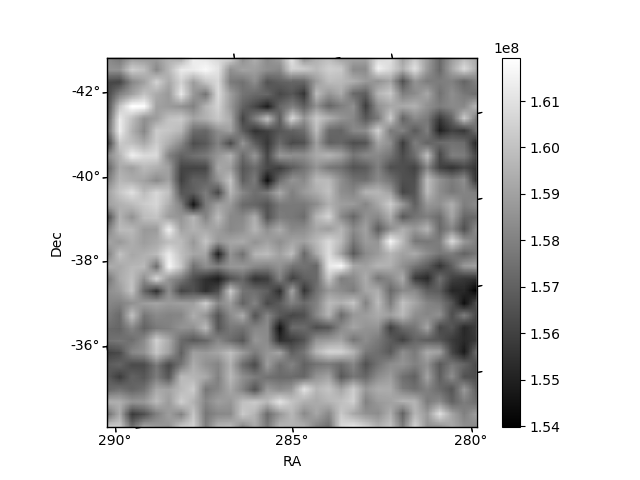
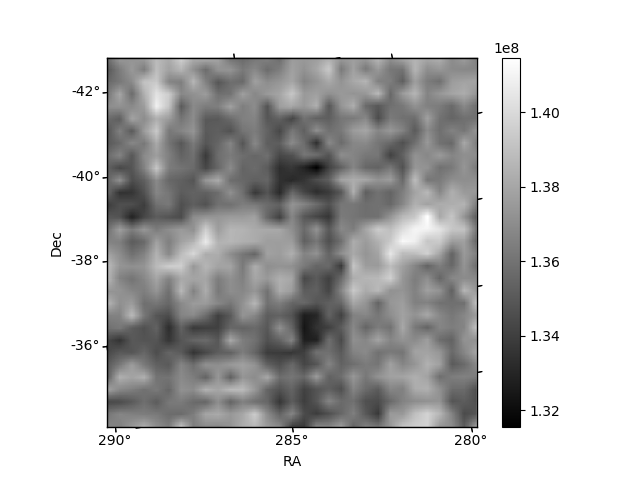
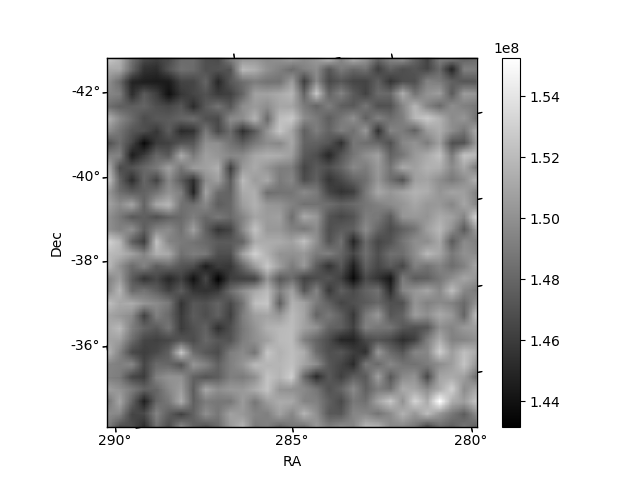
Histogram calculated using DETX and DETY for each event in the final _common_clean file
| Quadrant A | 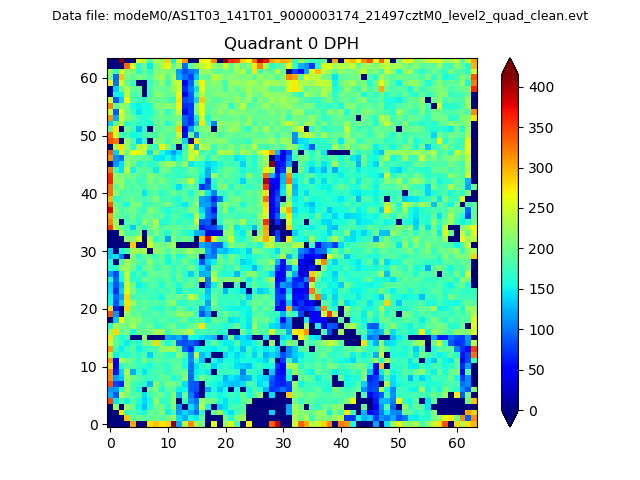 |
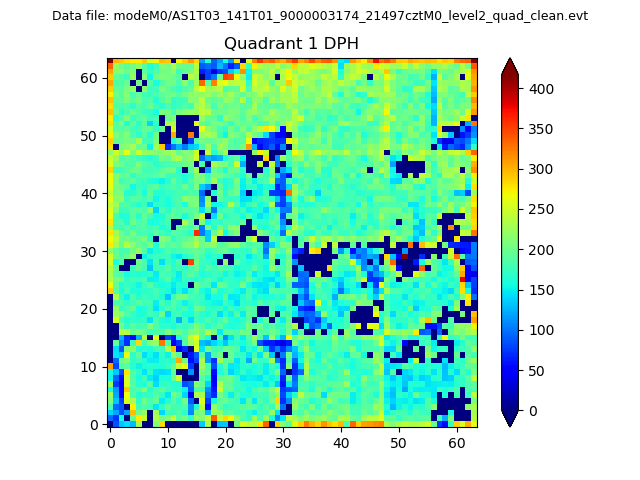 |
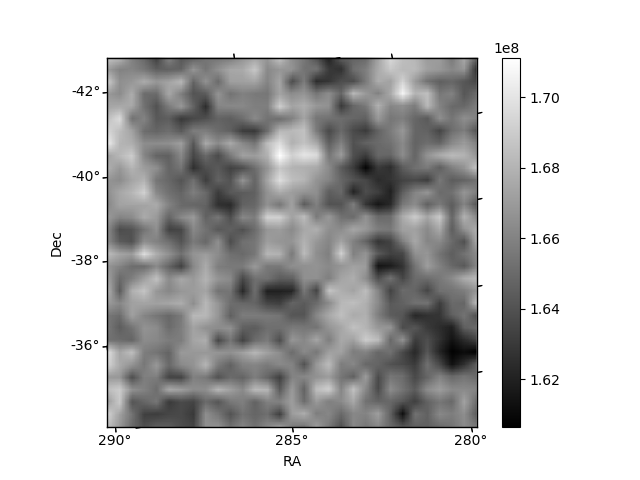
Quadrant B |
|---|---|---|---|
| Quadrant D | 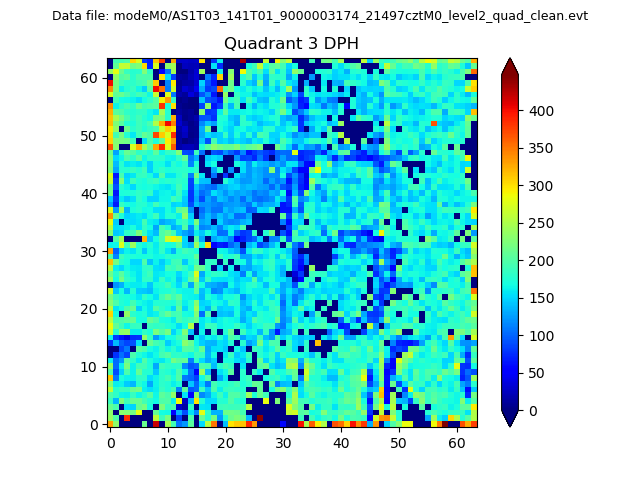 |
 |
Quadrant C |
| Plot type | Count rate plots | Images |
|---|---|---|
| Comparison with Poisson distribution Blue bars denote a histogram of data divided into 1 sec bins. Red curve is a Poisson curve with rate = median count rate of data. |
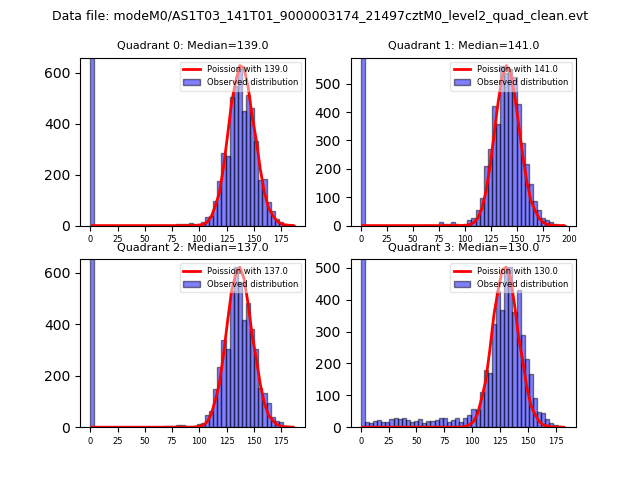 |
 |
| Quadrant-wise count rates Data is divided into 100 sec bins |
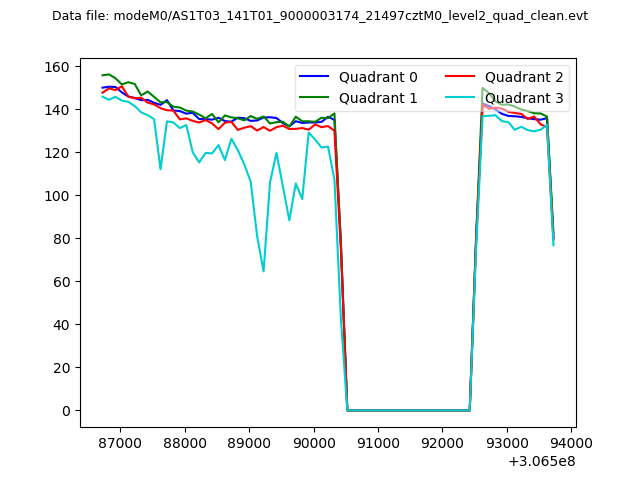 |
|
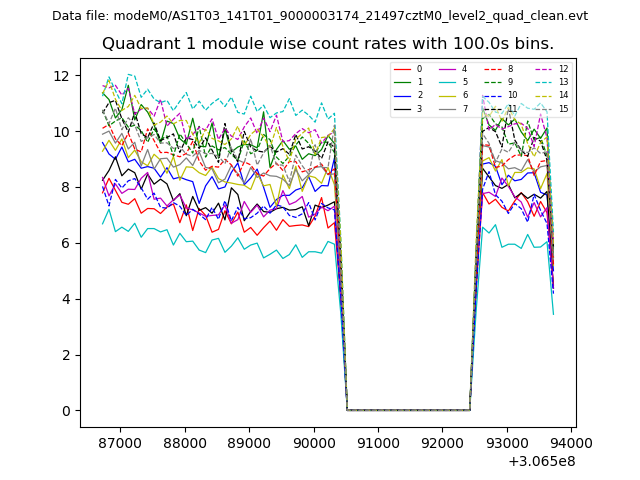
| Module-wise count rates for Quadrant A Data is divided into 100 sec bins |
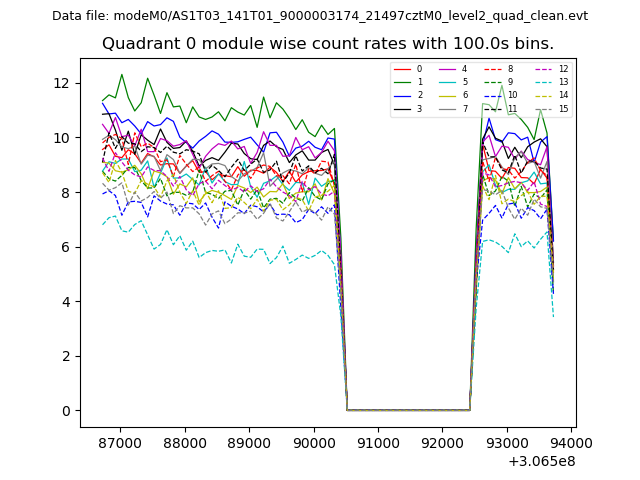 |
 |
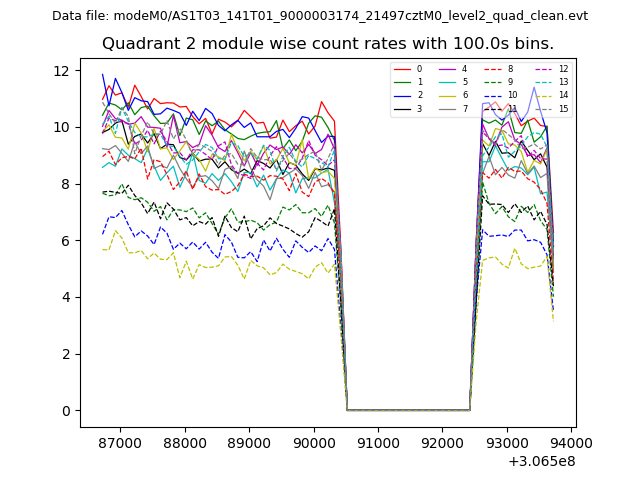
| Module-wise count rates for Quadrant B Data is divided into 100 sec bins |
 |
 |
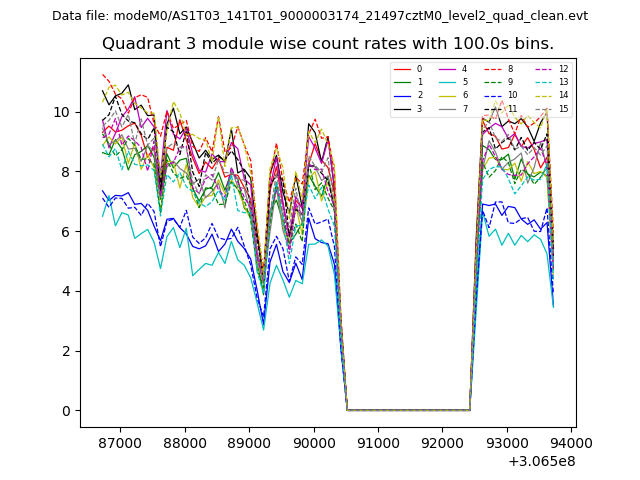
| Module-wise count rates for Quadrant C Data is divided into 100 sec bins |
 |
 |
| Module-wise count rates for Quadrant D Data is divided into 100 sec bins |
 |
 |
| Parameter | Plot |
|---|---|
| CZT HV Monitor | 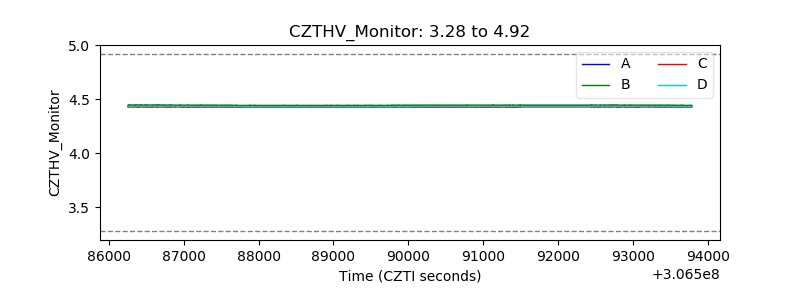 |
| D_VDD | 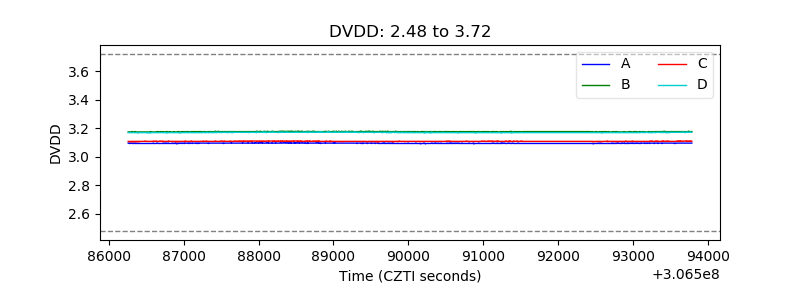 |
| Temperature 1 | 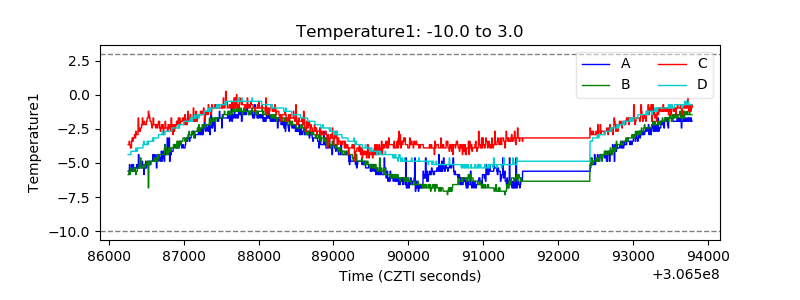 |
| Veto HV Monitor | 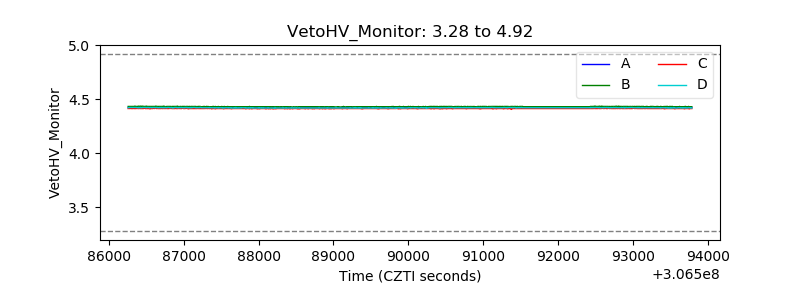 |
| Veto LLD | 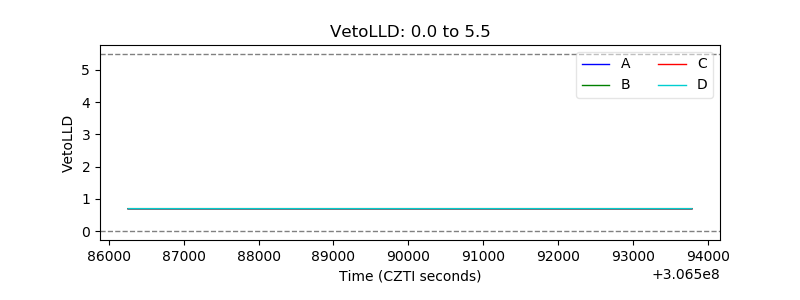 |
| Alpha Counter | 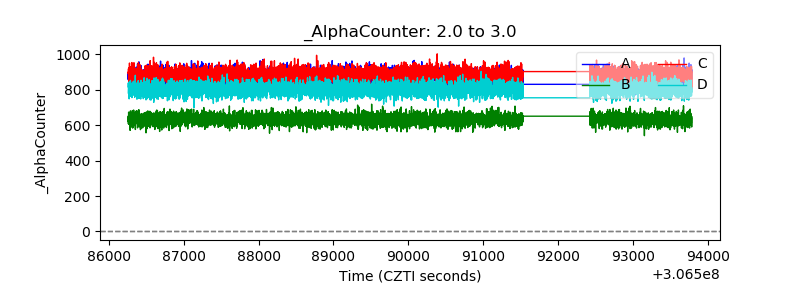 |
| _CPM_Rate | 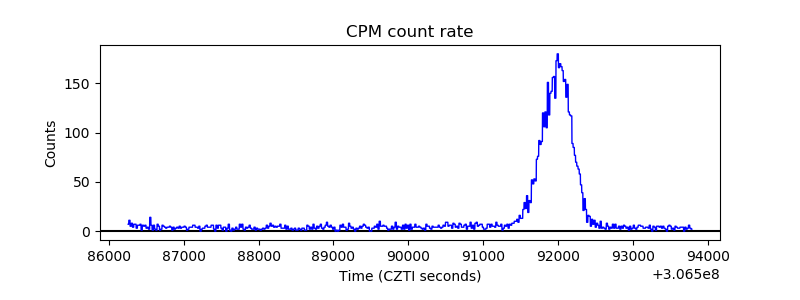 |
| CZT Counter | 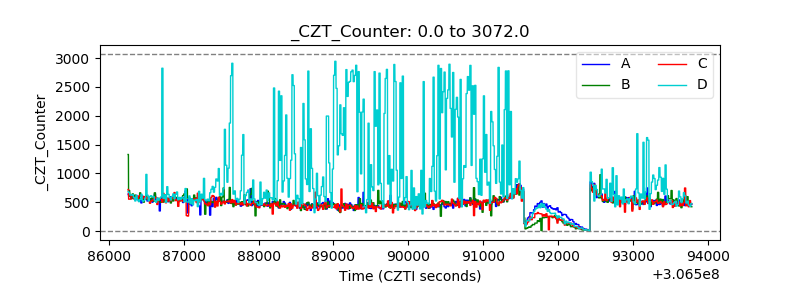 |
| +2.5 Volts monitor |  |
| +5 Volts monitor |  |
| _ROLL_ROT | 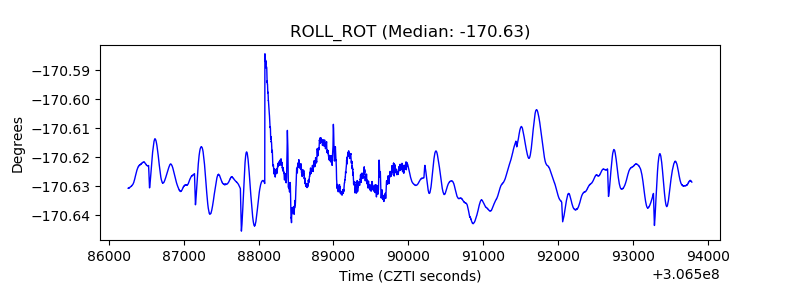 |
| _Roll_DEC | 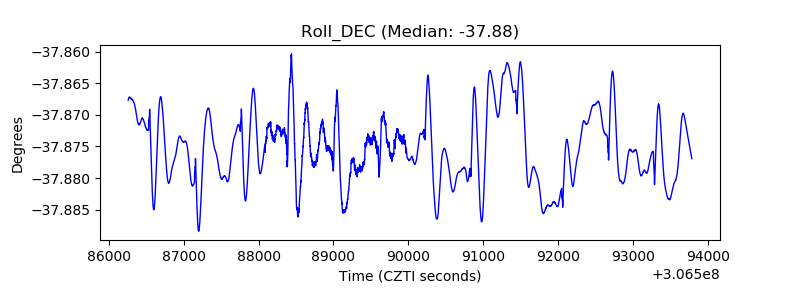 |
| _Roll_RA | 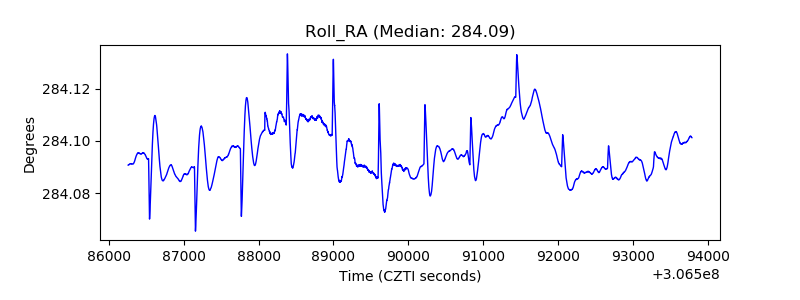 |
| Veto Counter | 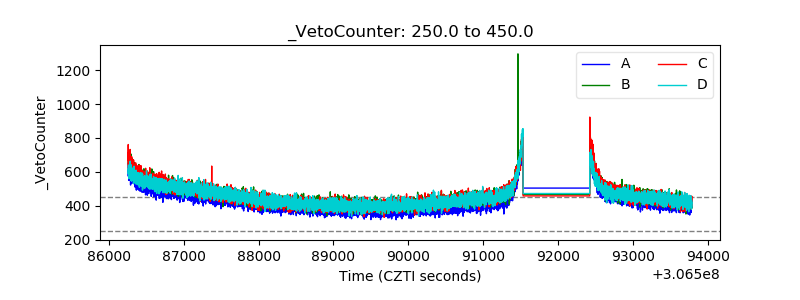 |