| Param | Original file | Final file |
|---|---|---|
| Filename | modeM0/AS1T03_141T01_9000003174_21498cztM0_level2.evt | modeM0/AS1T03_141T01_9000003174_21498cztM0_level2_quad_clean.evt |
| Size (bytes) | 618,814,080 | 104,590,080 |
| Size | 590.1 MB | 99.7 MB |
| Events in quadrant A | 3,475,634 | 685,972 |
| Events in quadrant B | 3,694,204 | 694,078 |
| Events in quadrant C | 3,506,484 | 677,105 |
| Events in quadrant D | 7,580,416 | 612,530 |
| Mode M9 | |||
|---|---|---|---|
| Quadrant | BADHDUFLAG | Total packets | Discarded packets |
| A | 0 | 5 | 0 |
| B | 0 | 6 | 0 |
| C | 0 | 6 | 0 |
| D | 0 | 6 | 0 |
| Mode M0 | |||
|---|---|---|---|
| Quadrant | BADHDUFLAG | Total packets | Discarded packets |
| A | 0 | 14877 | 0 |
| B | 0 | 15363 | 0 |
| C | 0 | 14944 | 0 |
| D | 0 | 27488 | 0 |
| Mode SS | |||
|---|---|---|---|
| Quadrant | BADHDUFLAG | Total packets | Discarded packets |
| A | 0 | 144 | 0 |
| B | 0 | 144 | 0 |
| C | 0 | 144 | 0 |
| D | 0 | 144 | 0 |
| Quadrant | Total seconds | Saturated seconds | Saturation percentage |
|---|---|---|---|
| A | 7150 | 128 | 1.790210% |
| B | 7150 | 172 | 2.405594% |
| C | 7150 | 160 | 2.237762% |
| D | 7150 | 985 | 13.776224% |
Noise dominated data is calculated using 1-second bins in cleaned event files. If a bin has >2000 counts, and if more than 50% of those come from <1% of pixels, then it is considered to be noise-dominated and hence unusable.
| Quadrant | # 1 sec bins | Bins with >0 counts | Bins with >2000 counts | High rate bins dominated by noise | Noise dominated (total time) | Noise dominated (detector-on time) | Marked lightcurve |
|---|---|---|---|---|---|---|---|
| A | 7619 | 7149 | 0 | 0 | 0.00% | 0.00% | 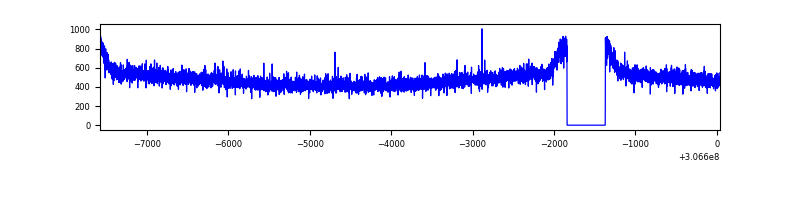 |
| B | 7619 | 7149 | 17 | 17 | 0.22% | 0.24% | 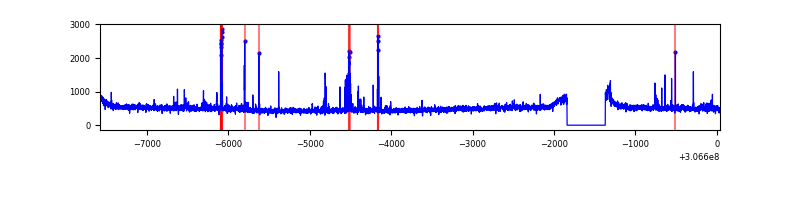 |
| C | 7619 | 7149 | 0 | 0 | 0.00% | 0.00% | 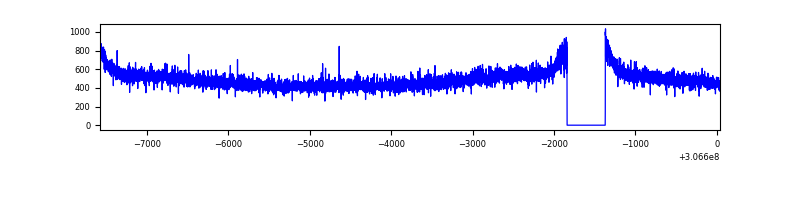 |
| D | 7619 | 7149 | 980 | 980 | 12.86% | 13.71% | 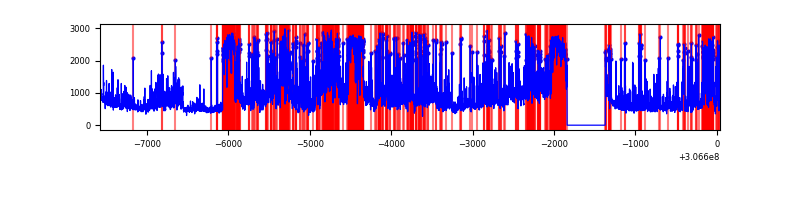 |
Top three noisy pixels from each quadrant. If the there are fewer than three noisy pixels in the level2.evt file, extra rows are filled as -1
| Pixel properties | Quadrant properties | ||||||
|---|---|---|---|---|---|---|---|
| Quadrant | DetID | PixID | Counts | Sigma | Mean | Median | Sigma |
| A | 13 | 254 | 12127 | 62.15 | 901 | 883 | 180.9 |
| A | 0 | 226 | 7816 | 38.32 | 901 | 883 | 180.9 |
| A | 3 | 137 | 7673 | 37.53 | 901 | 883 | 180.9 |
| B | 10 | 249 | 91664 | 528.41 | 893 | 871 | 171.8 |
| B | 0 | 230 | 37698 | 214.33 | 893 | 871 | 171.8 |
| B | 0 | 190 | 29875 | 168.8 | 893 | 871 | 171.8 |
| C | 14 | 238 | 136097 | 670.25 | 861 | 865 | 201.8 |
| C | 4 | 175 | 7010 | 30.46 | 861 | 865 | 201.8 |
| C | 13 | 61 | 6098 | 25.94 | 861 | 865 | 201.8 |
| D | 1 | 52 | 3480366 | 17479.88 | 817 | 791 | 199.1 |
| D | 7 | 38 | 701993 | 3522.54 | 817 | 791 | 199.1 |
| D | 14 | 35 | 108040 | 538.77 | 817 | 791 | 199.1 |
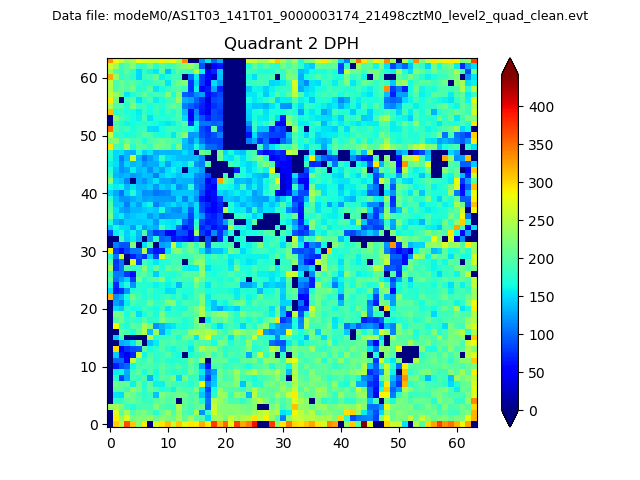
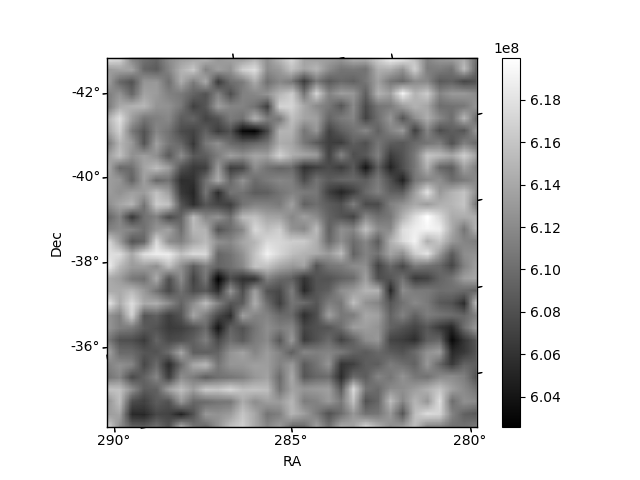
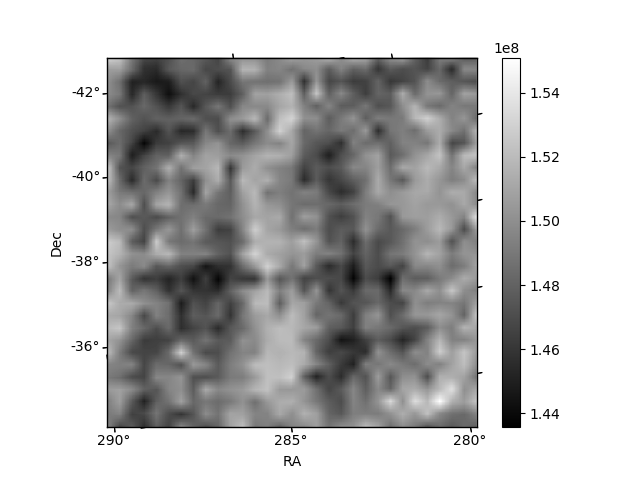
Histogram calculated using DETX and DETY for each event in the final _common_clean file
| Quadrant A | 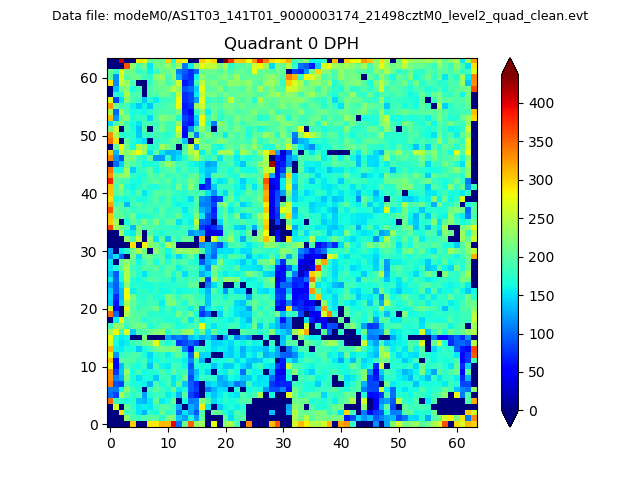 |
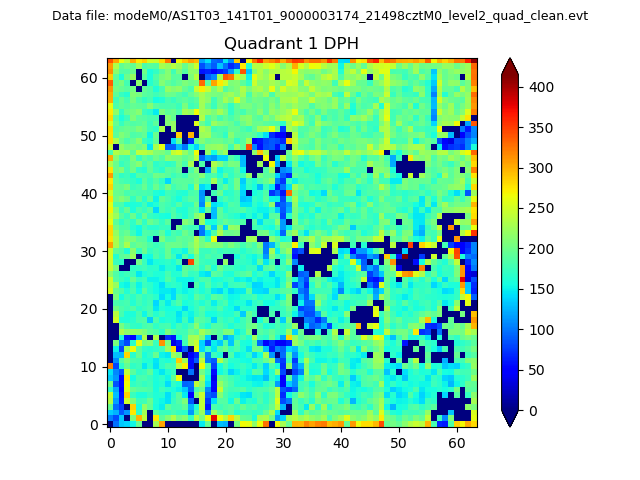 |
Quadrant B |
|---|---|---|---|
| Quadrant D | 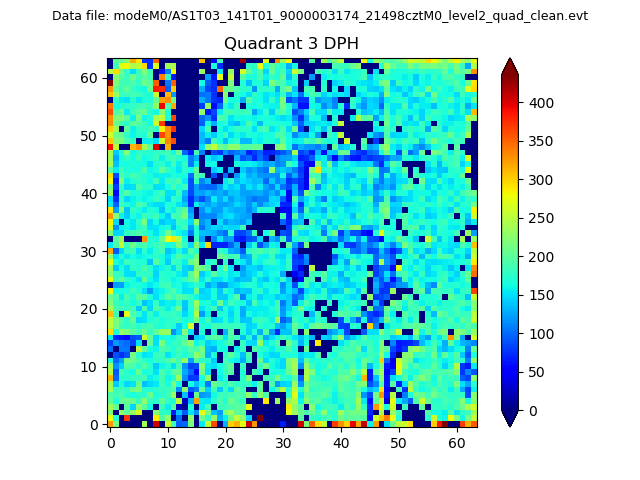 |
 |
Quadrant C |
| Plot type | Count rate plots | Images |
|---|---|---|
| Comparison with Poisson distribution Blue bars denote a histogram of data divided into 1 sec bins. Red curve is a Poisson curve with rate = median count rate of data. |
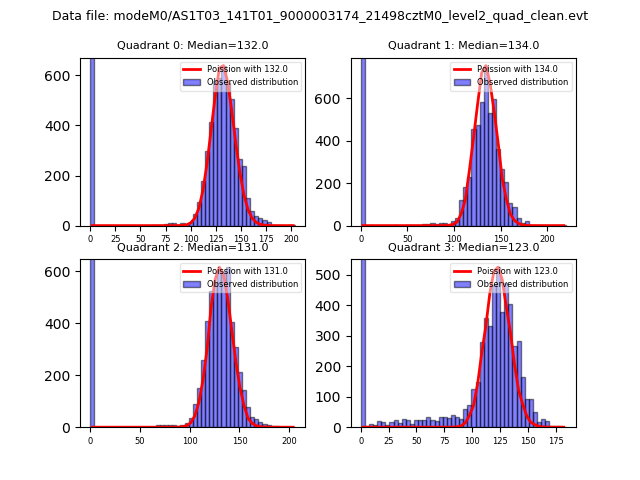 |
 |
| Quadrant-wise count rates Data is divided into 100 sec bins |
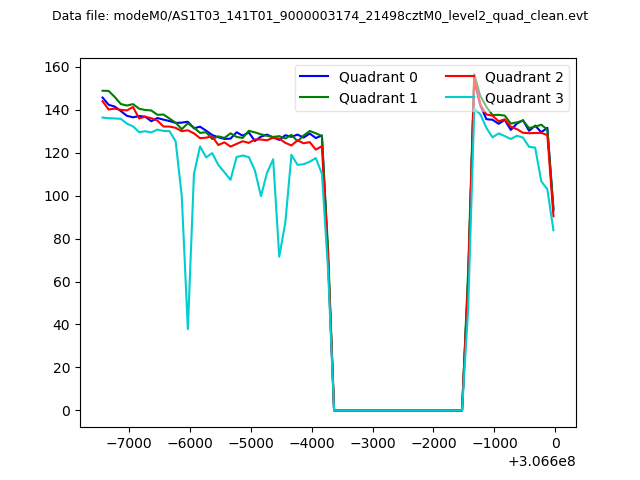 |
|
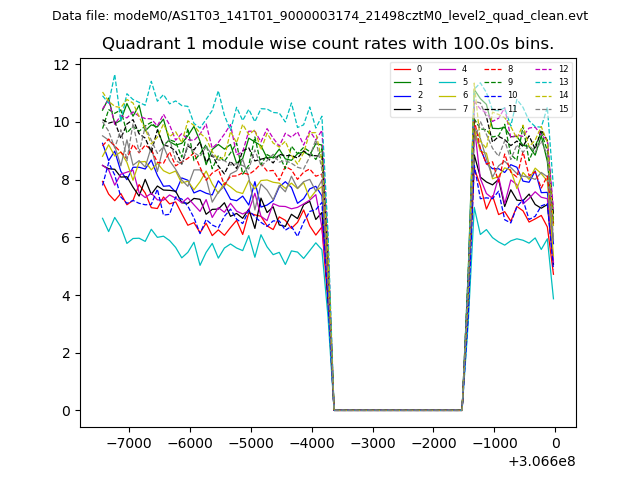
| Module-wise count rates for Quadrant A Data is divided into 100 sec bins |
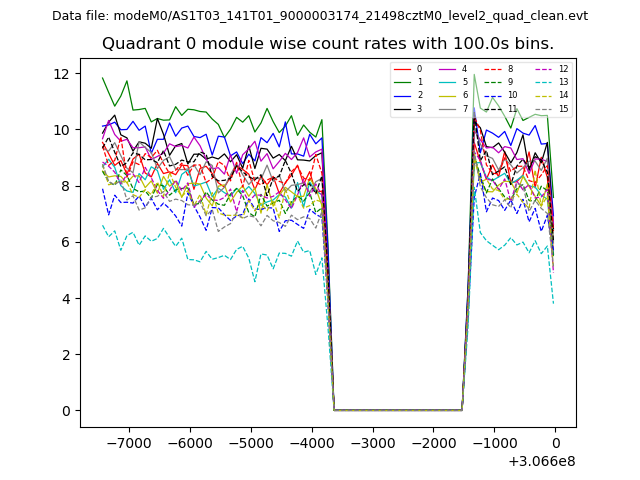 |
 |
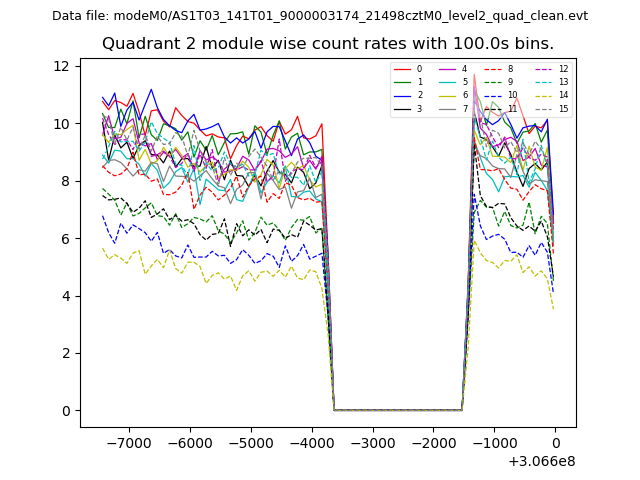
| Module-wise count rates for Quadrant B Data is divided into 100 sec bins |
 |
 |
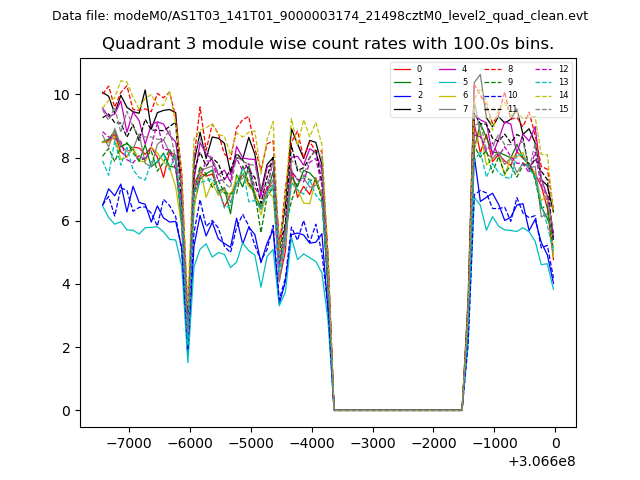
| Module-wise count rates for Quadrant C Data is divided into 100 sec bins |
 |
 |
| Module-wise count rates for Quadrant D Data is divided into 100 sec bins |
 |
 |
| Parameter | Plot |
|---|---|
| CZT HV Monitor | 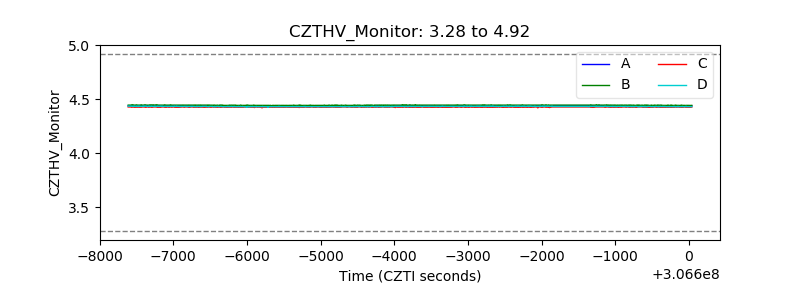 |
| D_VDD | 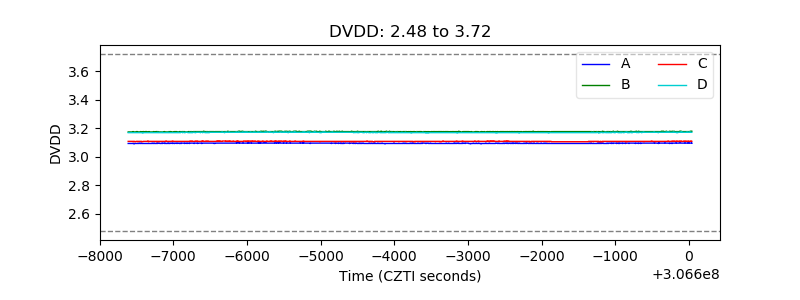 |
| Temperature 1 | 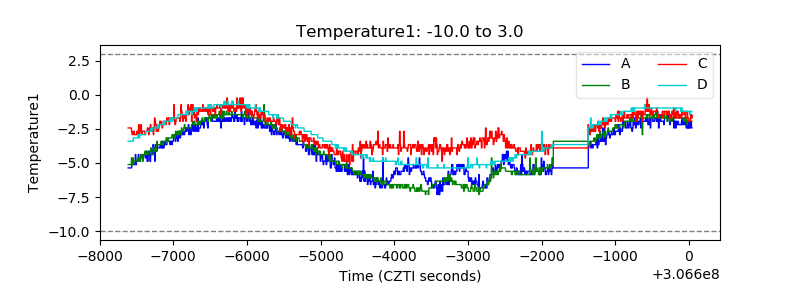 |
| Veto HV Monitor | 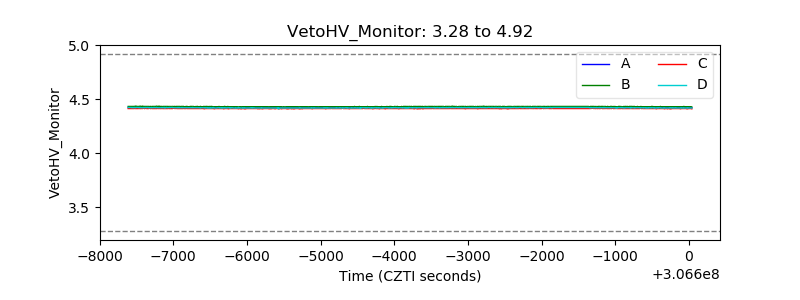 |
| Veto LLD | 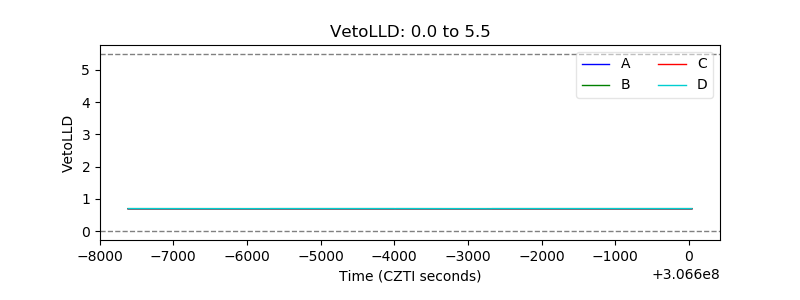 |
| Alpha Counter | 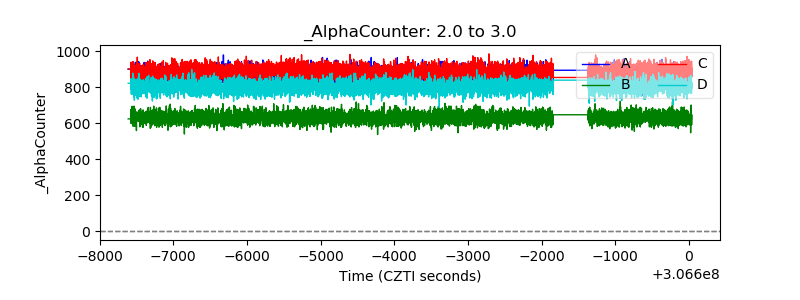 |
| _CPM_Rate | 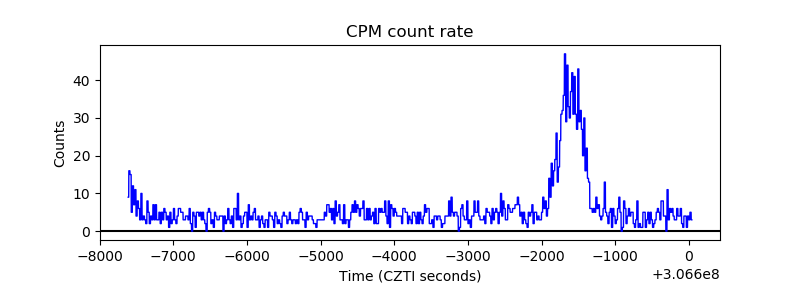 |
| CZT Counter | 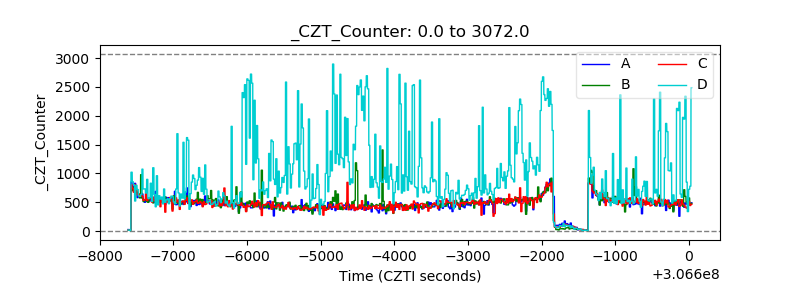 |
| +2.5 Volts monitor |  |
| +5 Volts monitor |  |
| _ROLL_ROT | 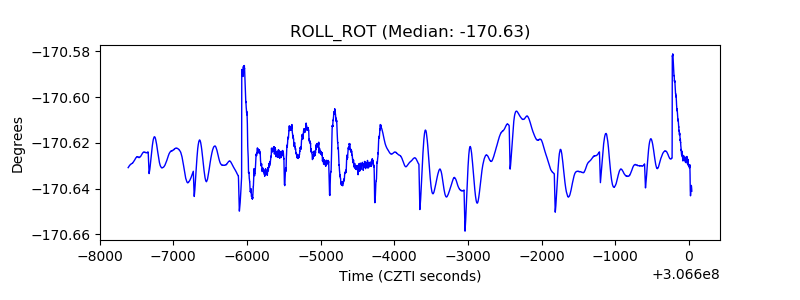 |
| _Roll_DEC | 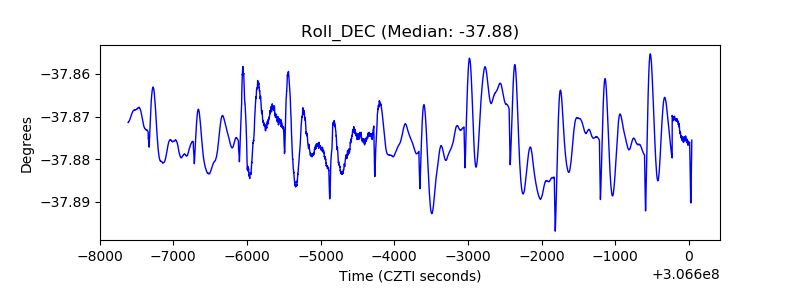 |
| _Roll_RA | 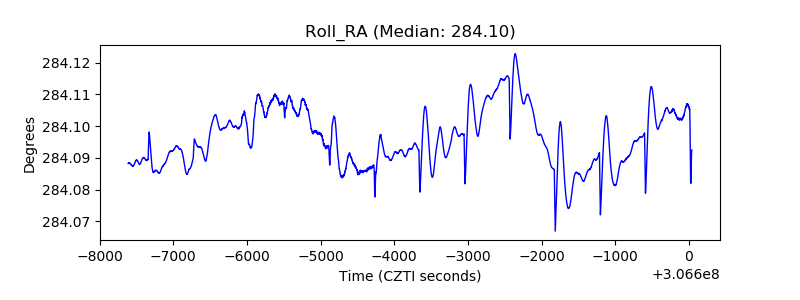 |
| Veto Counter | 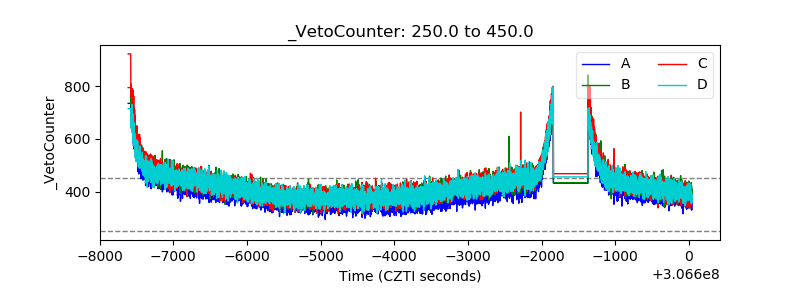 |