| Param | Original file | Final file |
|---|---|---|
| Filename | modeM0/AS1T03_141T01_9000003174_21503cztM0_level2.evt | modeM0/AS1T03_141T01_9000003174_21503cztM0_level2_quad_clean.evt |
| Size (bytes) | 1,316,940,480 | 242,985,600 |
| Size | 1.2 GB | 231.7 MB |
| Events in quadrant A | 8,500,581 | 1,545,292 |
| Events in quadrant B | 8,896,012 | 1,577,410 |
| Events in quadrant C | 8,623,632 | 1,526,552 |
| Events in quadrant D | 12,616,550 | 1,438,774 |
| Mode M9 | |||
|---|---|---|---|
| Quadrant | BADHDUFLAG | Total packets | Discarded packets |
| A | 0 | 23 | 0 |
| B | 0 | 23 | 0 |
| C | 0 | 23 | 0 |
| D | 0 | 23 | 0 |
| Mode M0 | |||
|---|---|---|---|
| Quadrant | BADHDUFLAG | Total packets | Discarded packets |
| A | 0 | 37612 | 0 |
| B | 0 | 38414 | 0 |
| C | 0 | 37680 | 0 |
| D | 0 | 50019 | 0 |
| Mode SS | |||
|---|---|---|---|
| Quadrant | BADHDUFLAG | Total packets | Discarded packets |
| A | 0 | 380 | 0 |
| B | 0 | 380 | 0 |
| C | 0 | 380 | 0 |
| D | 0 | 380 | 0 |
| Quadrant | Total seconds | Saturated seconds | Saturation percentage |
|---|---|---|---|
| A | 18437 | 68 | 0.368824% |
| B | 18437 | 116 | 0.629170% |
| C | 18437 | 118 | 0.640017% |
| D | 18437 | 928 | 5.033357% |
Noise dominated data is calculated using 1-second bins in cleaned event files. If a bin has >2000 counts, and if more than 50% of those come from <1% of pixels, then it is considered to be noise-dominated and hence unusable.
| Quadrant | # 1 sec bins | Bins with >0 counts | Bins with >2000 counts | High rate bins dominated by noise | Noise dominated (total time) | Noise dominated (detector-on time) | Marked lightcurve |
|---|---|---|---|---|---|---|---|
| A | 20822 | 18439 | 0 | 0 | 0.00% | 0.00% | 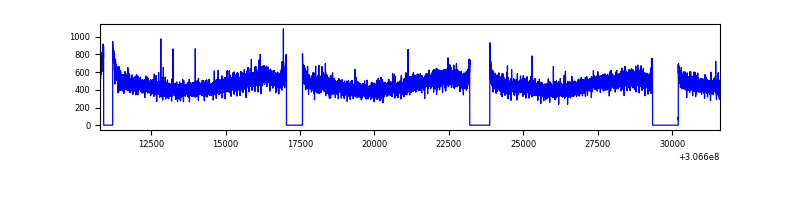 |
| B | 20822 | 18439 | 10 | 10 | 0.05% | 0.05% | 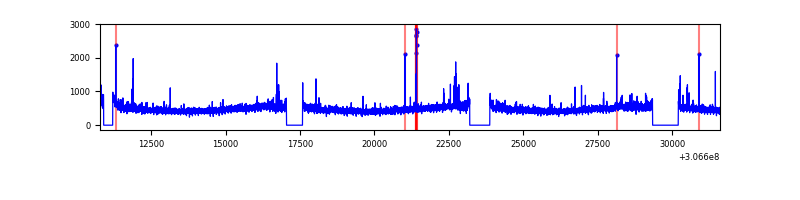 |
| C | 20822 | 18440 | 0 | 0 | 0.00% | 0.00% | 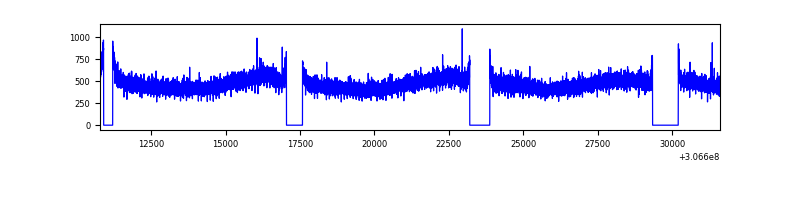 |
| D | 20822 | 18440 | 743 | 743 | 3.57% | 4.03% | 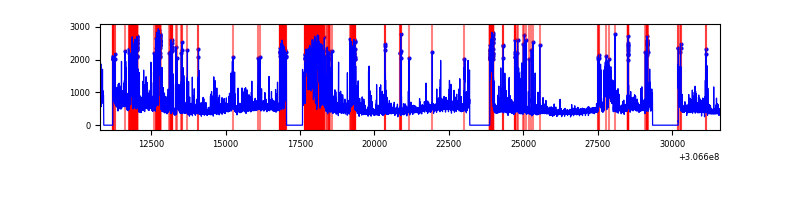 |
Top three noisy pixels from each quadrant. If the there are fewer than three noisy pixels in the level2.evt file, extra rows are filled as -1
| Pixel properties | Quadrant properties | ||||||
|---|---|---|---|---|---|---|---|
| Quadrant | DetID | PixID | Counts | Sigma | Mean | Median | Sigma |
| A | 13 | 254 | 30265 | 63.49 | 2203 | 2156 | 442.7 |
| A | 0 | 226 | 18966 | 37.97 | 2203 | 2156 | 442.7 |
| A | 3 | 137 | 18896 | 37.81 | 2203 | 2156 | 442.7 |
| B | 0 | 230 | 83497 | 194.46 | 2206 | 2149 | 418.3 |
| B | 0 | 190 | 72937 | 169.22 | 2206 | 2149 | 418.3 |
| B | 12 | 111 | 51100 | 117.02 | 2206 | 2149 | 418.3 |
| C | 14 | 238 | 333340 | 670.81 | 2117 | 2129 | 493.7 |
| C | 13 | 61 | 14890 | 25.85 | 2117 | 2129 | 493.7 |
| C | 8 | 128 | 14242 | 24.53 | 2117 | 2129 | 493.7 |
| D | 1 | 52 | 1646582 | 2988.93 | 2077 | 2038 | 550.2 |
| D | 14 | 35 | 717298 | 1299.97 | 2077 | 2038 | 550.2 |
| D | 5 | 222 | 683247 | 1238.08 | 2077 | 2038 | 550.2 |
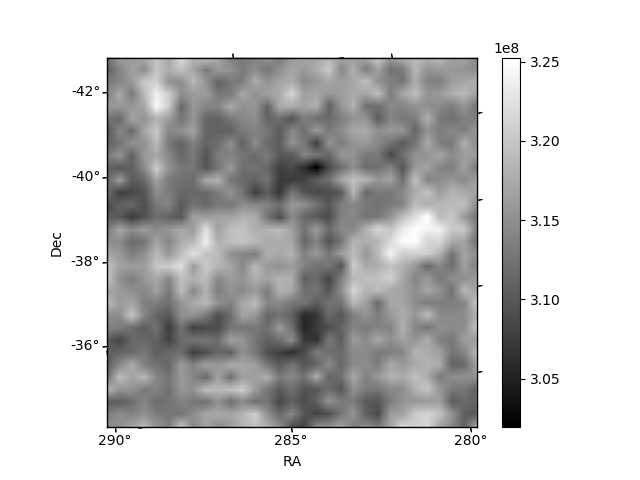
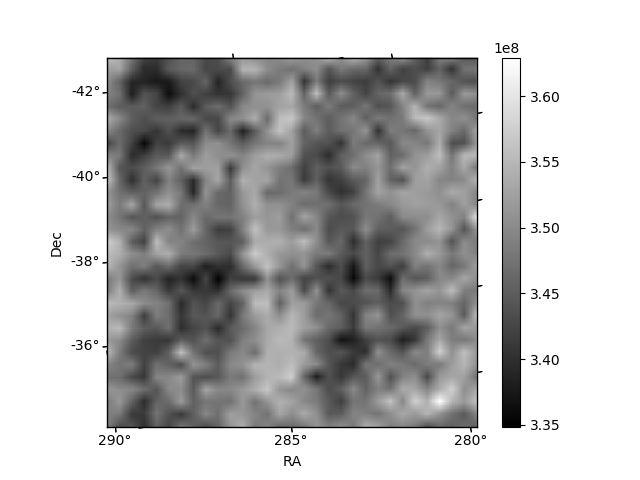
Histogram calculated using DETX and DETY for each event in the final _common_clean file
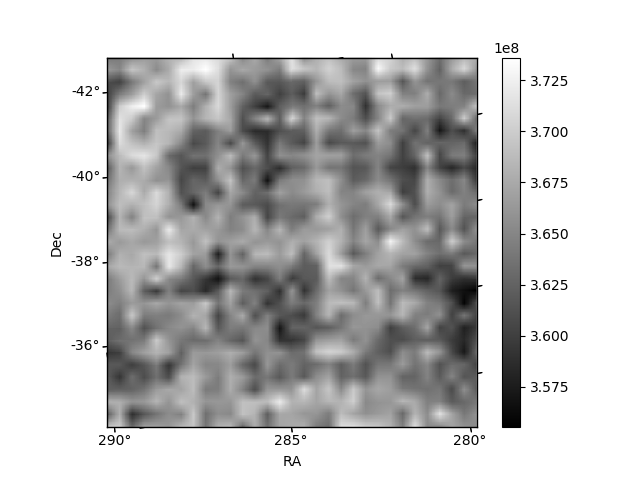
| Quadrant A | 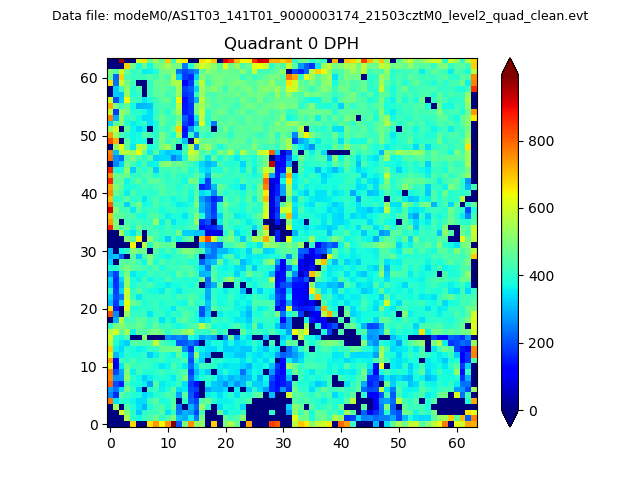 |
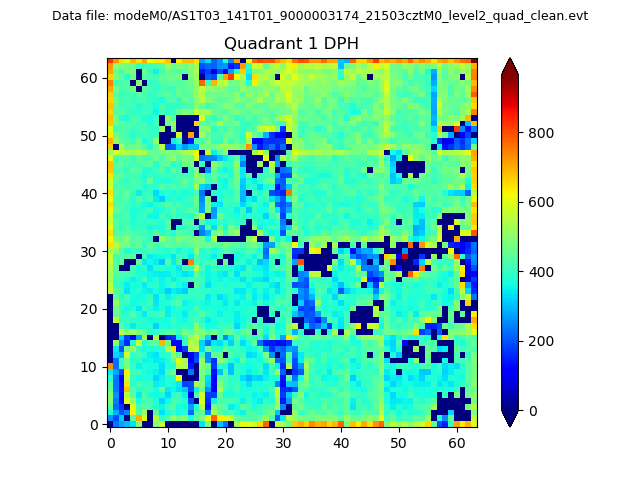 |
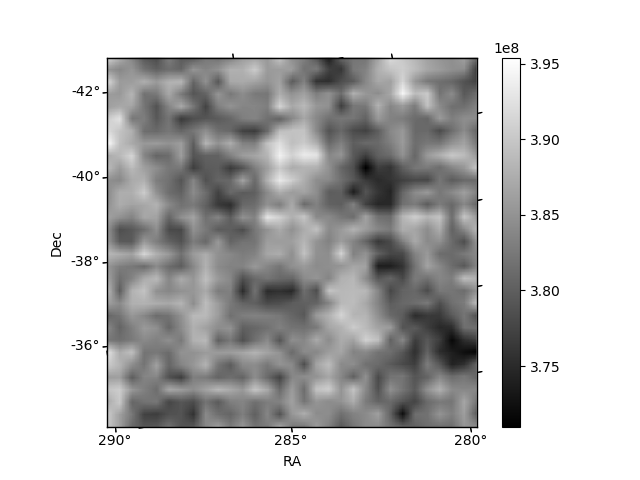
Quadrant B |
|---|---|---|---|
| Quadrant D |  |
 |
Quadrant C |
| Plot type | Count rate plots | Images |
|---|---|---|
| Comparison with Poisson distribution Blue bars denote a histogram of data divided into 1 sec bins. Red curve is a Poisson curve with rate = median count rate of data. |
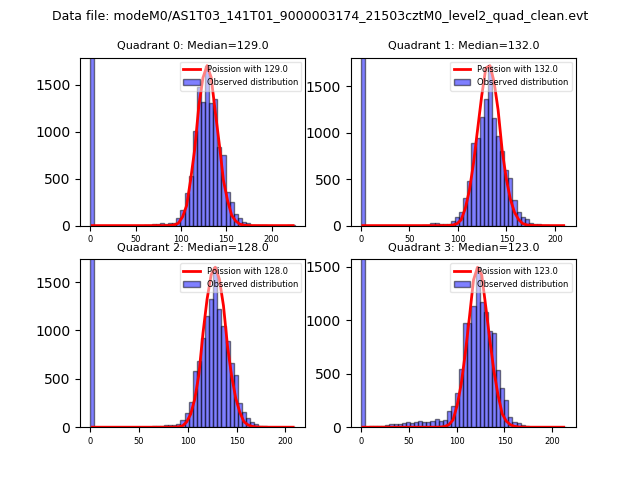 |
 |
| Quadrant-wise count rates Data is divided into 100 sec bins |
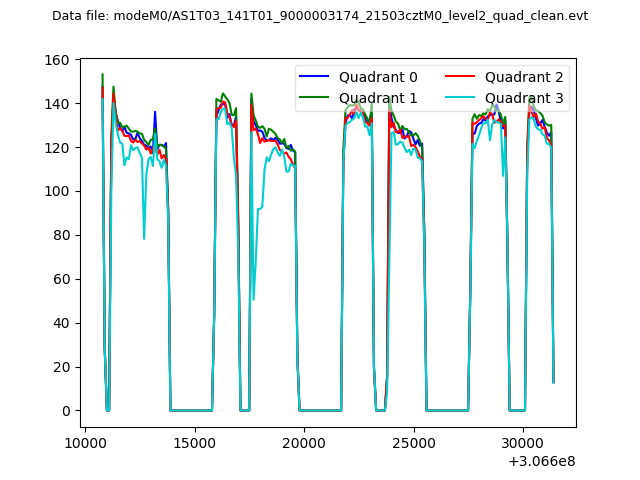 |
|
| Module-wise count rates for Quadrant A Data is divided into 100 sec bins |
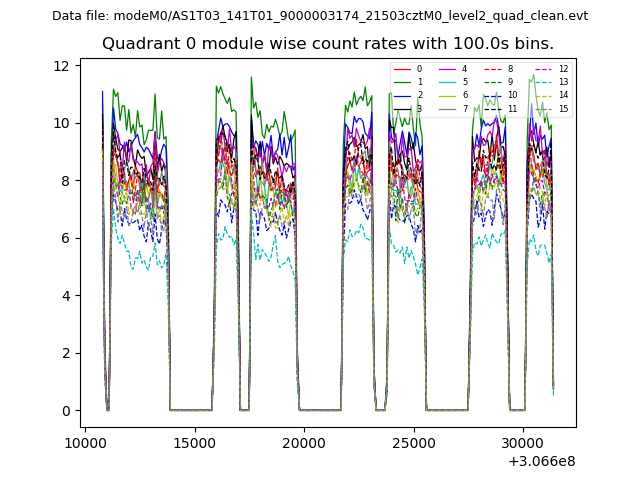 |
 |
| Module-wise count rates for Quadrant B Data is divided into 100 sec bins |
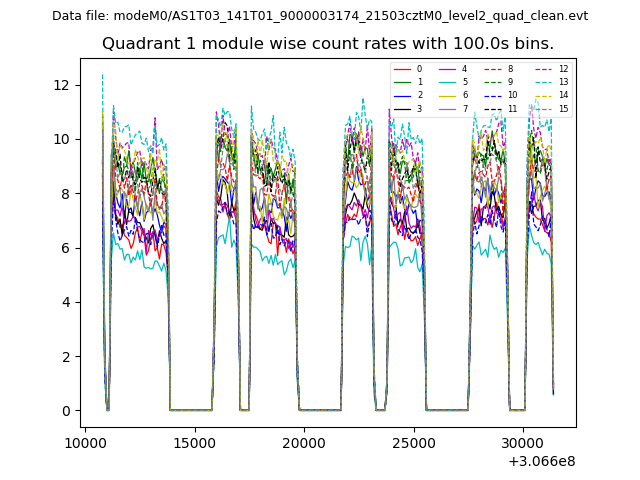 |
 |
| Module-wise count rates for Quadrant C Data is divided into 100 sec bins |
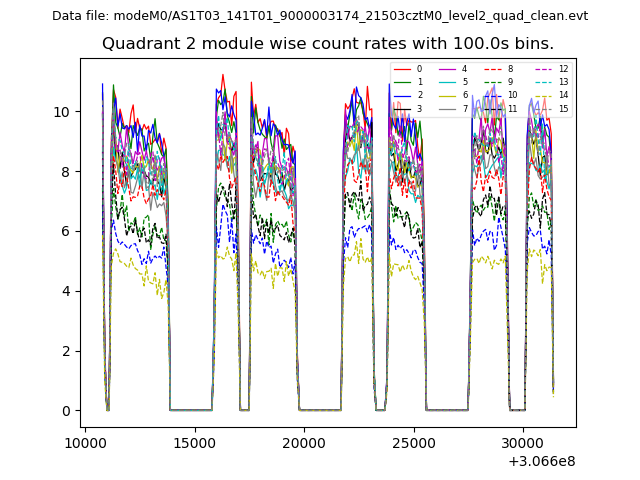 |
 |
| Module-wise count rates for Quadrant D Data is divided into 100 sec bins |
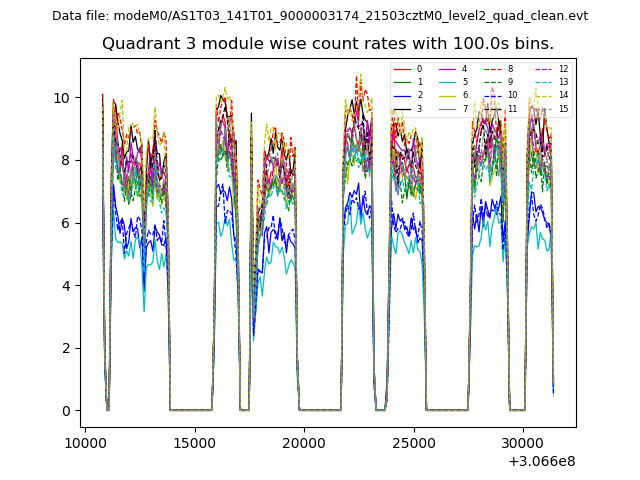 |
 |
| Parameter | Plot |
|---|---|
| CZT HV Monitor | 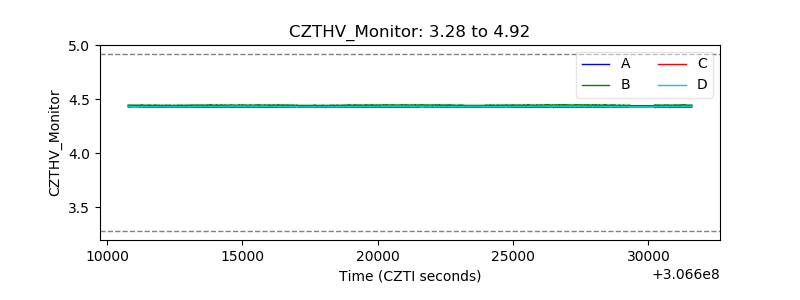 |
| D_VDD | 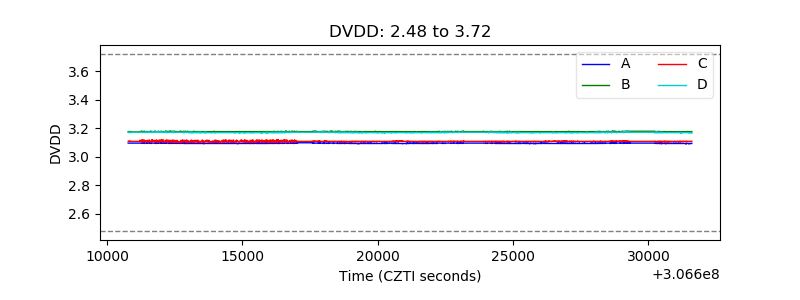 |
| Temperature 1 | 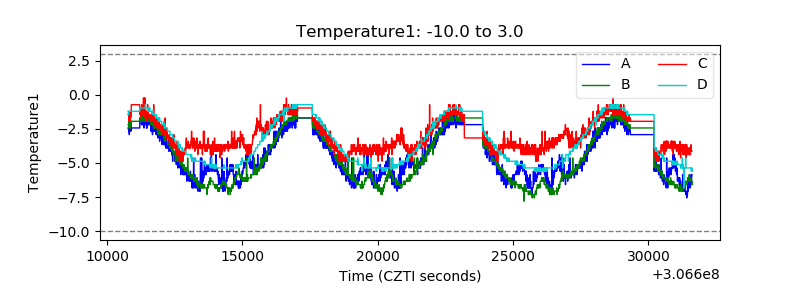 |
| Veto HV Monitor | 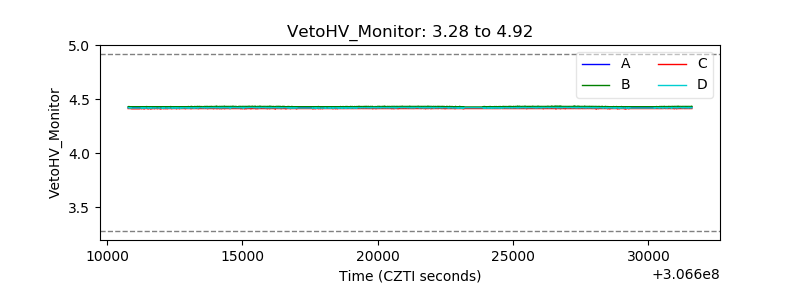 |
| Veto LLD | 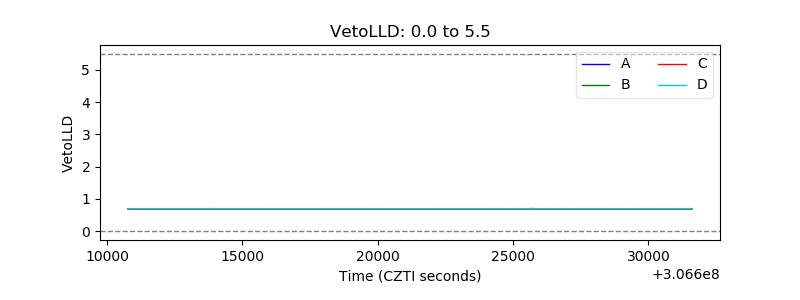 |
| Alpha Counter | 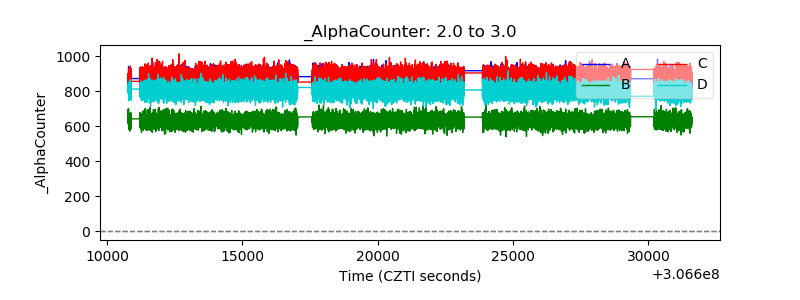 |
| _CPM_Rate | 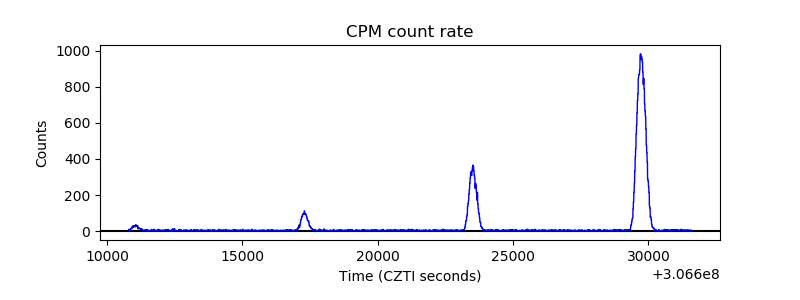 |
| CZT Counter |  |
| +2.5 Volts monitor |  |
| +5 Volts monitor | 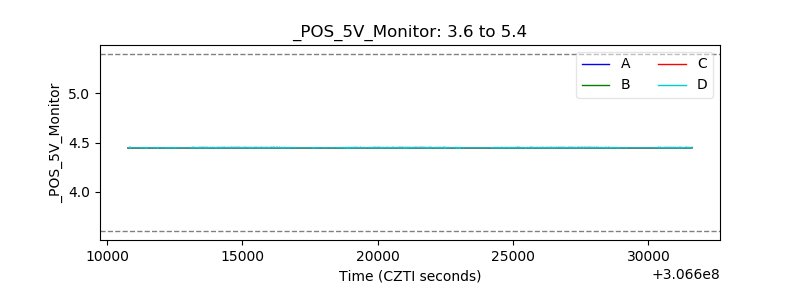 |
| _ROLL_ROT | 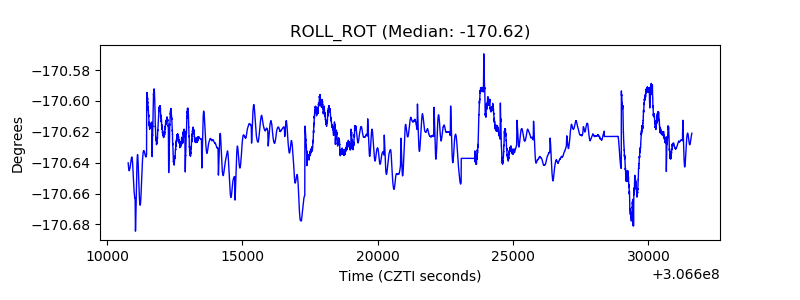 |
| _Roll_DEC | 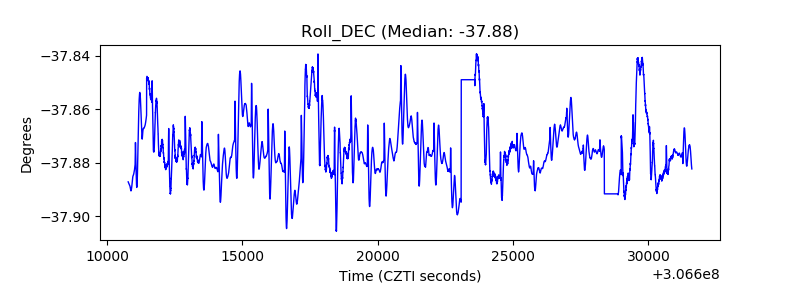 |
| _Roll_RA |  |
| Veto Counter | 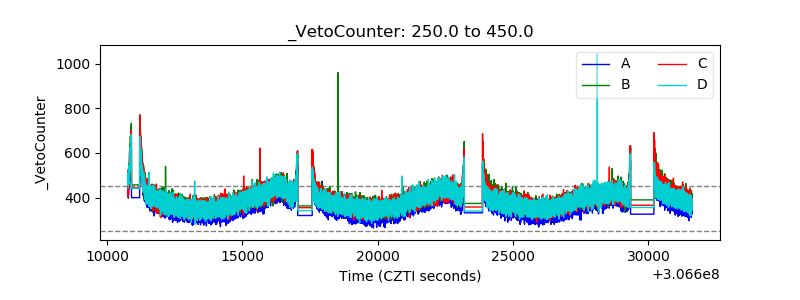 |