| Param | Original file | Final file |
|---|---|---|
| Filename | modeM0/AS1T03_141T01_9000003174_21507cztM0_level2.evt | modeM0/AS1T03_141T01_9000003174_21507cztM0_level2_quad_clean.evt |
| Size (bytes) | 484,323,840 | 69,724,800 |
| Size | 461.9 MB | 66.5 MB |
| Events in quadrant A | 3,285,065 | 419,025 |
| Events in quadrant B | 3,611,326 | 428,033 |
| Events in quadrant C | 3,399,789 | 418,777 |
| Events in quadrant D | 3,941,392 | 402,762 |
| Mode M9 | |||
|---|---|---|---|
| Quadrant | BADHDUFLAG | Total packets | Discarded packets |
| A | 0 | 15 | 0 |
| B | 0 | 16 | 0 |
| C | 0 | 16 | 0 |
| D | 0 | 16 | 0 |
| Mode M0 | |||
|---|---|---|---|
| Quadrant | BADHDUFLAG | Total packets | Discarded packets |
| A | 0 | 13539 | 0 |
| B | 0 | 14629 | 0 |
| C | 0 | 13969 | 0 |
| D | 0 | 15844 | 0 |
| Mode SS | |||
|---|---|---|---|
| Quadrant | BADHDUFLAG | Total packets | Discarded packets |
| A | 0 | 128 | 0 |
| B | 0 | 128 | 0 |
| C | 0 | 128 | 0 |
| D | 0 | 128 | 0 |
| Quadrant | Total seconds | Saturated seconds | Saturation percentage |
|---|---|---|---|
| A | 6344 | 55 | 0.866961% |
| B | 6344 | 100 | 1.576293% |
| C | 6344 | 92 | 1.450189% |
| D | 6344 | 94 | 1.481715% |
Noise dominated data is calculated using 1-second bins in cleaned event files. If a bin has >2000 counts, and if more than 50% of those come from <1% of pixels, then it is considered to be noise-dominated and hence unusable.
| Quadrant | # 1 sec bins | Bins with >0 counts | Bins with >2000 counts | High rate bins dominated by noise | Noise dominated (total time) | Noise dominated (detector-on time) | Marked lightcurve |
|---|---|---|---|---|---|---|---|
| A | 7569 | 6345 | 0 | 0 | 0.00% | 0.00% | 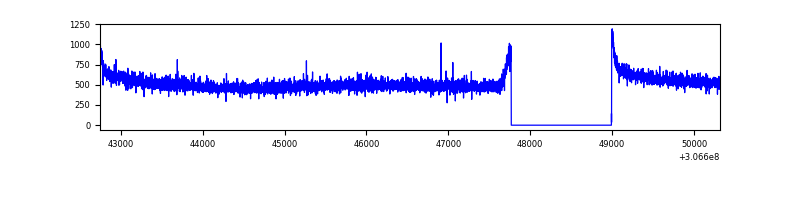 |
| B | 7569 | 6345 | 19 | 19 | 0.25% | 0.30% | 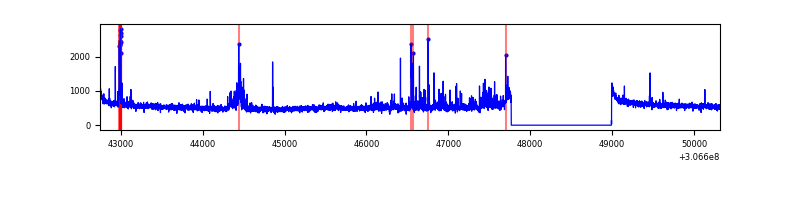 |
| C | 7569 | 6345 | 0 | 0 | 0.00% | 0.00% | 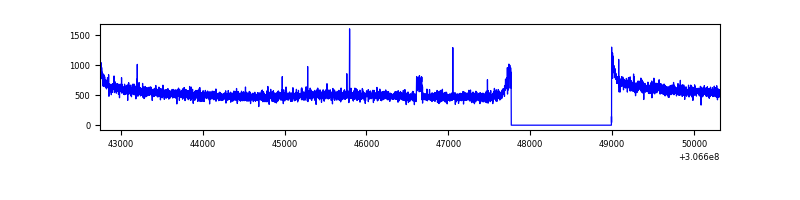 |
| D | 7569 | 6345 | 23 | 23 | 0.30% | 0.36% | 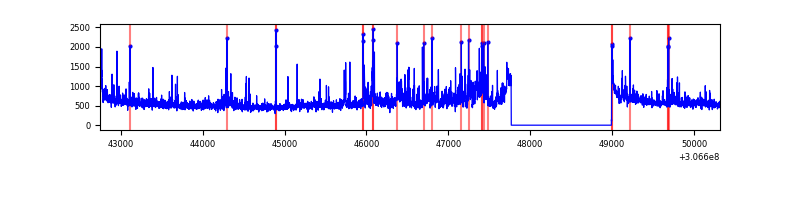 |
Top three noisy pixels from each quadrant. If the there are fewer than three noisy pixels in the level2.evt file, extra rows are filled as -1
| Pixel properties | Quadrant properties | ||||||
|---|---|---|---|---|---|---|---|
| Quadrant | DetID | PixID | Counts | Sigma | Mean | Median | Sigma |
| A | 13 | 254 | 11219 | 61.2 | 851 | 836 | 169.6 |
| A | 0 | 226 | 7300 | 38.1 | 851 | 836 | 169.6 |
| A | 3 | 137 | 6485 | 33.3 | 851 | 836 | 169.6 |
| B | 3 | 64 | 112368 | 705.57 | 854 | 836 | 158.1 |
| B | 0 | 230 | 74397 | 465.36 | 854 | 836 | 158.1 |
| B | 0 | 189 | 33563 | 207.04 | 854 | 836 | 158.1 |
| C | 14 | 238 | 134385 | 695.55 | 831 | 840 | 192.0 |
| C | 0 | 239 | 21155 | 105.81 | 831 | 840 | 192.0 |
| C | 3 | 233 | 6029 | 27.03 | 831 | 840 | 192.0 |
| D | 14 | 35 | 283223 | 1416.19 | 833 | 812 | 199.4 |
| D | 1 | 52 | 251814 | 1258.68 | 833 | 812 | 199.4 |
| D | 13 | 174 | 94501 | 469.82 | 833 | 812 | 199.4 |
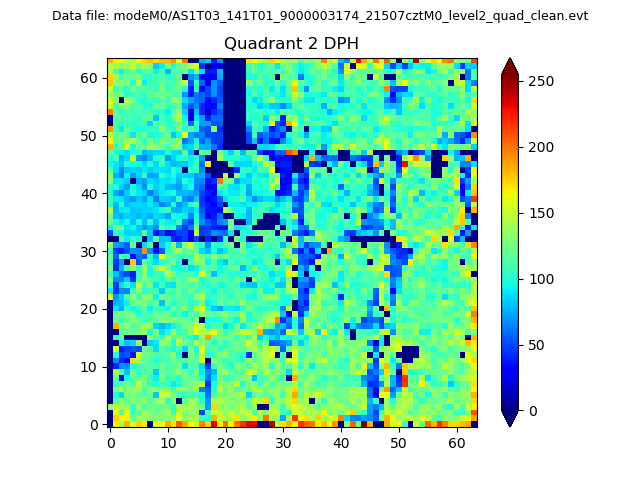
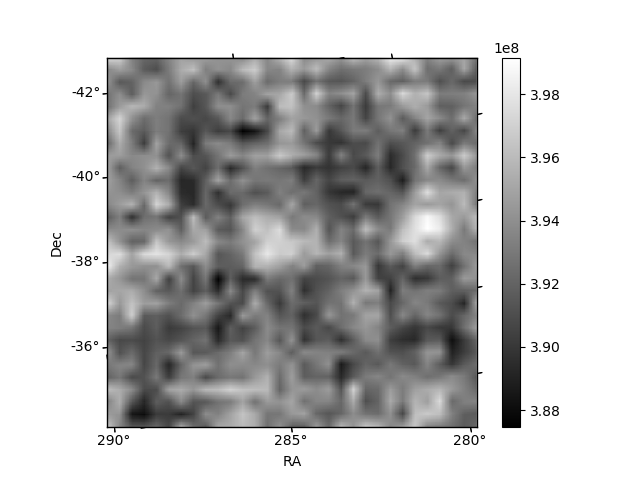
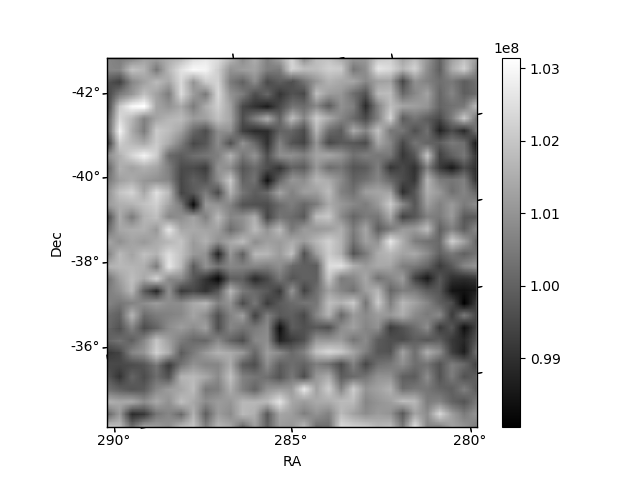
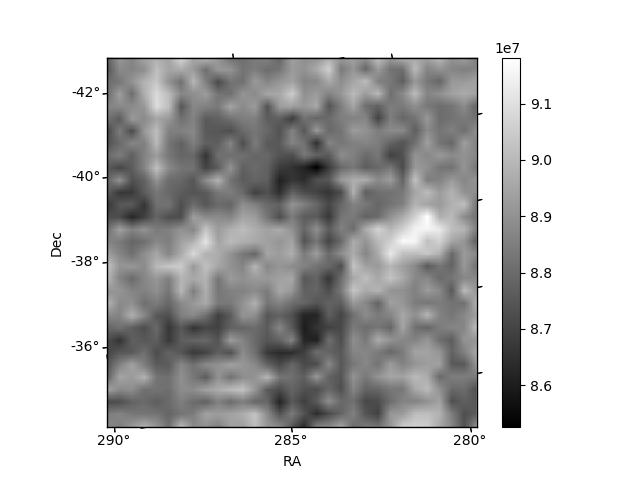
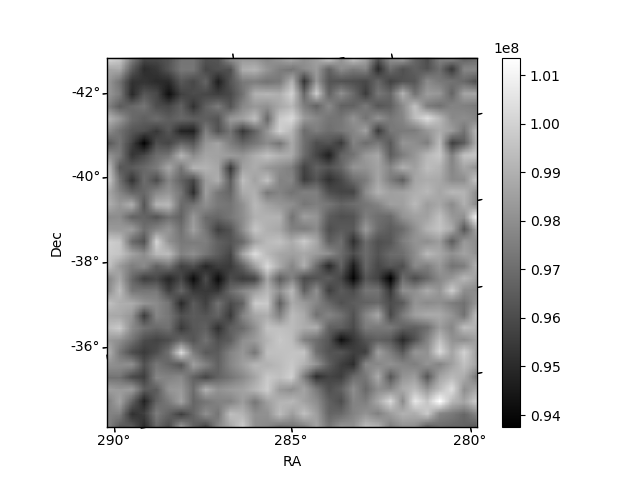
Histogram calculated using DETX and DETY for each event in the final _common_clean file
| Quadrant A | 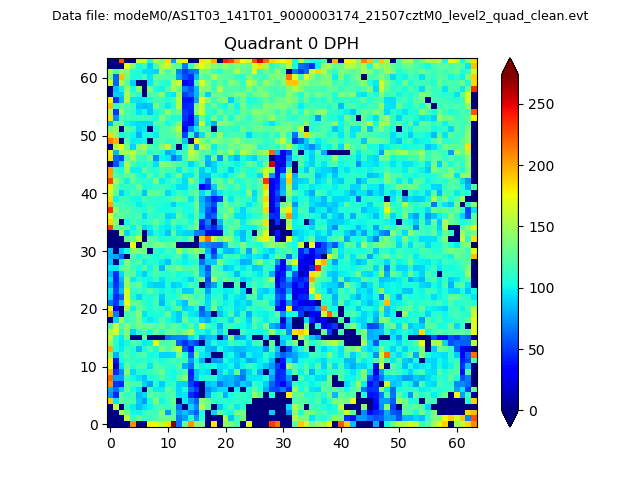 |
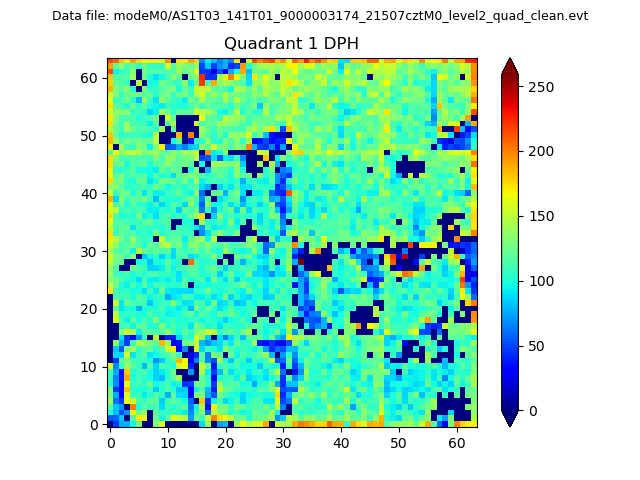 |
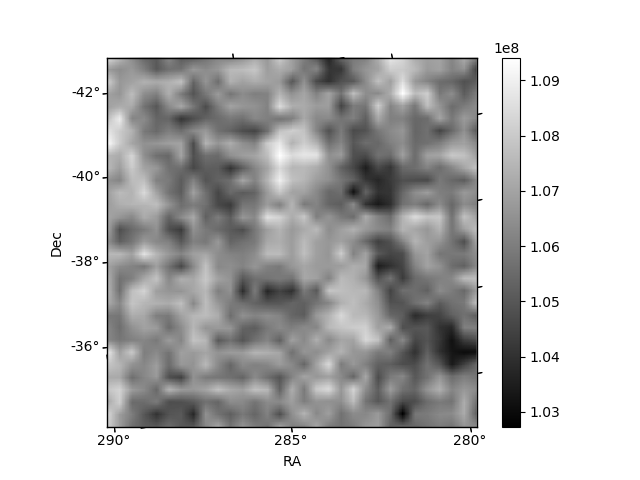
Quadrant B |
|---|---|---|---|
| Quadrant D | 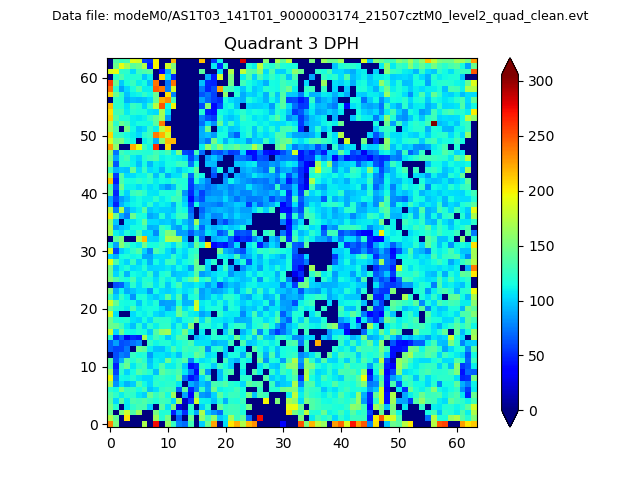 |
 |
Quadrant C |
| Plot type | Count rate plots | Images |
|---|---|---|
| Comparison with Poisson distribution Blue bars denote a histogram of data divided into 1 sec bins. Red curve is a Poisson curve with rate = median count rate of data. |
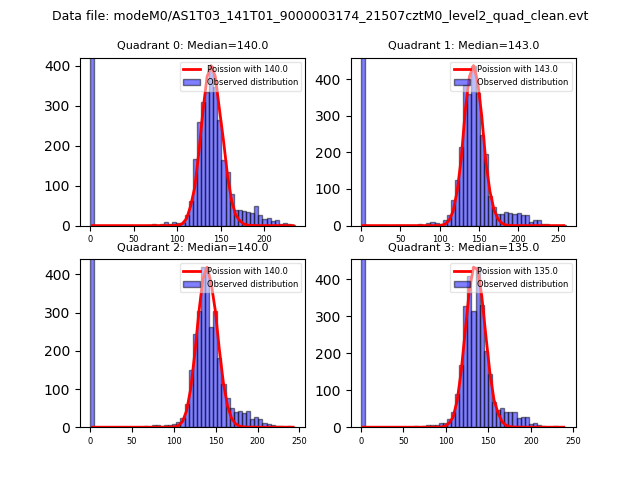 |
 |
| Quadrant-wise count rates Data is divided into 100 sec bins |
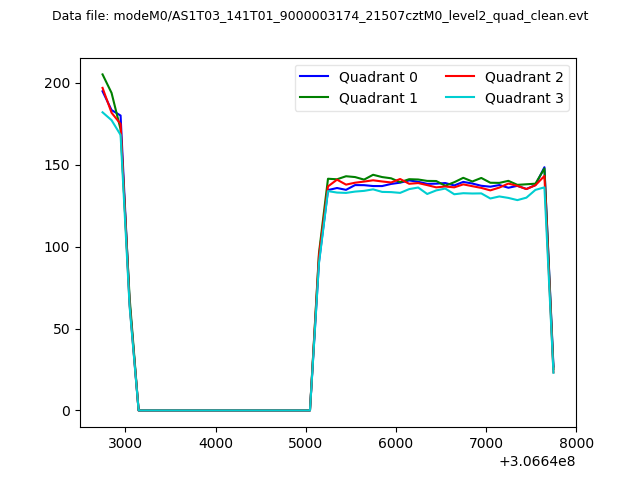 |
|
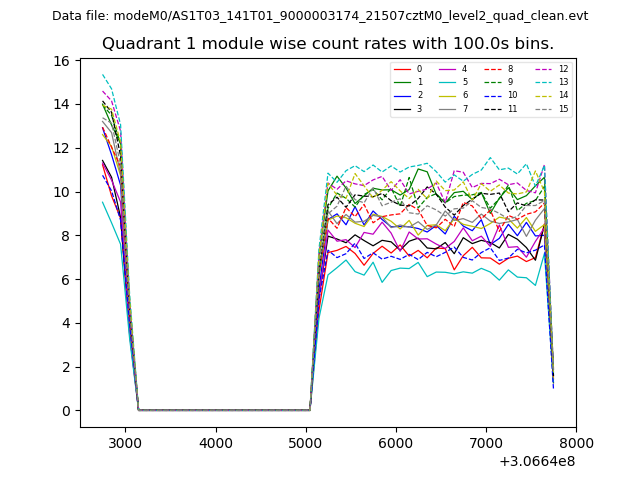
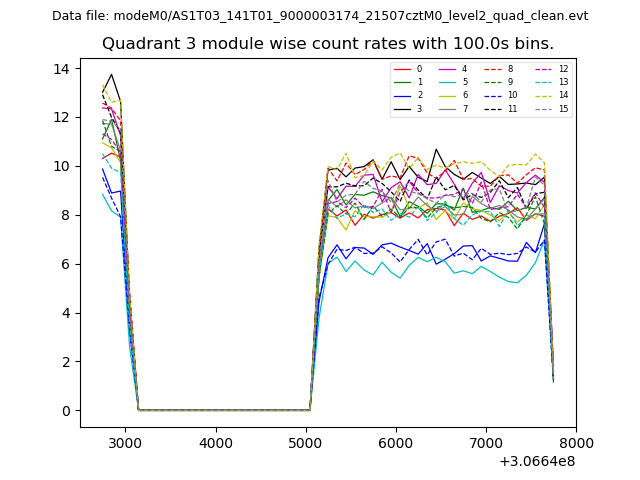
| Module-wise count rates for Quadrant A Data is divided into 100 sec bins |
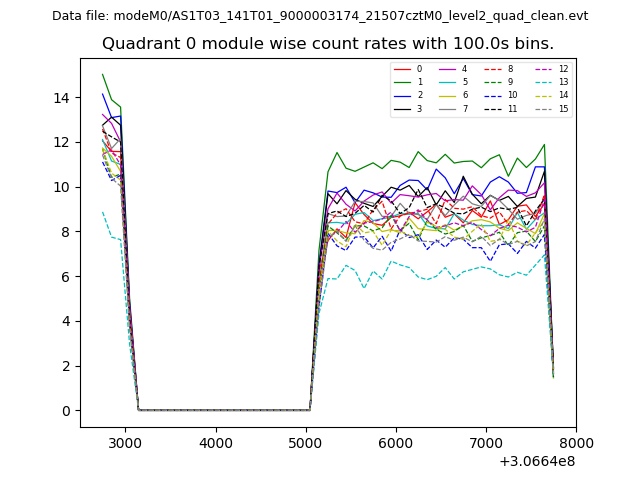 |
 |
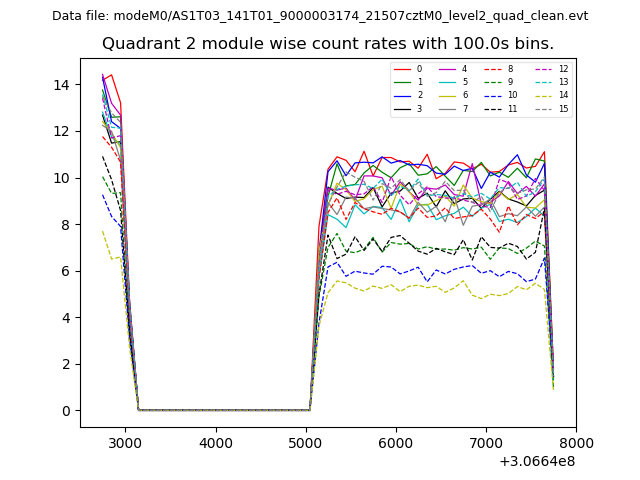
| Module-wise count rates for Quadrant B Data is divided into 100 sec bins |
 |
 |
| Module-wise count rates for Quadrant C Data is divided into 100 sec bins |
 |
 |
| Module-wise count rates for Quadrant D Data is divided into 100 sec bins |
 |
 |
| Parameter | Plot |
|---|---|
| CZT HV Monitor | 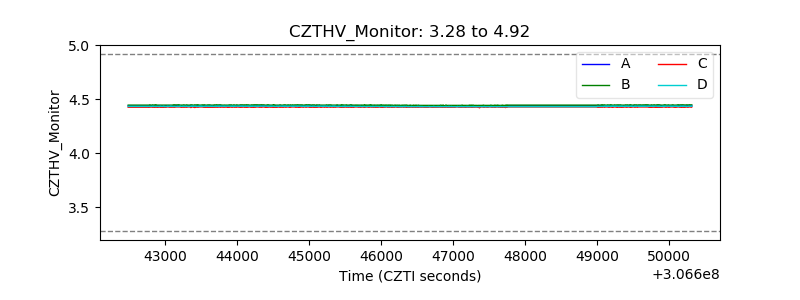 |
| D_VDD | 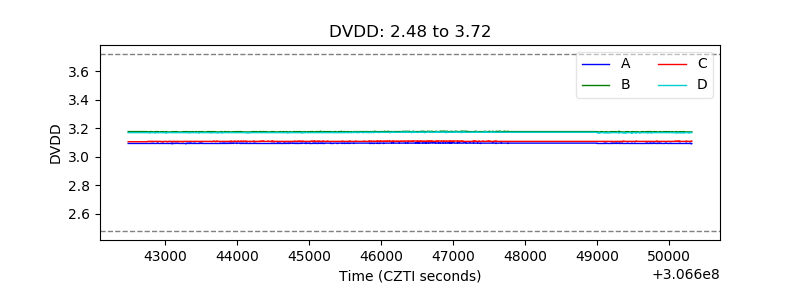 |
| Temperature 1 | 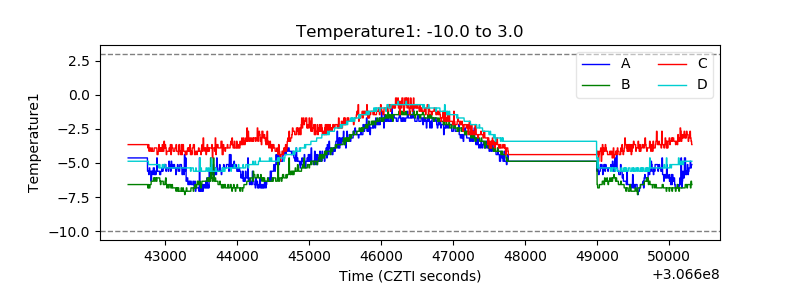 |
| Veto HV Monitor | 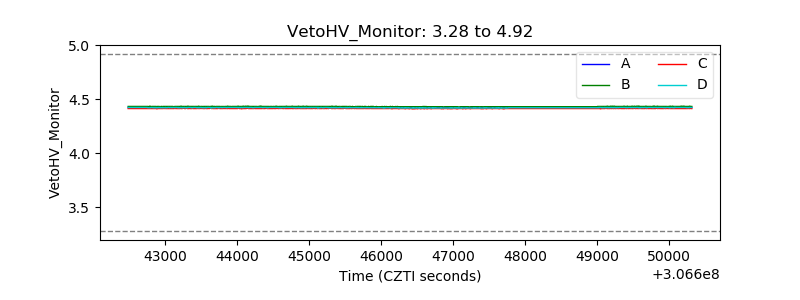 |
| Veto LLD | 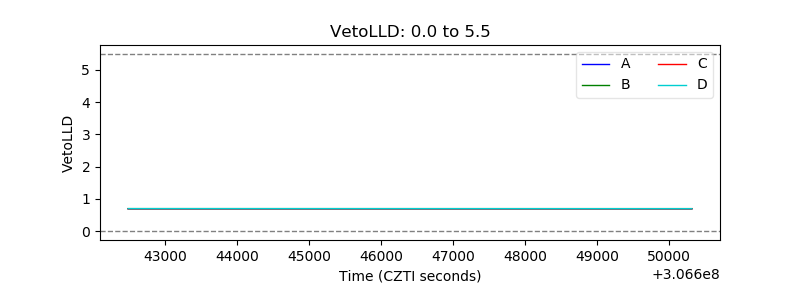 |
| Alpha Counter | 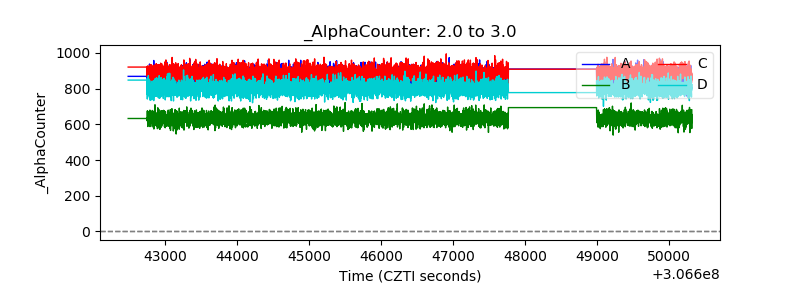 |
| _CPM_Rate | 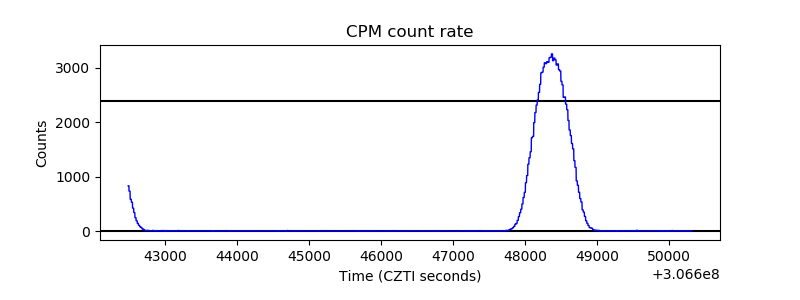 |
| CZT Counter |  |
| +2.5 Volts monitor |  |
| +5 Volts monitor | 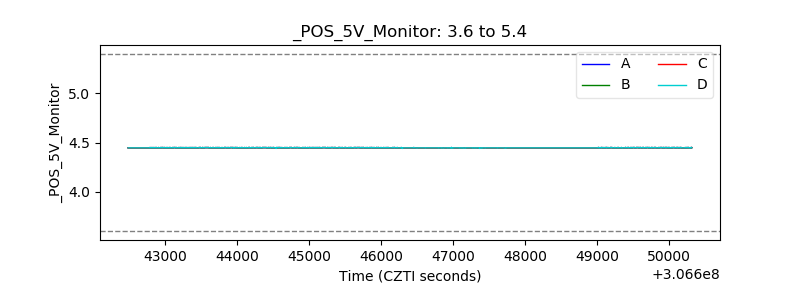 |
| _ROLL_ROT | 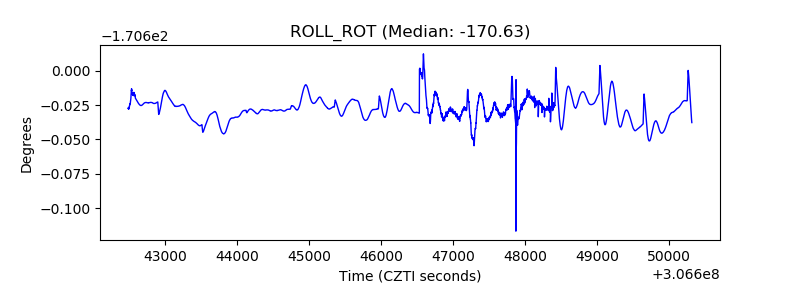 |
| _Roll_DEC | 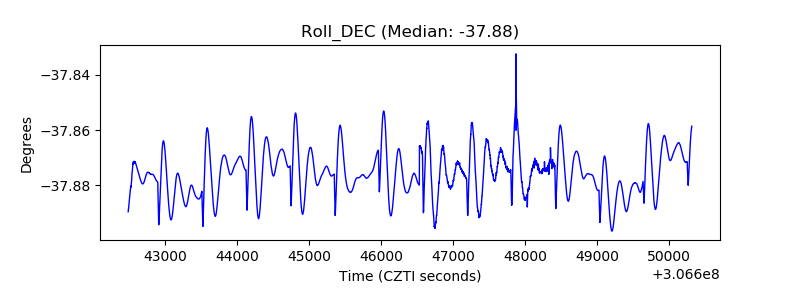 |
| _Roll_RA |  |
| Veto Counter | 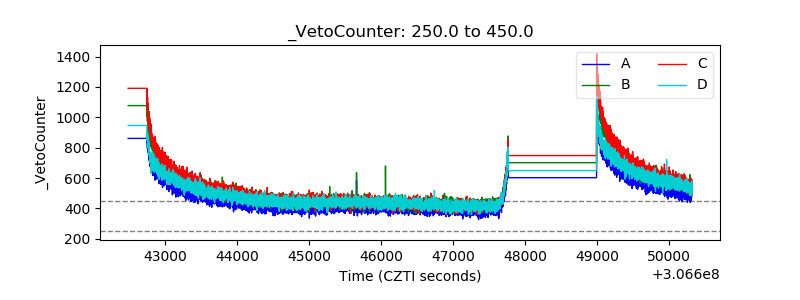 |