| Param | Original file | Final file |
|---|---|---|
| Filename | modeM0/AS1T03_141T01_9000003174_21509cztM0_level2.evt | modeM0/AS1T03_141T01_9000003174_21509cztM0_level2_quad_clean.evt |
| Size (bytes) | 507,732,480 | 81,619,200 |
| Size | 484.2 MB | 77.8 MB |
| Events in quadrant A | 3,460,185 | 509,922 |
| Events in quadrant B | 3,605,508 | 523,711 |
| Events in quadrant C | 3,535,443 | 509,445 |
| Events in quadrant D | 4,353,131 | 493,539 |
| Mode M9 | |||
|---|---|---|---|
| Quadrant | BADHDUFLAG | Total packets | Discarded packets |
| A | 0 | 22 | 0 |
| B | 0 | 23 | 0 |
| C | 0 | 23 | 0 |
| D | 0 | 23 | 0 |
| Mode M0 | |||
|---|---|---|---|
| Quadrant | BADHDUFLAG | Total packets | Discarded packets |
| A | 0 | 14072 | 0 |
| B | 0 | 14586 | 0 |
| C | 0 | 14433 | 0 |
| D | 0 | 17033 | 0 |
| Mode SS | |||
|---|---|---|---|
| Quadrant | BADHDUFLAG | Total packets | Discarded packets |
| A | 0 | 126 | 0 |
| B | 0 | 126 | 0 |
| C | 0 | 126 | 0 |
| D | 0 | 126 | 0 |
| Quadrant | Total seconds | Saturated seconds | Saturation percentage |
|---|---|---|---|
| A | 6235 | 81 | 1.299118% |
| B | 6235 | 117 | 1.876504% |
| C | 6235 | 170 | 2.726544% |
| D | 6234 | 153 | 2.454283% |
Noise dominated data is calculated using 1-second bins in cleaned event files. If a bin has >2000 counts, and if more than 50% of those come from <1% of pixels, then it is considered to be noise-dominated and hence unusable.
| Quadrant | # 1 sec bins | Bins with >0 counts | Bins with >2000 counts | High rate bins dominated by noise | Noise dominated (total time) | Noise dominated (detector-on time) | Marked lightcurve |
|---|---|---|---|---|---|---|---|
| A | 7590 | 6236 | 0 | 0 | 0.00% | 0.00% | 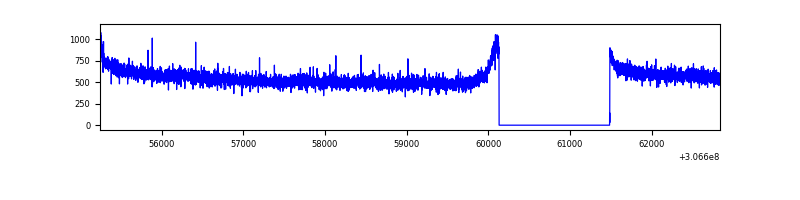 |
| B | 7590 | 6236 | 3 | 3 | 0.04% | 0.05% | 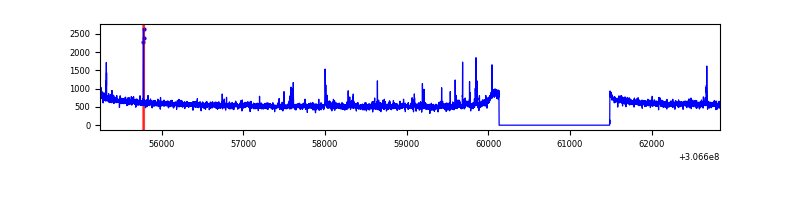 |
| C | 7590 | 6236 | 0 | 0 | 0.00% | 0.00% | 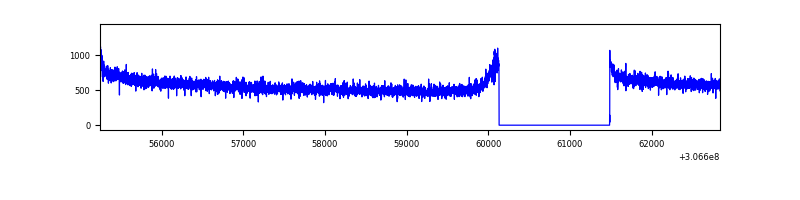 |
| D | 7589 | 6235 | 38 | 38 | 0.50% | 0.61% | 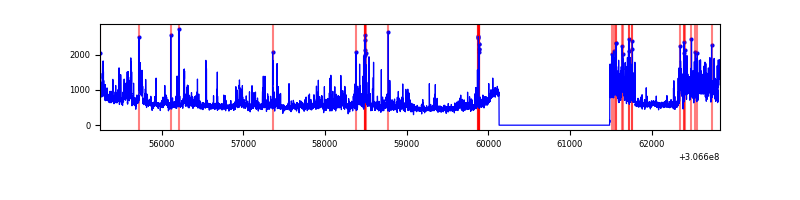 |
Top three noisy pixels from each quadrant. If the there are fewer than three noisy pixels in the level2.evt file, extra rows are filled as -1
| Pixel properties | Quadrant properties | ||||||
|---|---|---|---|---|---|---|---|
| Quadrant | DetID | PixID | Counts | Sigma | Mean | Median | Sigma |
| A | 13 | 254 | 10563 | 54.57 | 898 | 886 | 177.3 |
| A | 0 | 226 | 7719 | 38.53 | 898 | 886 | 177.3 |
| A | 3 | 137 | 6552 | 31.95 | 898 | 886 | 177.3 |
| B | 0 | 230 | 47952 | 289.48 | 892 | 874 | 162.6 |
| B | 3 | 64 | 22885 | 135.35 | 892 | 874 | 162.6 |
| B | 12 | 111 | 18742 | 109.87 | 892 | 874 | 162.6 |
| C | 14 | 238 | 139944 | 704.8 | 867 | 877 | 197.3 |
| C | 3 | 233 | 8767 | 39.99 | 867 | 877 | 197.3 |
| C | 13 | 61 | 6165 | 26.8 | 867 | 877 | 197.3 |
| D | 13 | 174 | 499752 | 2377.83 | 878 | 855 | 209.8 |
| D | 14 | 35 | 237457 | 1127.69 | 878 | 855 | 209.8 |
| D | 10 | 199 | 188083 | 892.36 | 878 | 855 | 209.8 |
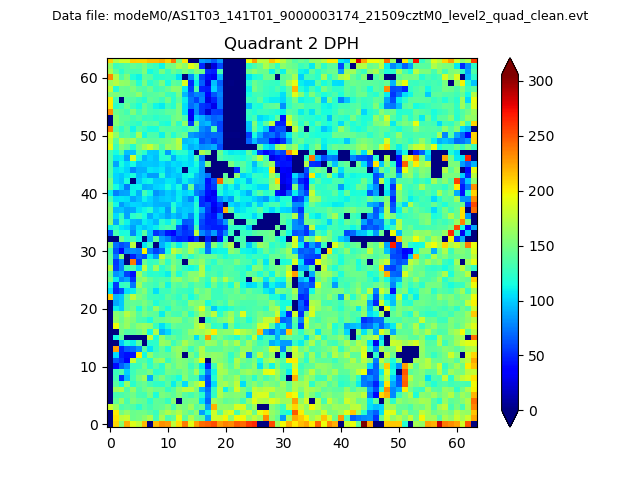
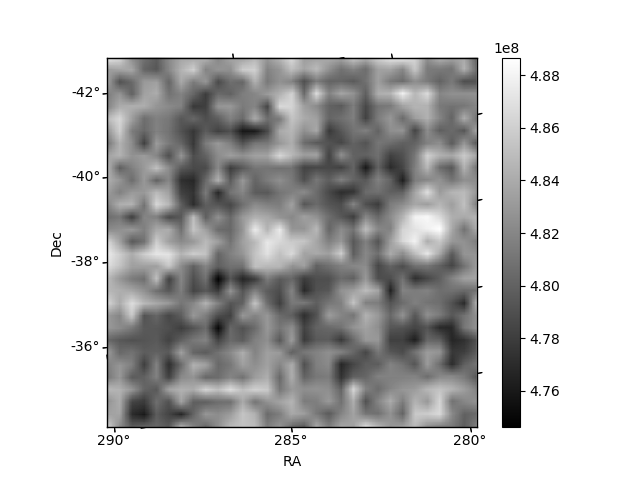
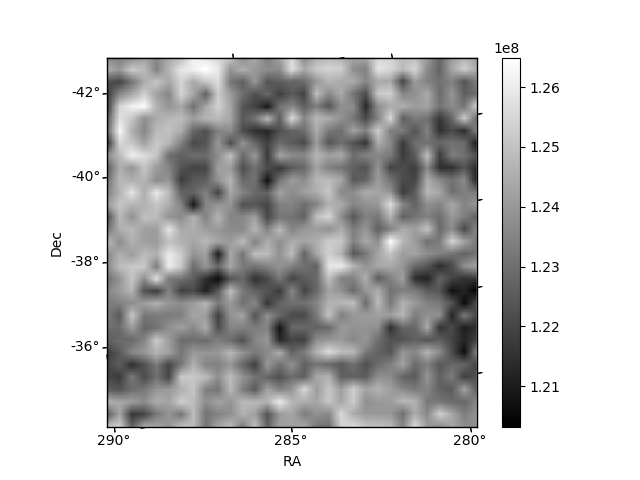
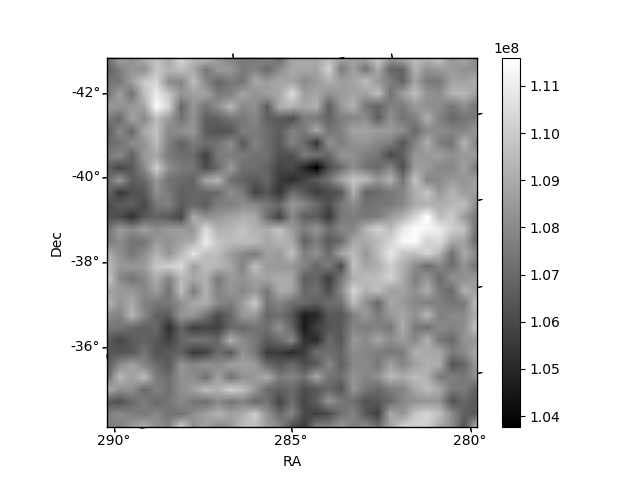
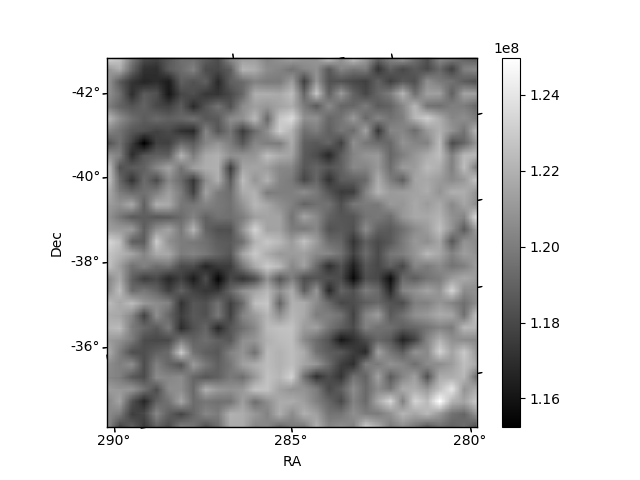
Histogram calculated using DETX and DETY for each event in the final _common_clean file
| Quadrant A | 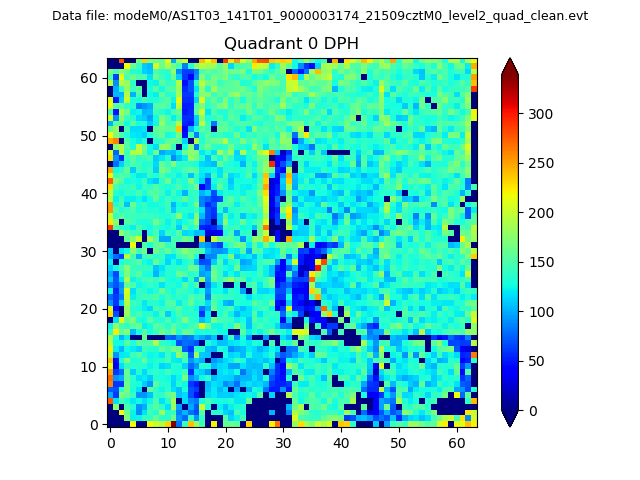 |
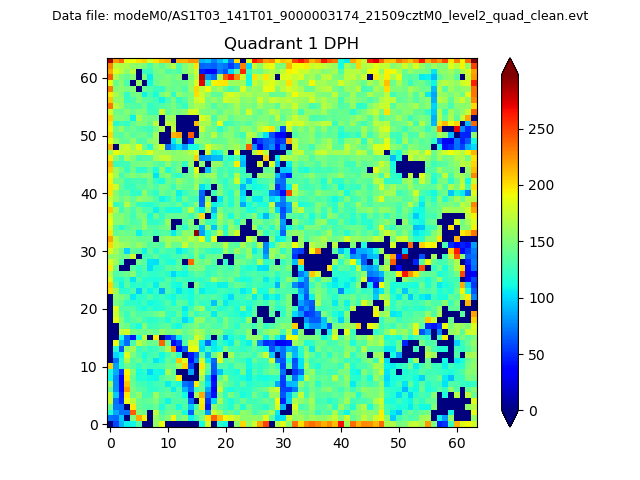 |
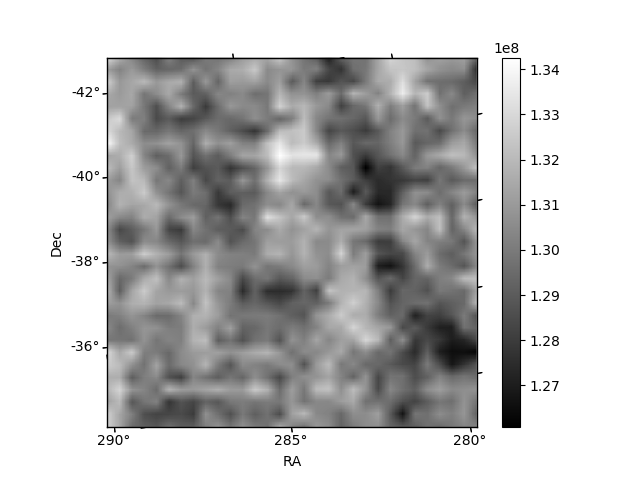
Quadrant B |
|---|---|---|---|
| Quadrant D | 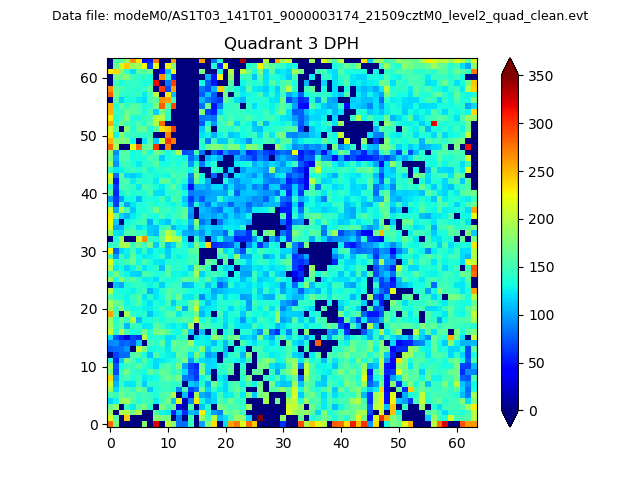 |
 |
Quadrant C |
| Plot type | Count rate plots | Images |
|---|---|---|
| Comparison with Poisson distribution Blue bars denote a histogram of data divided into 1 sec bins. Red curve is a Poisson curve with rate = median count rate of data. |
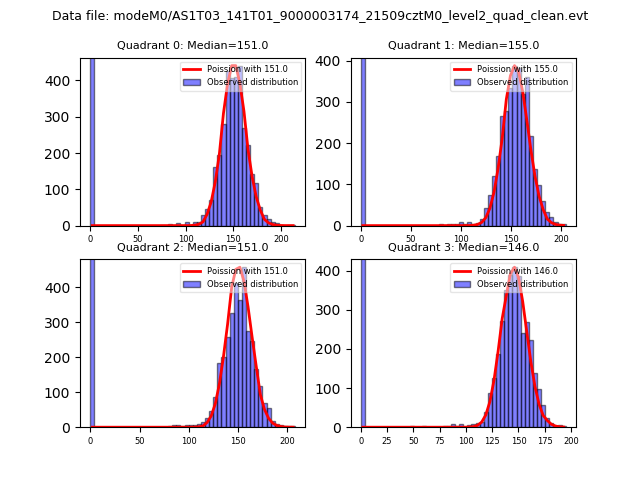 |
 |
| Quadrant-wise count rates Data is divided into 100 sec bins |
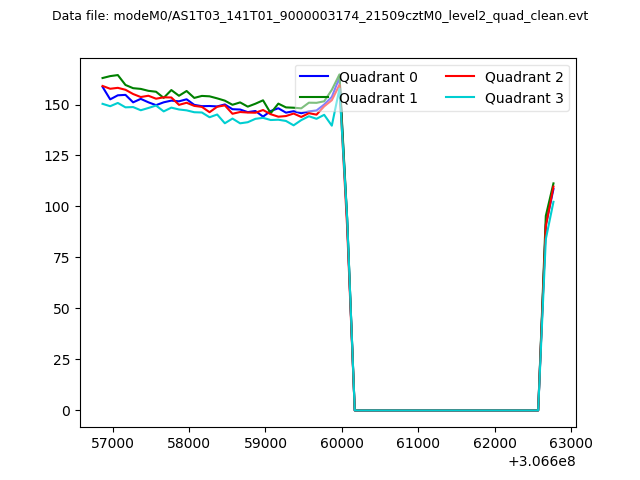 |
|
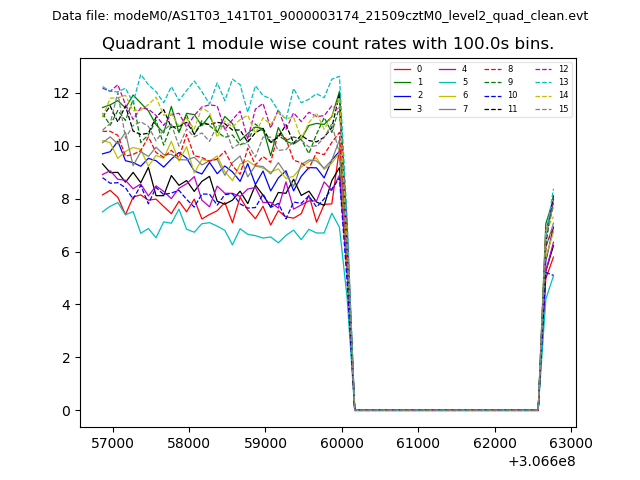
| Module-wise count rates for Quadrant A Data is divided into 100 sec bins |
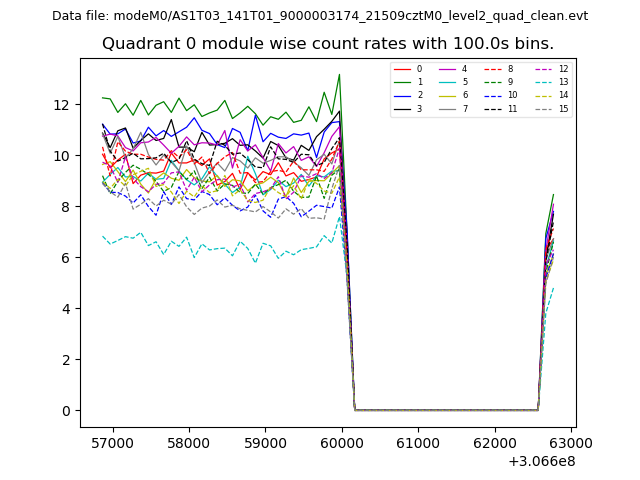 |
 |
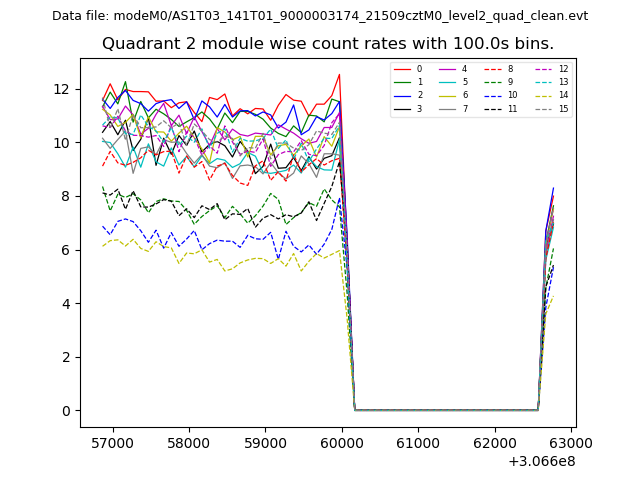
| Module-wise count rates for Quadrant B Data is divided into 100 sec bins |
 |
 |
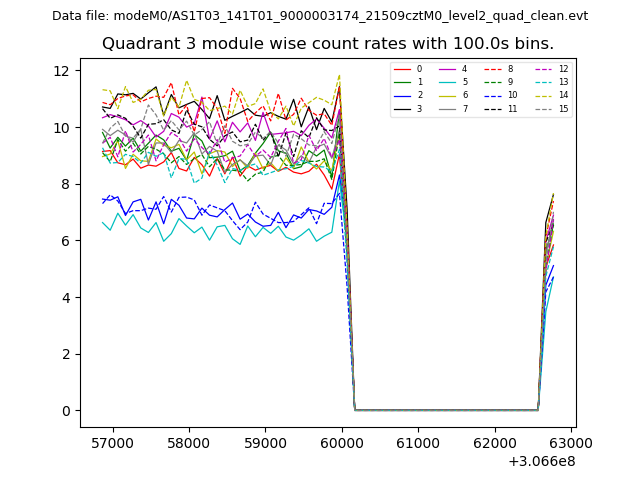
| Module-wise count rates for Quadrant C Data is divided into 100 sec bins |
 |
 |
| Module-wise count rates for Quadrant D Data is divided into 100 sec bins |
 |
 |
| Parameter | Plot |
|---|---|
| CZT HV Monitor | 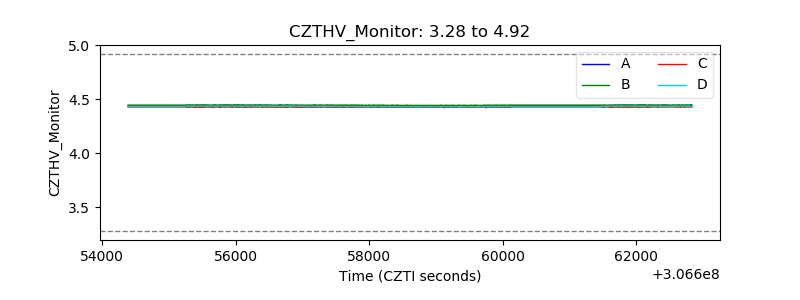 |
| D_VDD | 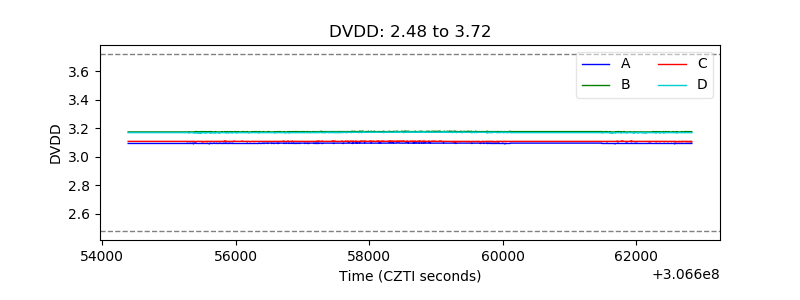 |
| Temperature 1 | 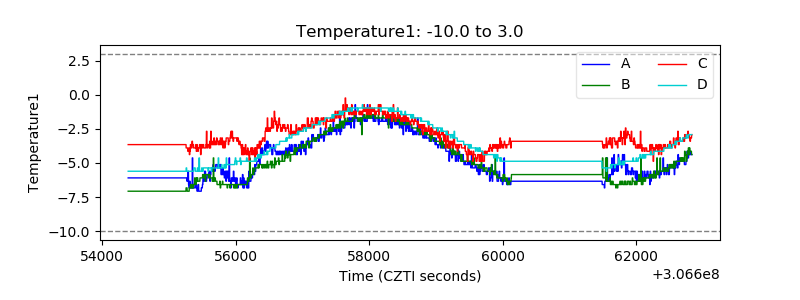 |
| Veto HV Monitor | 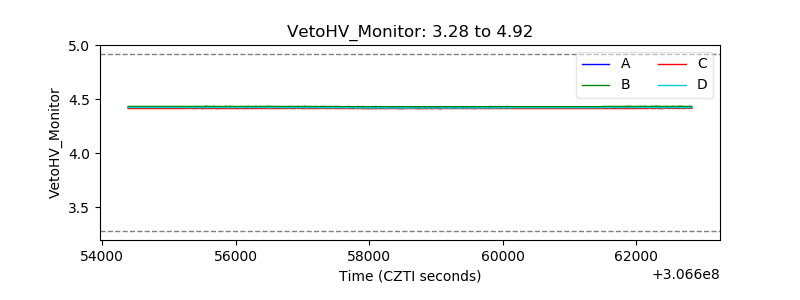 |
| Veto LLD | 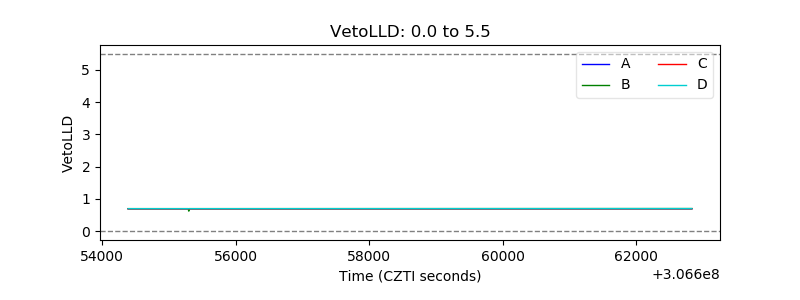 |
| Alpha Counter | 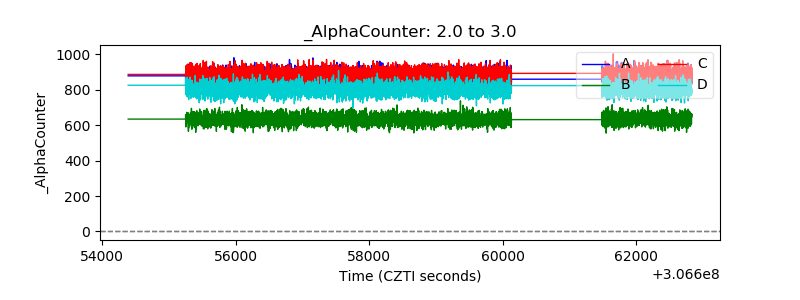 |
| _CPM_Rate | 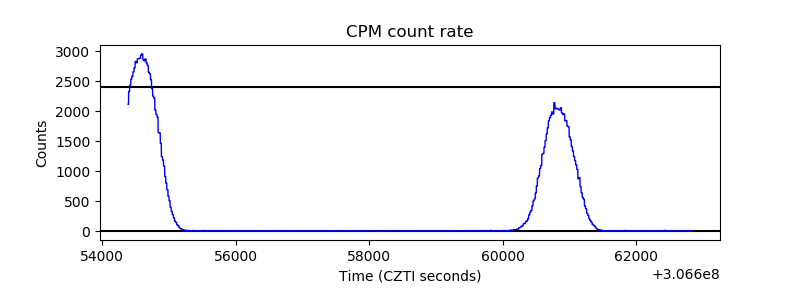 |
| CZT Counter | 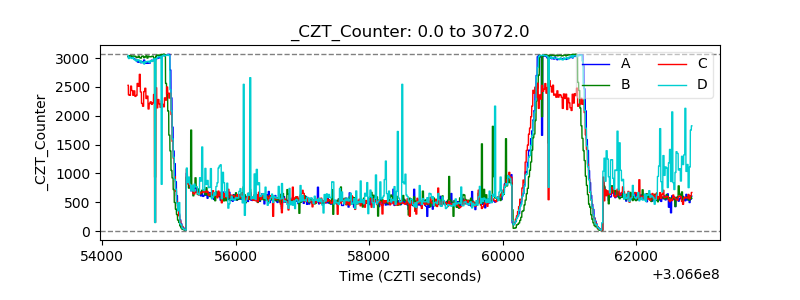 |
| +2.5 Volts monitor |  |
| +5 Volts monitor |  |
| _ROLL_ROT | 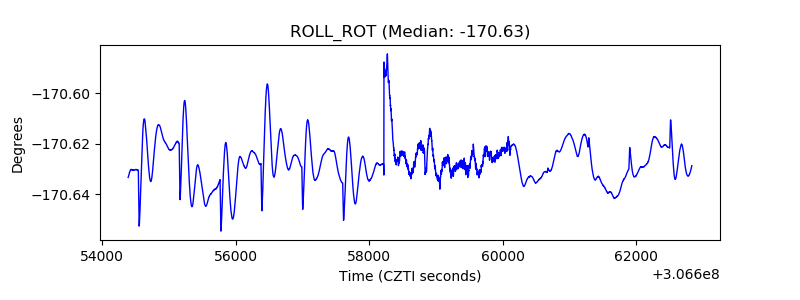 |
| _Roll_DEC | 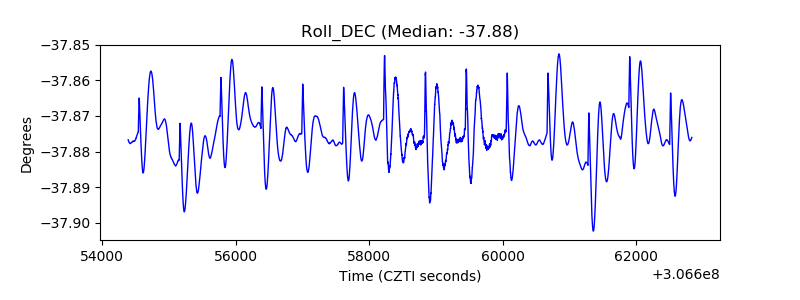 |
| _Roll_RA | 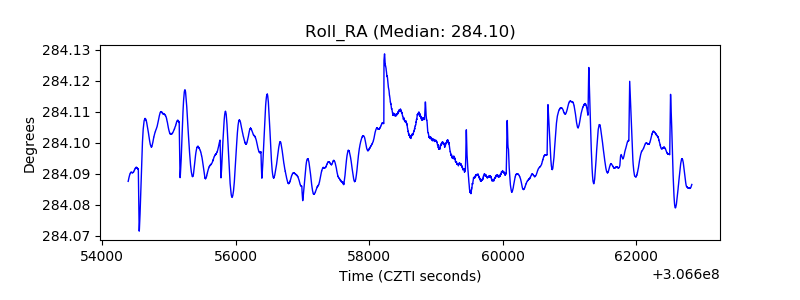 |
| Veto Counter | 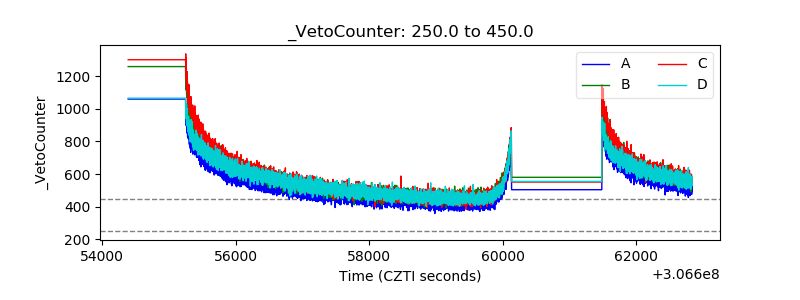 |