| Param | Original file | Final file |
|---|---|---|
| Filename | modeM0/AS1T03_141T01_9000003174_21510cztM0_level2.evt | modeM0/AS1T03_141T01_9000003174_21510cztM0_level2_quad_clean.evt |
| Size (bytes) | 507,502,080 | 96,638,400 |
| Size | 484.0 MB | 92.2 MB |
| Events in quadrant A | 3,378,477 | 629,164 |
| Events in quadrant B | 3,528,372 | 640,091 |
| Events in quadrant C | 3,419,138 | 623,923 |
| Events in quadrant D | 4,620,695 | 598,028 |
| Mode M9 | |||
|---|---|---|---|
| Quadrant | BADHDUFLAG | Total packets | Discarded packets |
| A | 0 | 16 | 0 |
| B | 0 | 17 | 0 |
| C | 0 | 17 | 0 |
| D | 0 | 17 | 0 |
| Mode M0 | |||
|---|---|---|---|
| Quadrant | BADHDUFLAG | Total packets | Discarded packets |
| A | 0 | 13734 | 0 |
| B | 0 | 14322 | 0 |
| C | 0 | 14016 | 0 |
| D | 0 | 17821 | 0 |
| Mode SS | |||
|---|---|---|---|
| Quadrant | BADHDUFLAG | Total packets | Discarded packets |
| A | 0 | 126 | 0 |
| B | 0 | 126 | 0 |
| C | 0 | 126 | 0 |
| D | 0 | 126 | 0 |
| Quadrant | Total seconds | Saturated seconds | Saturation percentage |
|---|---|---|---|
| A | 6240 | 115 | 1.842949% |
| B | 6240 | 136 | 2.179487% |
| C | 6240 | 194 | 3.108974% |
| D | 6240 | 323 | 5.176282% |
Noise dominated data is calculated using 1-second bins in cleaned event files. If a bin has >2000 counts, and if more than 50% of those come from <1% of pixels, then it is considered to be noise-dominated and hence unusable.
| Quadrant | # 1 sec bins | Bins with >0 counts | Bins with >2000 counts | High rate bins dominated by noise | Noise dominated (total time) | Noise dominated (detector-on time) | Marked lightcurve |
|---|---|---|---|---|---|---|---|
| A | 7530 | 6241 | 0 | 0 | 0.00% | 0.00% | 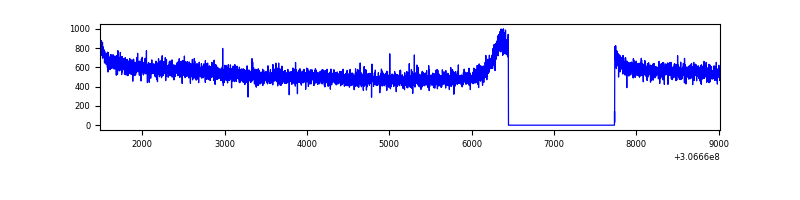 |
| B | 7530 | 6241 | 2 | 2 | 0.03% | 0.03% | 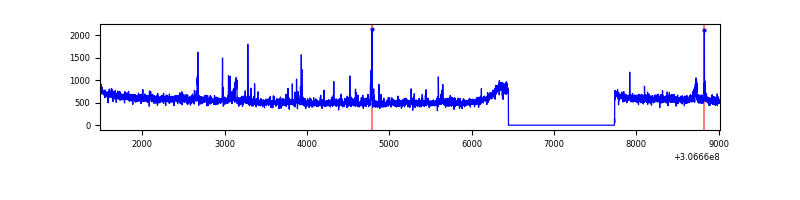 |
| C | 7530 | 6241 | 0 | 0 | 0.00% | 0.00% | 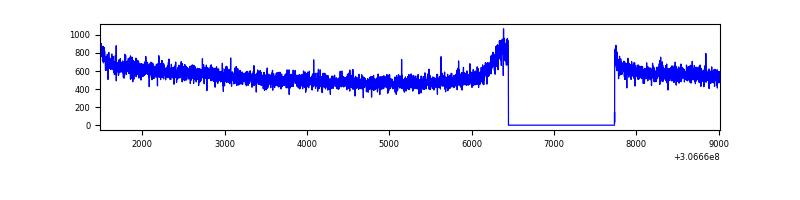 |
| D | 7530 | 6241 | 173 | 173 | 2.30% | 2.77% |  |
Top three noisy pixels from each quadrant. If the there are fewer than three noisy pixels in the level2.evt file, extra rows are filled as -1
| Pixel properties | Quadrant properties | ||||||
|---|---|---|---|---|---|---|---|
| Quadrant | DetID | PixID | Counts | Sigma | Mean | Median | Sigma |
| A | 13 | 254 | 10008 | 52.48 | 877 | 862 | 174.3 |
| A | 0 | 226 | 7557 | 38.42 | 877 | 862 | 174.3 |
| A | 3 | 137 | 6569 | 32.75 | 877 | 862 | 174.3 |
| B | 0 | 230 | 70170 | 432.7 | 866 | 847 | 160.2 |
| B | 0 | 190 | 34247 | 208.48 | 866 | 847 | 160.2 |
| B | 3 | 64 | 20734 | 124.13 | 866 | 847 | 160.2 |
| C | 14 | 238 | 134740 | 696.21 | 841 | 851 | 192.3 |
| C | 13 | 61 | 5939 | 26.46 | 841 | 851 | 192.3 |
| C | 7 | 220 | 2318 | 7.63 | 841 | 851 | 192.3 |
| D | 13 | 174 | 667838 | 3315.71 | 847 | 823 | 201.2 |
| D | 1 | 52 | 371160 | 1840.94 | 847 | 823 | 201.2 |
| D | 14 | 35 | 205326 | 1016.58 | 847 | 823 | 201.2 |
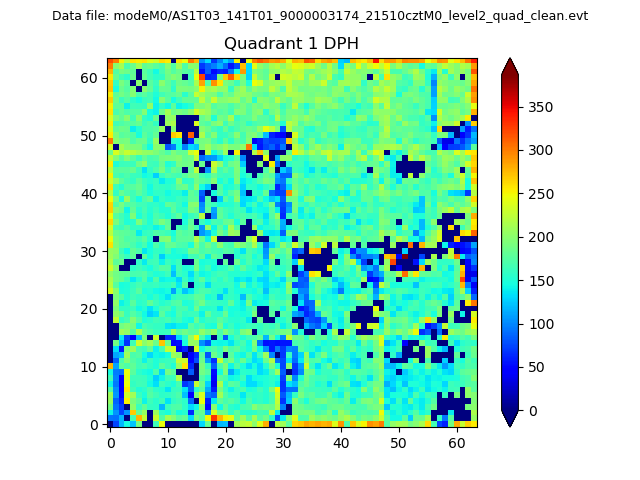
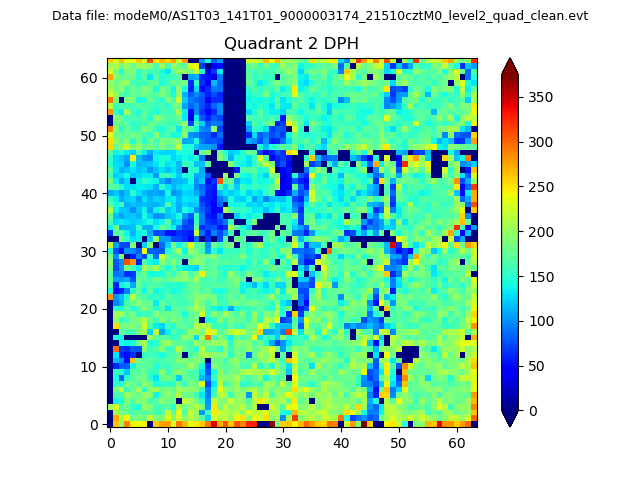
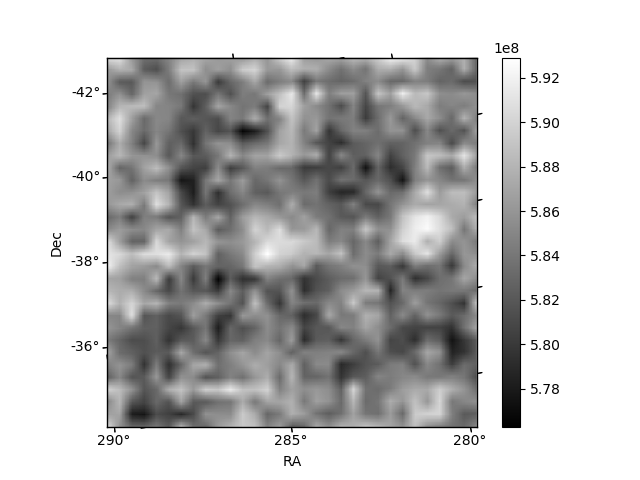
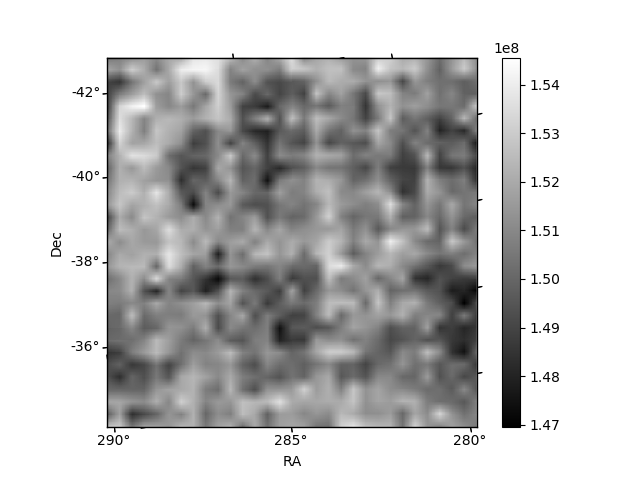
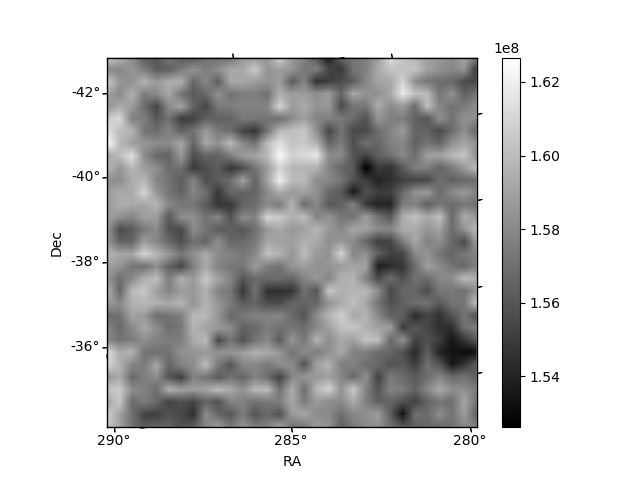
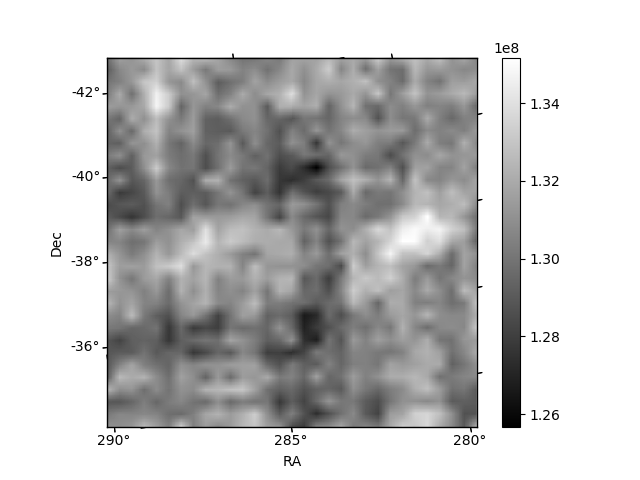
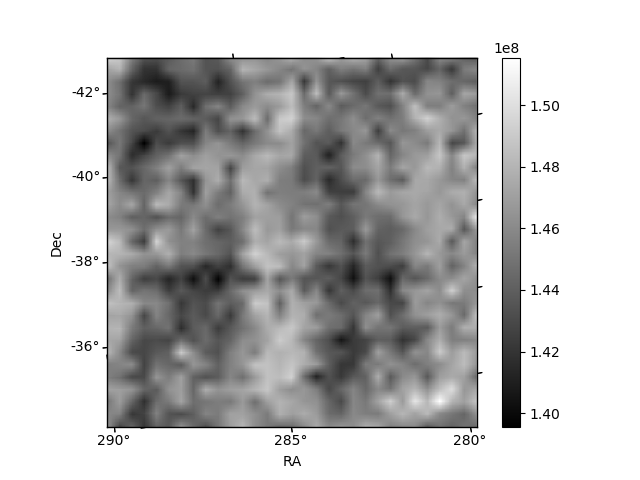
Histogram calculated using DETX and DETY for each event in the final _common_clean file
| Quadrant A | 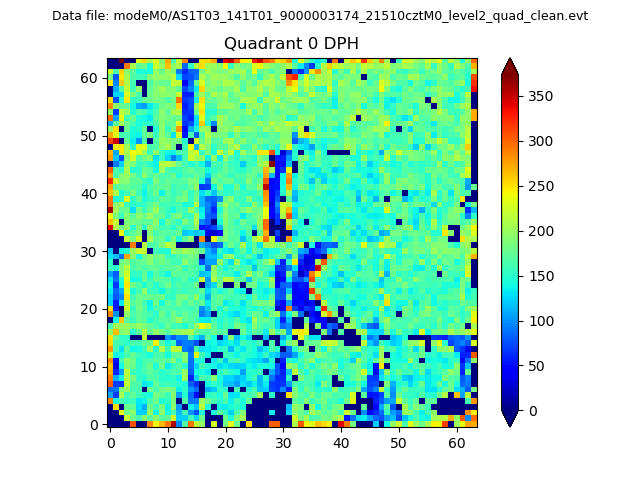 |
 |
Quadrant B |
|---|---|---|---|
| Quadrant D | 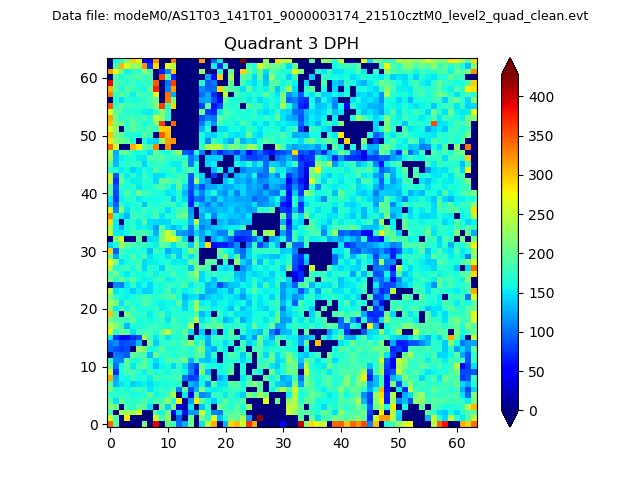 |
 |
Quadrant C |
| Plot type | Count rate plots | Images |
|---|---|---|
| Comparison with Poisson distribution Blue bars denote a histogram of data divided into 1 sec bins. Red curve is a Poisson curve with rate = median count rate of data. |
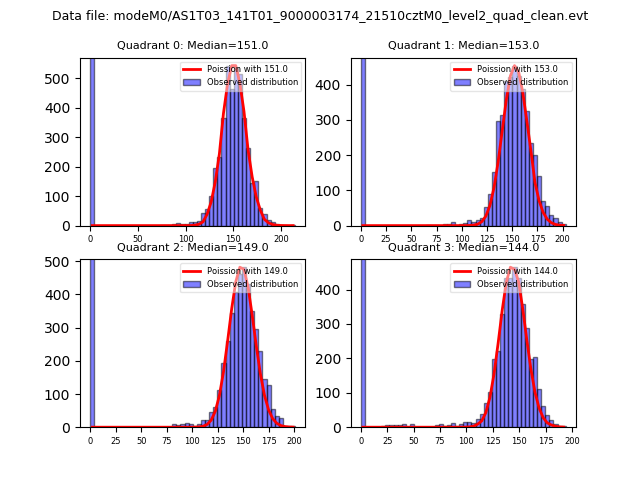 |
 |
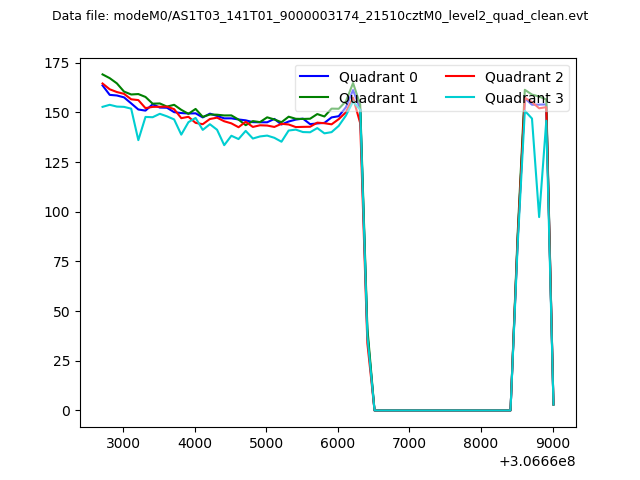
| Quadrant-wise count rates Data is divided into 100 sec bins |
 |
|
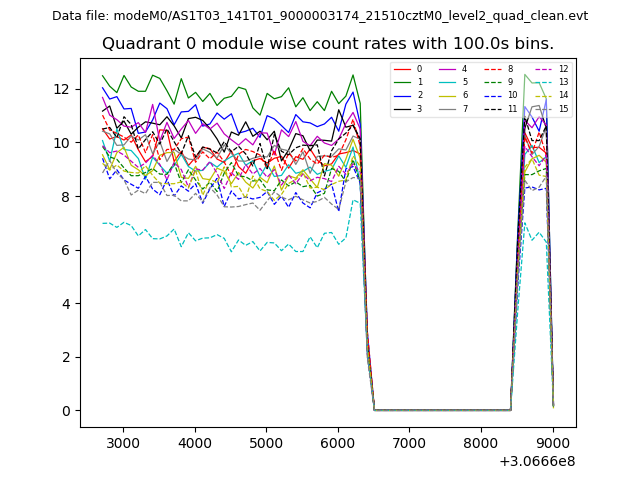
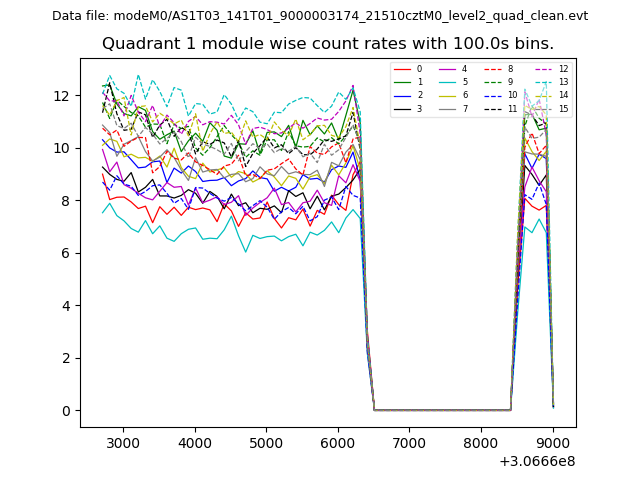
| Module-wise count rates for Quadrant A Data is divided into 100 sec bins |
 |
 |
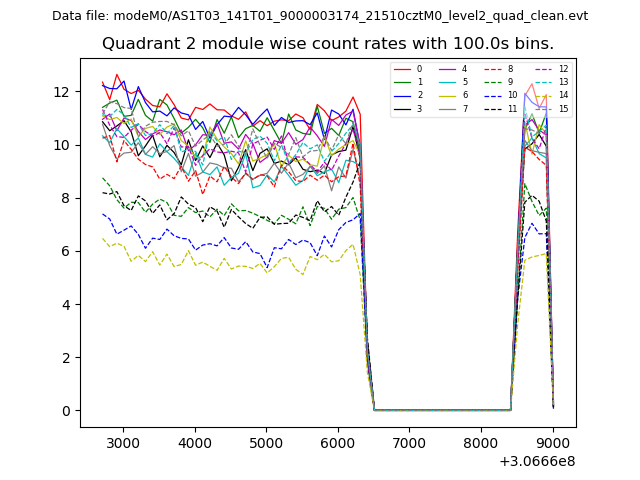
| Module-wise count rates for Quadrant B Data is divided into 100 sec bins |
 |
 |
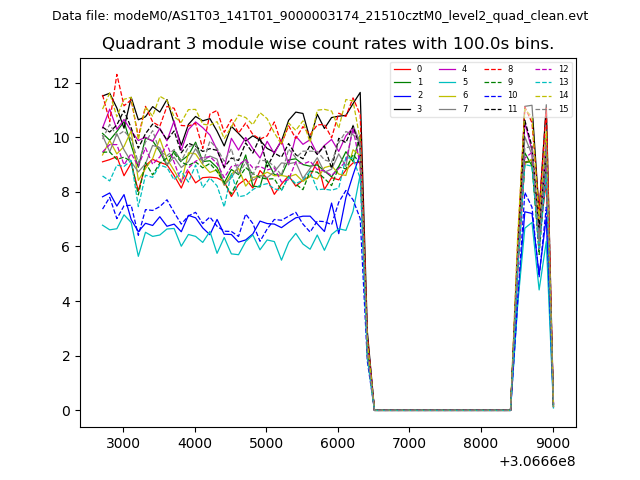
| Module-wise count rates for Quadrant C Data is divided into 100 sec bins |
 |
 |
| Module-wise count rates for Quadrant D Data is divided into 100 sec bins |
 |
 |
| Parameter | Plot |
|---|---|
| CZT HV Monitor | 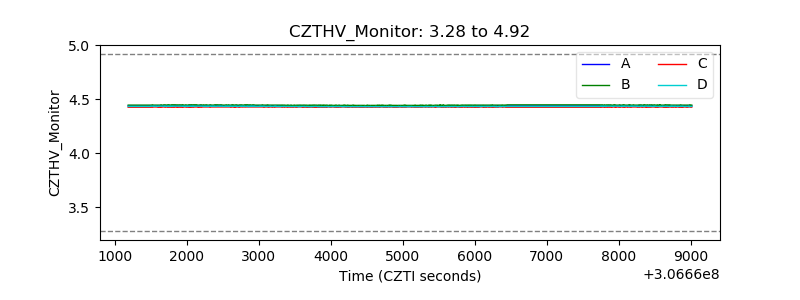 |
| D_VDD |  |
| Temperature 1 | 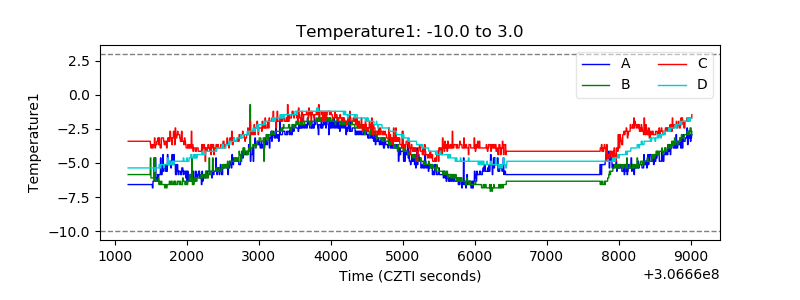 |
| Veto HV Monitor |  |
| Veto LLD | 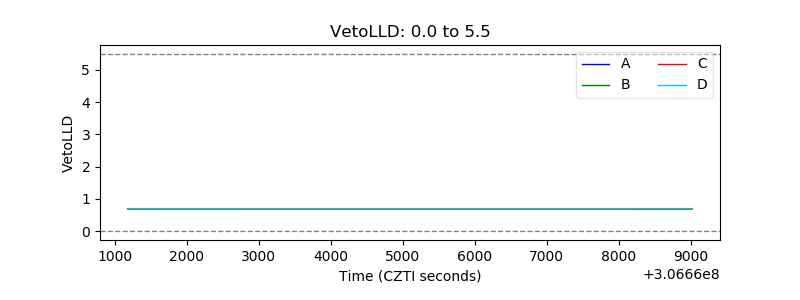 |
| Alpha Counter | 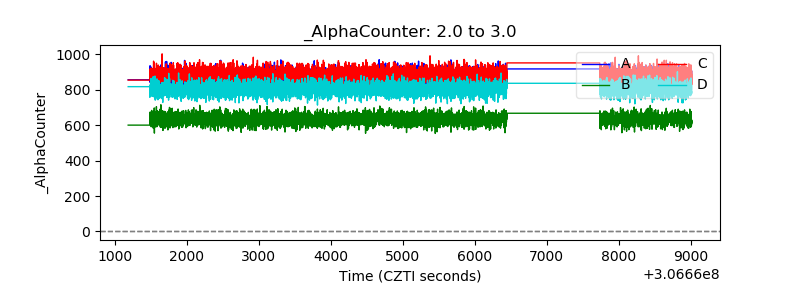 |
| _CPM_Rate | 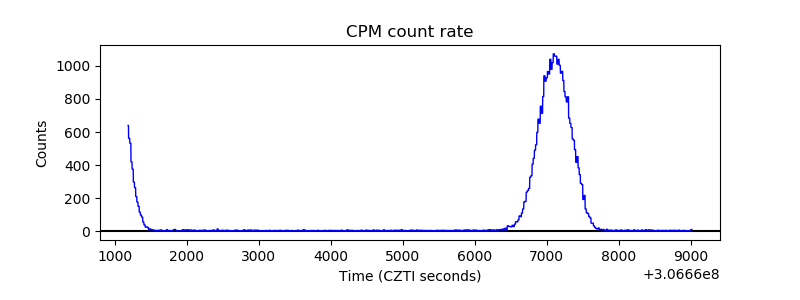 |
| CZT Counter | 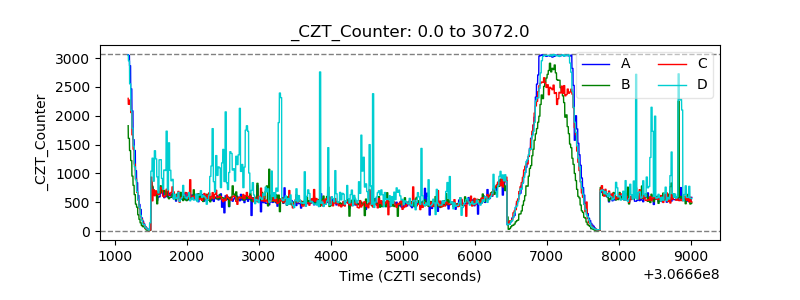 |
| +2.5 Volts monitor |  |
| +5 Volts monitor |  |
| _ROLL_ROT | 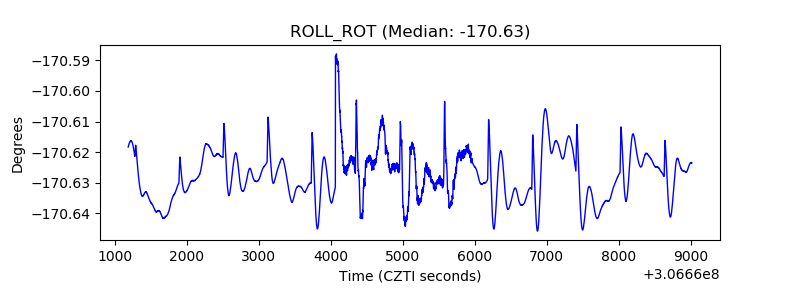 |
| _Roll_DEC | 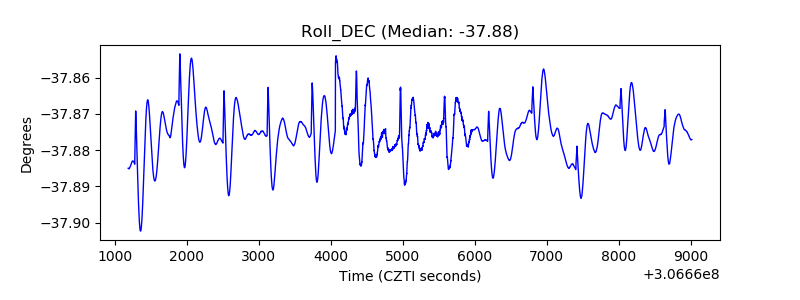 |
| _Roll_RA |  |
| Veto Counter | 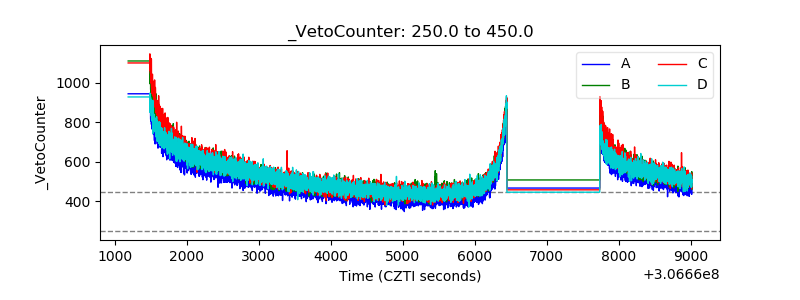 |