| Param | Original file | Final file |
|---|---|---|
| Filename | modeM0/AS1T03_141T01_9000003174_21511cztM0_level2.evt | modeM0/AS1T03_141T01_9000003174_21511cztM0_level2_quad_clean.evt |
| Size (bytes) | 482,083,200 | 102,427,200 |
| Size | 459.8 MB | 97.7 MB |
| Events in quadrant A | 3,324,836 | 669,563 |
| Events in quadrant B | 3,582,875 | 676,832 |
| Events in quadrant C | 3,348,715 | 660,996 |
| Events in quadrant D | 3,902,303 | 641,601 |
| Mode M9 | |||
|---|---|---|---|
| Quadrant | BADHDUFLAG | Total packets | Discarded packets |
| A | 0 | 16 | 0 |
| B | 0 | 17 | 0 |
| C | 0 | 17 | 0 |
| D | 0 | 17 | 0 |
| Mode M0 | |||
|---|---|---|---|
| Quadrant | BADHDUFLAG | Total packets | Discarded packets |
| A | 0 | 13706 | 0 |
| B | 0 | 14542 | 0 |
| C | 0 | 13878 | 0 |
| D | 0 | 15719 | 0 |
| Mode SS | |||
|---|---|---|---|
| Quadrant | BADHDUFLAG | Total packets | Discarded packets |
| A | 0 | 132 | 0 |
| B | 0 | 132 | 0 |
| C | 0 | 132 | 0 |
| D | 0 | 132 | 0 |
| Quadrant | Total seconds | Saturated seconds | Saturation percentage |
|---|---|---|---|
| A | 6495 | 97 | 1.493457% |
| B | 6495 | 149 | 2.294072% |
| C | 6495 | 142 | 2.186297% |
| D | 6495 | 204 | 3.140878% |
Noise dominated data is calculated using 1-second bins in cleaned event files. If a bin has >2000 counts, and if more than 50% of those come from <1% of pixels, then it is considered to be noise-dominated and hence unusable.
| Quadrant | # 1 sec bins | Bins with >0 counts | Bins with >2000 counts | High rate bins dominated by noise | Noise dominated (total time) | Noise dominated (detector-on time) | Marked lightcurve |
|---|---|---|---|---|---|---|---|
| A | 7595 | 6496 | 1 | 1 | 0.01% | 0.02% | 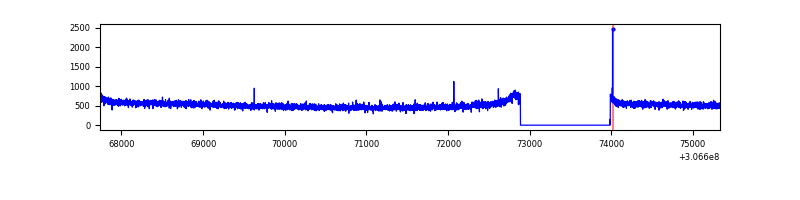 |
| B | 7595 | 6496 | 29 | 29 | 0.38% | 0.45% | 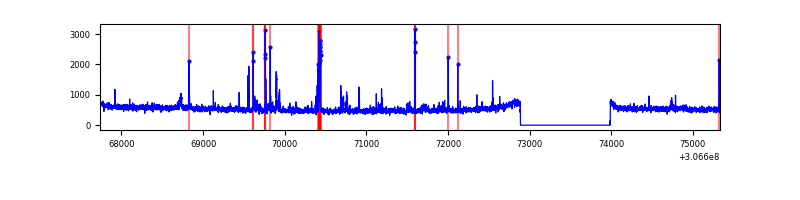 |
| C | 7595 | 6496 | 0 | 0 | 0.00% | 0.00% | 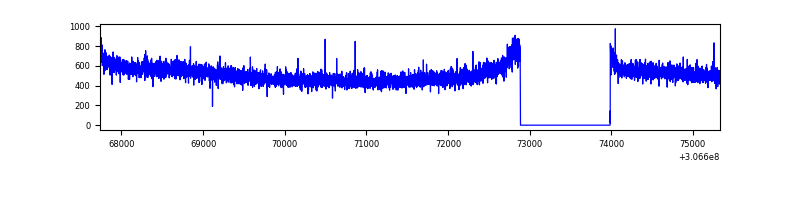 |
| D | 7595 | 6496 | 118 | 118 | 1.55% | 1.82% | 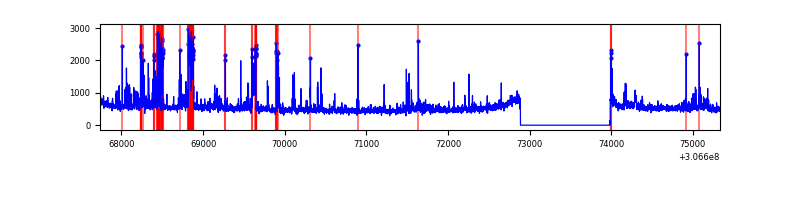 |
Top three noisy pixels from each quadrant. If the there are fewer than three noisy pixels in the level2.evt file, extra rows are filled as -1
| Pixel properties | Quadrant properties | ||||||
|---|---|---|---|---|---|---|---|
| Quadrant | DetID | PixID | Counts | Sigma | Mean | Median | Sigma |
| A | 13 | 254 | 9770 | 51.7 | 861 | 844 | 172.7 |
| A | 0 | 226 | 7485 | 38.46 | 861 | 844 | 172.7 |
| A | 3 | 137 | 6644 | 33.59 | 861 | 844 | 172.7 |
| B | 3 | 64 | 134616 | 839.19 | 850 | 830 | 159.4 |
| B | 0 | 230 | 63246 | 391.51 | 850 | 830 | 159.4 |
| B | 0 | 190 | 27087 | 164.7 | 850 | 830 | 159.4 |
| C | 14 | 238 | 129110 | 679.17 | 823 | 831 | 188.9 |
| C | 0 | 239 | 6102 | 27.91 | 823 | 831 | 188.9 |
| C | 13 | 61 | 5791 | 26.26 | 823 | 831 | 188.9 |
| D | 1 | 52 | 330670 | 1639.04 | 834 | 809 | 201.3 |
| D | 14 | 35 | 176790 | 874.43 | 834 | 809 | 201.3 |
| D | 13 | 172 | 85449 | 420.56 | 834 | 809 | 201.3 |
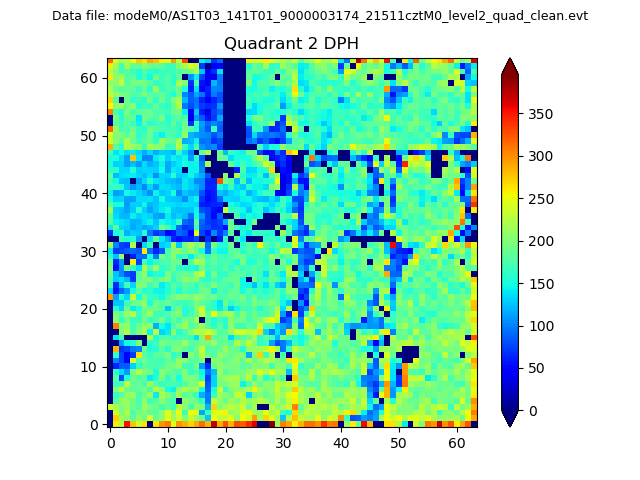
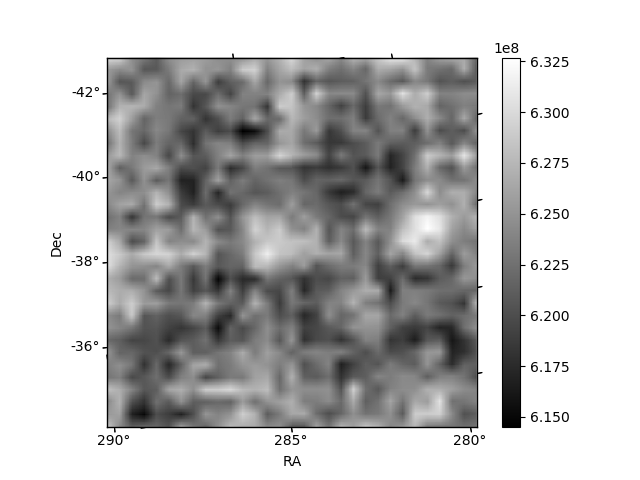
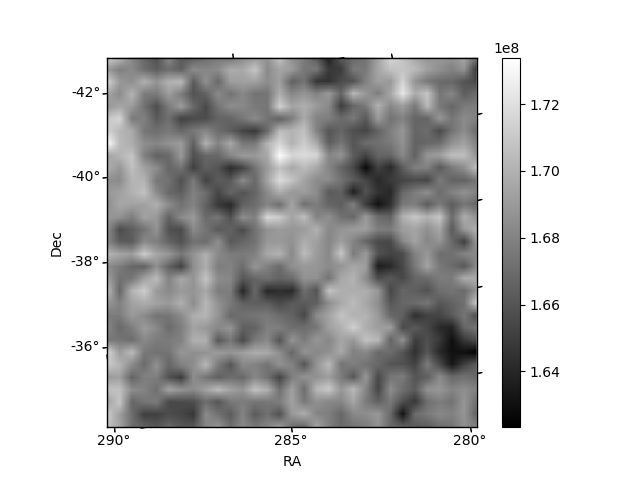
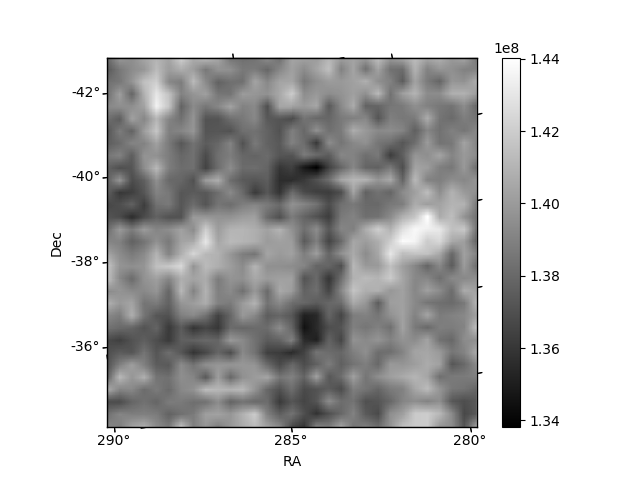
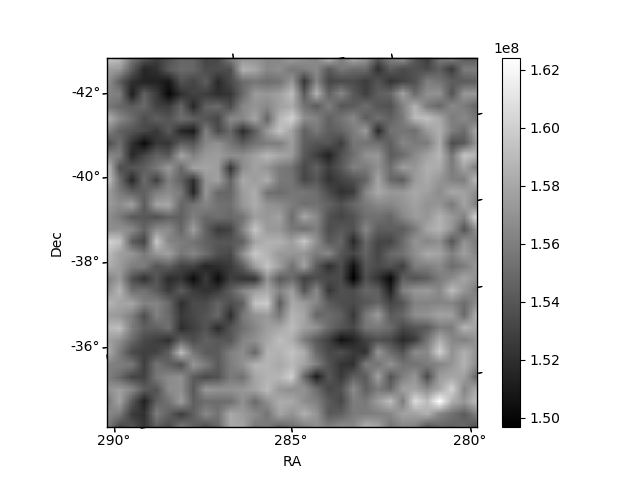
Histogram calculated using DETX and DETY for each event in the final _common_clean file
| Quadrant A | 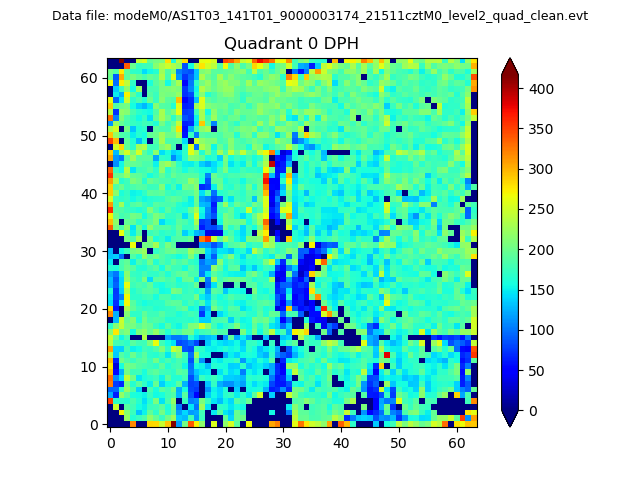 |
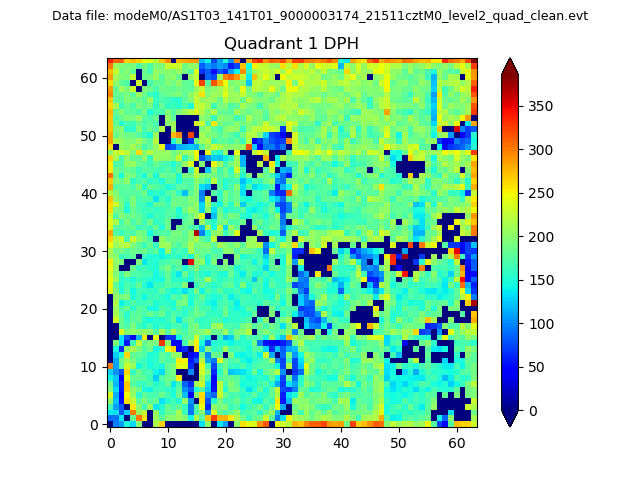 |
Quadrant B |
|---|---|---|---|
| Quadrant D | 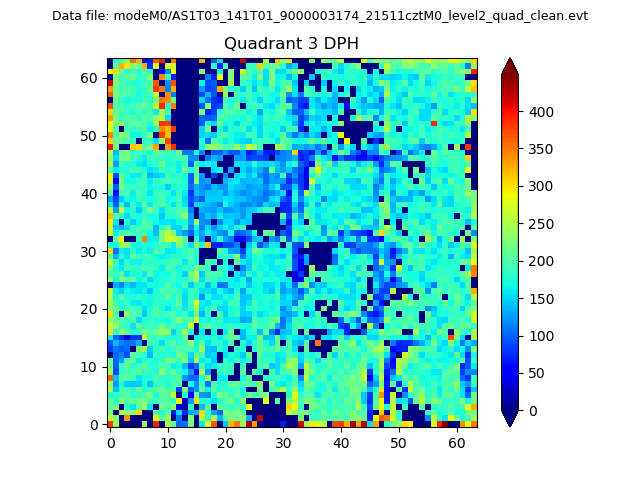 |
 |
Quadrant C |
| Plot type | Count rate plots | Images |
|---|---|---|
| Comparison with Poisson distribution Blue bars denote a histogram of data divided into 1 sec bins. Red curve is a Poisson curve with rate = median count rate of data. |
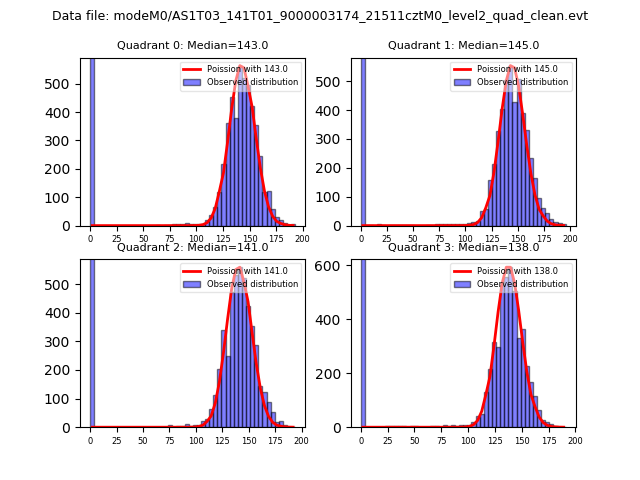 |
 |
| Quadrant-wise count rates Data is divided into 100 sec bins |
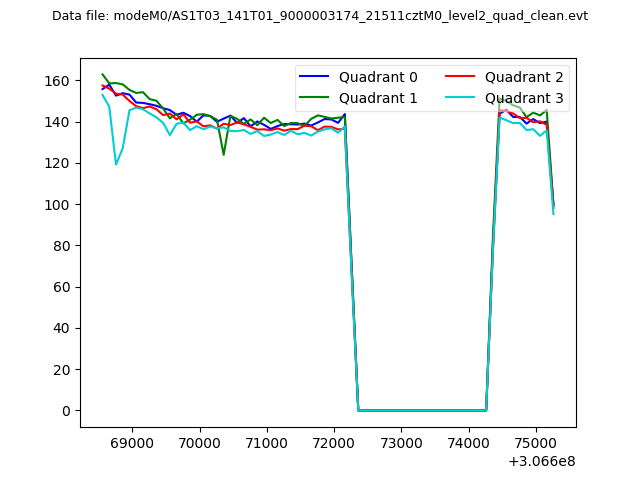 |
|
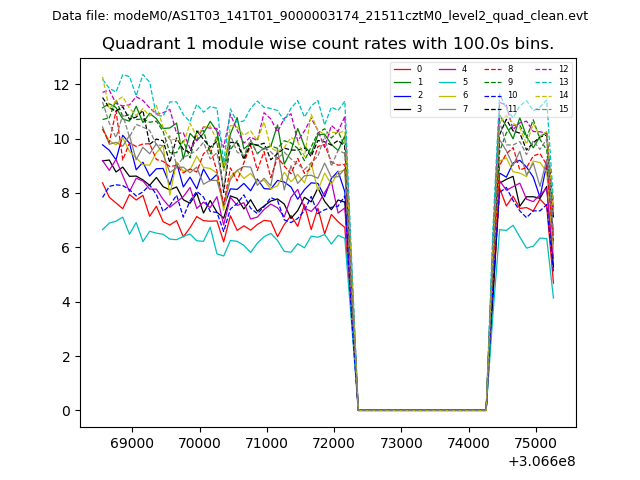
| Module-wise count rates for Quadrant A Data is divided into 100 sec bins |
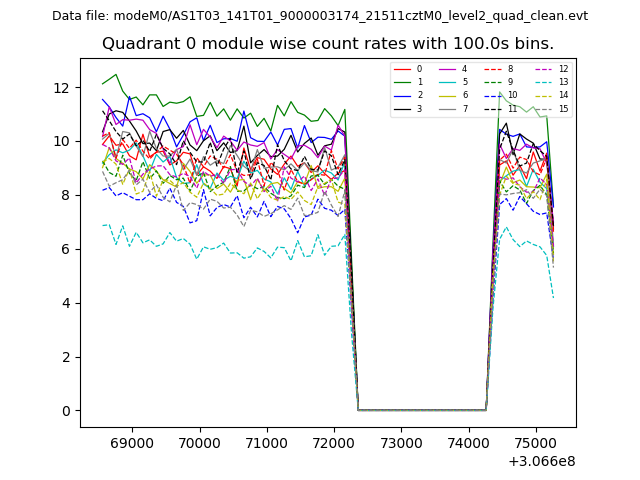 |
 |
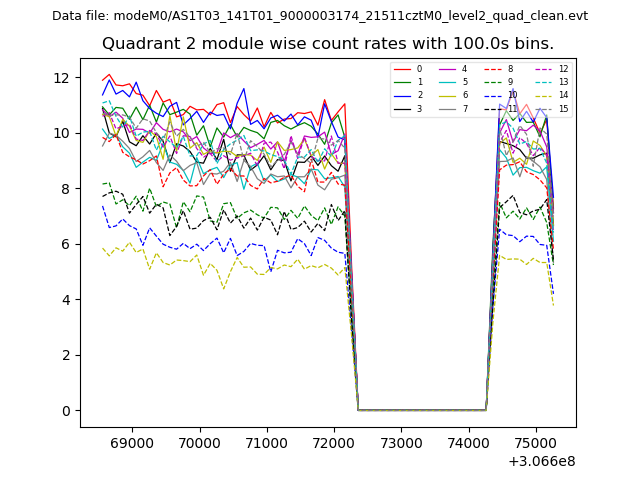
| Module-wise count rates for Quadrant B Data is divided into 100 sec bins |
 |
 |
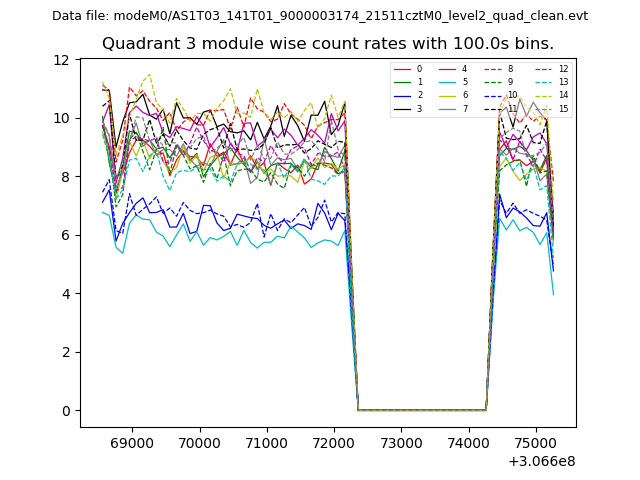
| Module-wise count rates for Quadrant C Data is divided into 100 sec bins |
 |
 |
| Module-wise count rates for Quadrant D Data is divided into 100 sec bins |
 |
 |
| Parameter | Plot |
|---|---|
| CZT HV Monitor | 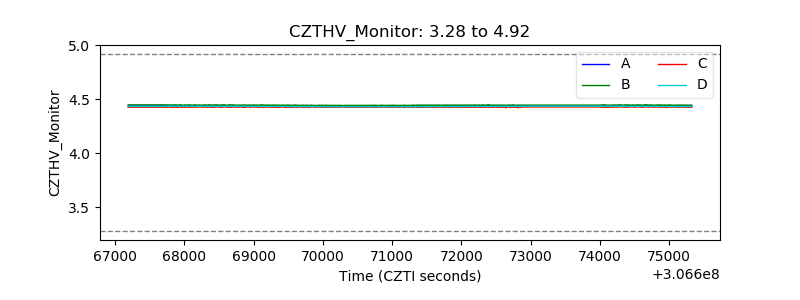 |
| D_VDD | 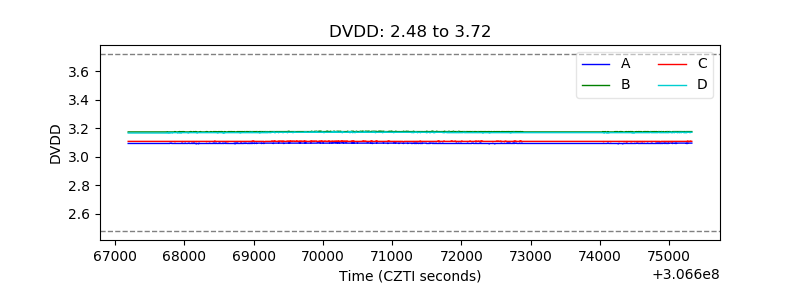 |
| Temperature 1 | 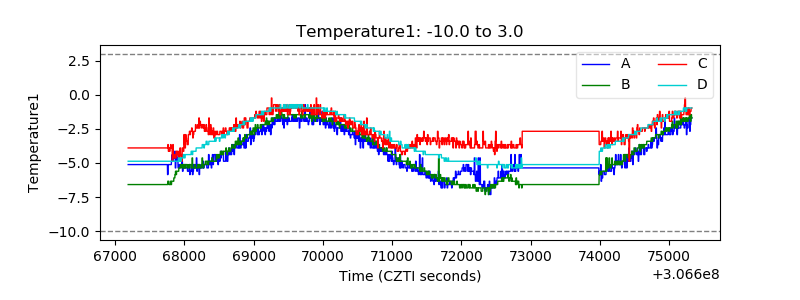 |
| Veto HV Monitor | 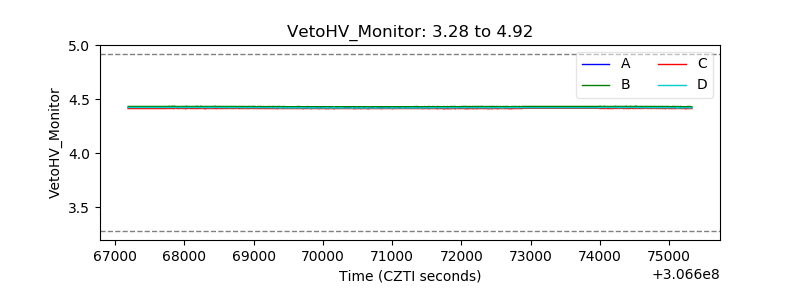 |
| Veto LLD | 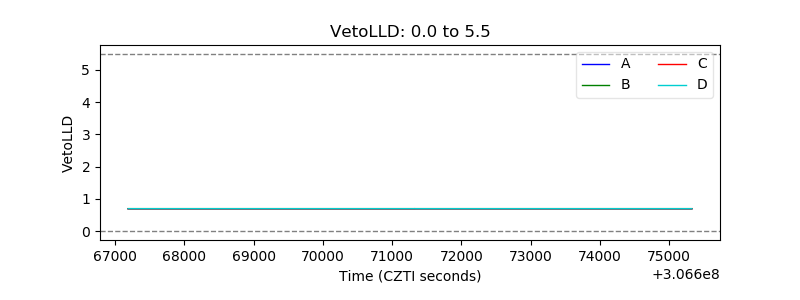 |
| Alpha Counter | 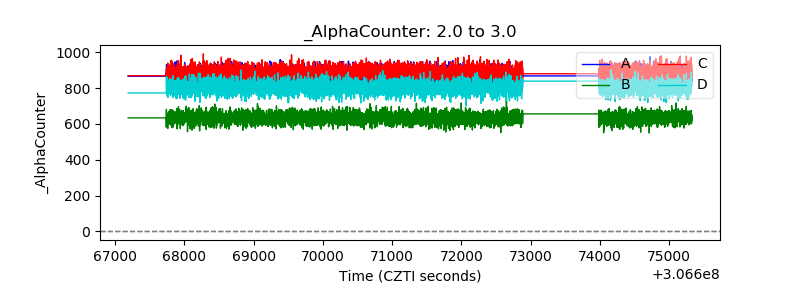 |
| _CPM_Rate | 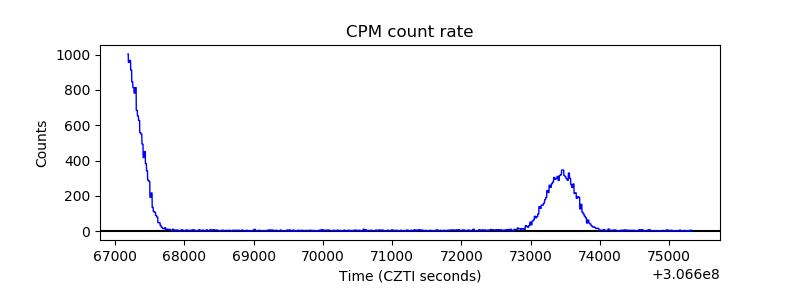 |
| CZT Counter | 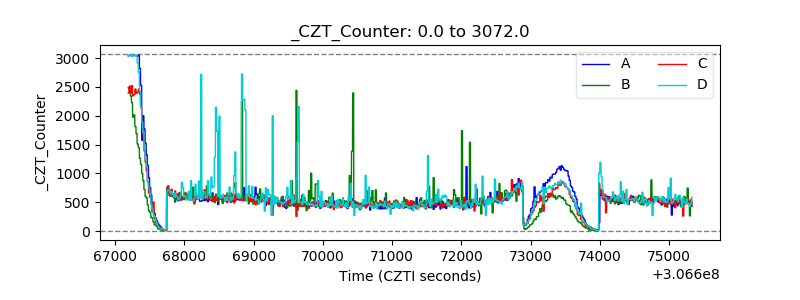 |
| +2.5 Volts monitor |  |
| +5 Volts monitor |  |
| _ROLL_ROT | 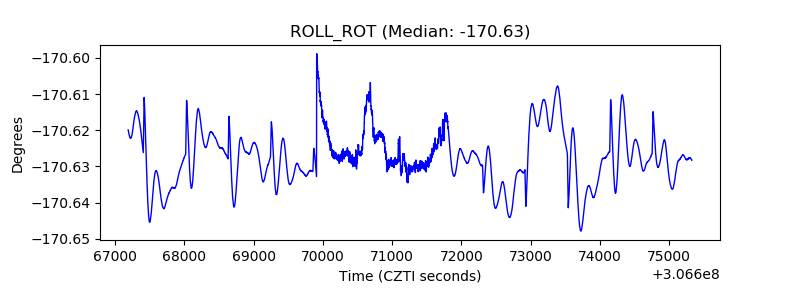 |
| _Roll_DEC | 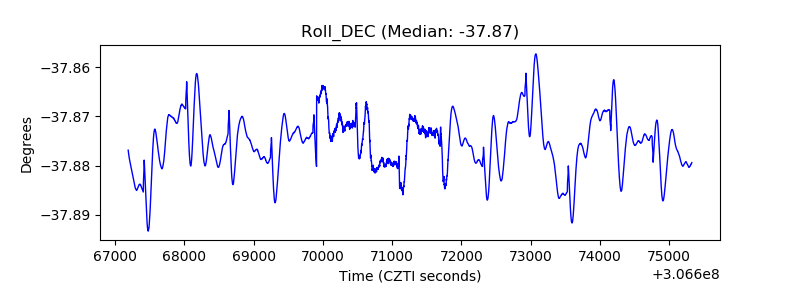 |
| _Roll_RA | 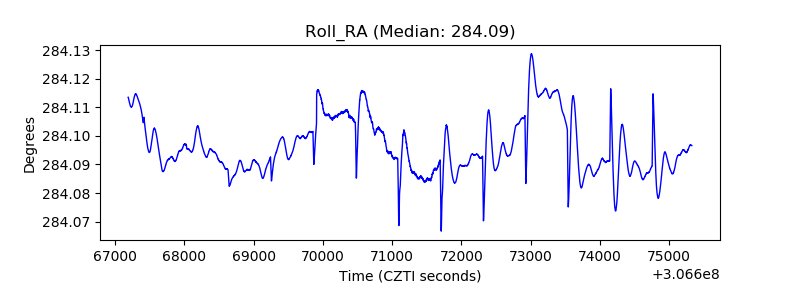 |
| Veto Counter | 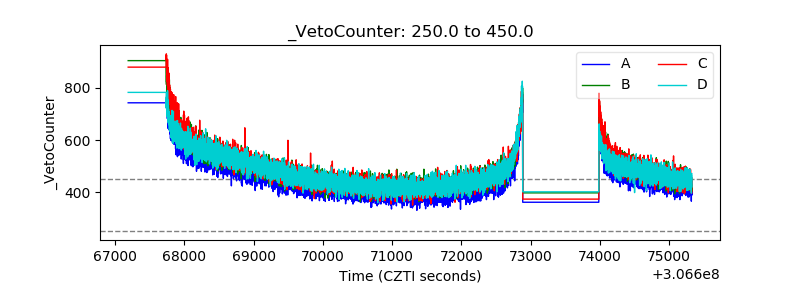 |