| Param | Original file | Final file |
|---|---|---|
| Filename | modeM0/AS1T03_141T01_9000003174_21512cztM0_level2.evt | modeM0/AS1T03_141T01_9000003174_21512cztM0_level2_quad_clean.evt |
| Size (bytes) | 534,507,840 | 104,742,720 |
| Size | 509.7 MB | 99.9 MB |
| Events in quadrant A | 3,409,253 | 685,224 |
| Events in quadrant B | 3,589,568 | 699,444 |
| Events in quadrant C | 3,420,420 | 678,535 |
| Events in quadrant D | 5,298,535 | 626,754 |
| Mode M9 | |||
|---|---|---|---|
| Quadrant | BADHDUFLAG | Total packets | Discarded packets |
| A | 0 | 8 | 0 |
| B | 0 | 9 | 0 |
| C | 0 | 9 | 0 |
| D | 0 | 9 | 0 |
| Mode M0 | |||
|---|---|---|---|
| Quadrant | BADHDUFLAG | Total packets | Discarded packets |
| A | 0 | 14405 | 0 |
| B | 0 | 14838 | 0 |
| C | 0 | 14436 | 0 |
| D | 0 | 20201 | 0 |
| Mode SS | |||
|---|---|---|---|
| Quadrant | BADHDUFLAG | Total packets | Discarded packets |
| A | 0 | 138 | 0 |
| B | 0 | 138 | 0 |
| C | 0 | 138 | 0 |
| D | 0 | 138 | 0 |
| Quadrant | Total seconds | Saturated seconds | Saturation percentage |
|---|---|---|---|
| A | 6929 | 123 | 1.775148% |
| B | 6929 | 145 | 2.092654% |
| C | 6929 | 148 | 2.135950% |
| D | 6928 | 613 | 8.848152% |
Noise dominated data is calculated using 1-second bins in cleaned event files. If a bin has >2000 counts, and if more than 50% of those come from <1% of pixels, then it is considered to be noise-dominated and hence unusable.
| Quadrant | # 1 sec bins | Bins with >0 counts | Bins with >2000 counts | High rate bins dominated by noise | Noise dominated (total time) | Noise dominated (detector-on time) | Marked lightcurve |
|---|---|---|---|---|---|---|---|
| A | 7594 | 6930 | 1 | 1 | 0.01% | 0.01% |  |
| B | 7594 | 6930 | 9 | 9 | 0.12% | 0.13% |  |
| C | 7594 | 6930 | 0 | 0 | 0.00% | 0.00% | 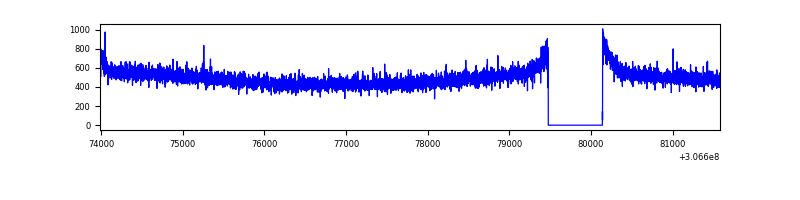 |
| D | 7593 | 6929 | 396 | 396 | 5.22% | 5.72% | 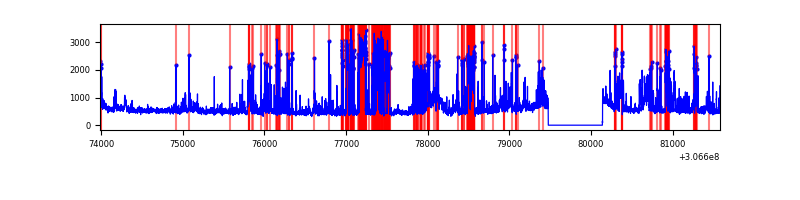 |
Top three noisy pixels from each quadrant. If the there are fewer than three noisy pixels in the level2.evt file, extra rows are filled as -1
| Pixel properties | Quadrant properties | ||||||
|---|---|---|---|---|---|---|---|
| Quadrant | DetID | PixID | Counts | Sigma | Mean | Median | Sigma |
| A | 5 | 98 | 12735 | 67.38 | 880 | 862 | 176.2 |
| A | 13 | 254 | 11012 | 57.6 | 880 | 862 | 176.2 |
| A | 0 | 226 | 7466 | 37.48 | 880 | 862 | 176.2 |
| B | 3 | 64 | 49647 | 295.64 | 874 | 851 | 165.1 |
| B | 10 | 249 | 43937 | 261.04 | 874 | 851 | 165.1 |
| B | 0 | 230 | 40746 | 241.71 | 874 | 851 | 165.1 |
| C | 14 | 238 | 131574 | 665.21 | 842 | 848 | 196.5 |
| C | 0 | 239 | 6901 | 30.8 | 842 | 848 | 196.5 |
| C | 13 | 61 | 5912 | 25.77 | 842 | 848 | 196.5 |
| D | 1 | 52 | 1465685 | 7309.26 | 829 | 805 | 200.4 |
| D | 14 | 35 | 227243 | 1129.85 | 829 | 805 | 200.4 |
| D | 13 | 174 | 181453 | 901.37 | 829 | 805 | 200.4 |
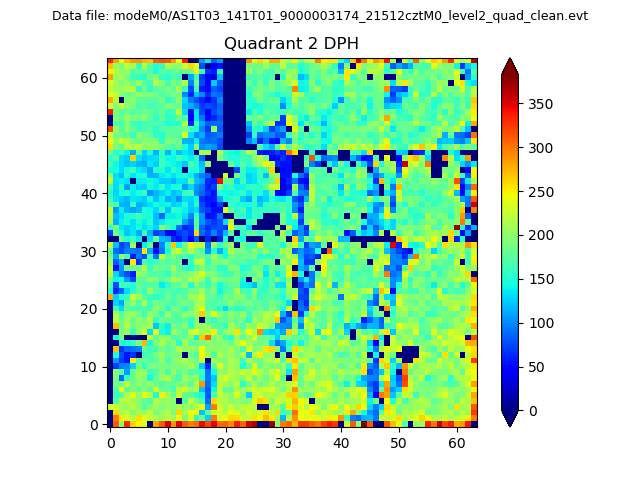
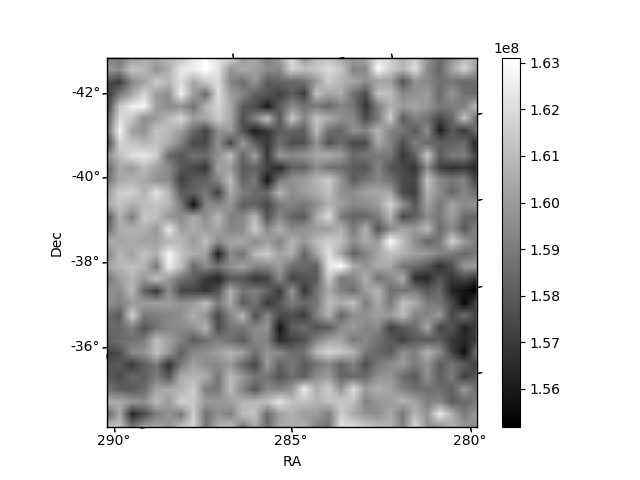
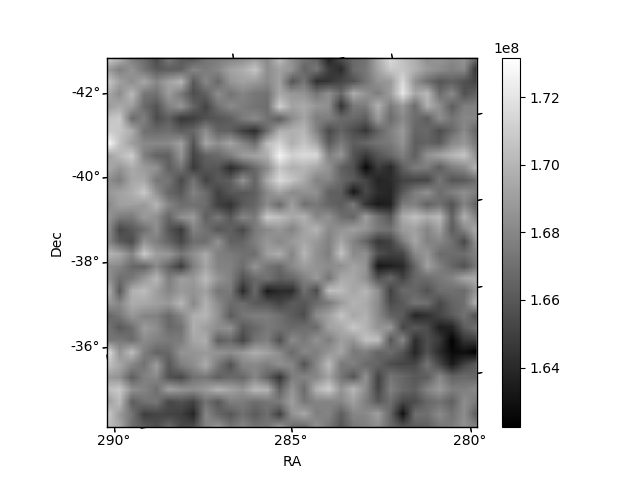
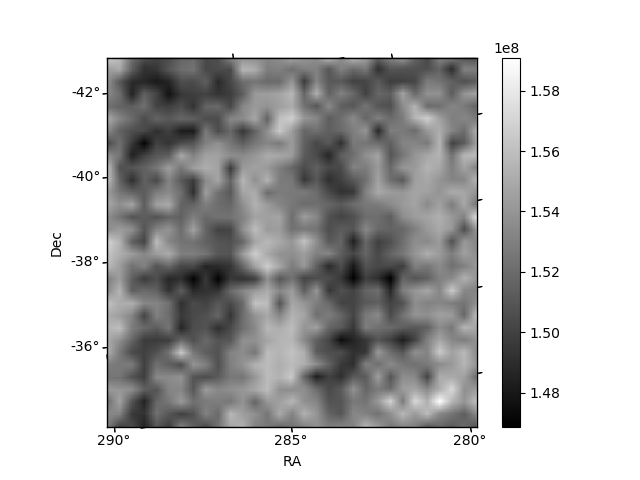
Histogram calculated using DETX and DETY for each event in the final _common_clean file
| Quadrant A | 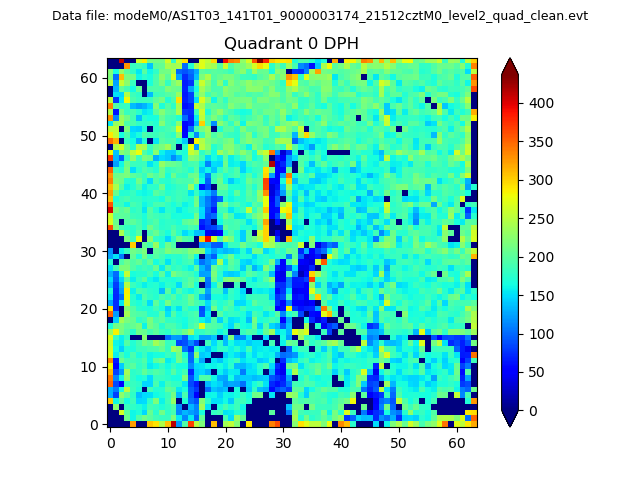 |
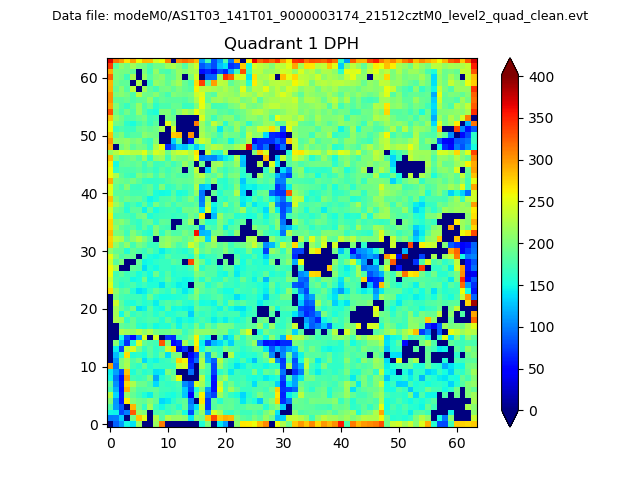 |
Quadrant B |
|---|---|---|---|
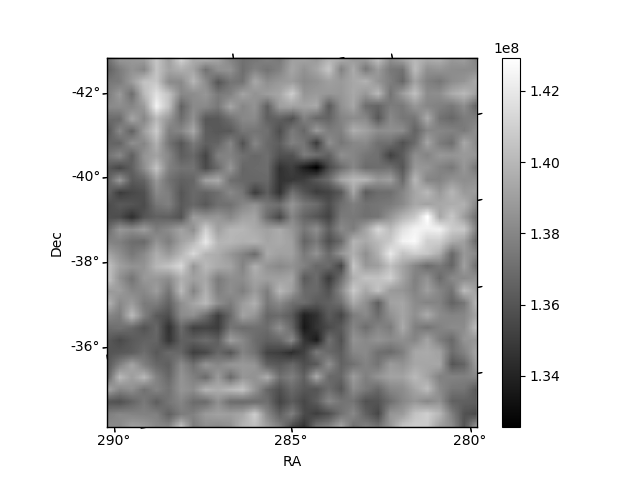
| Quadrant D | 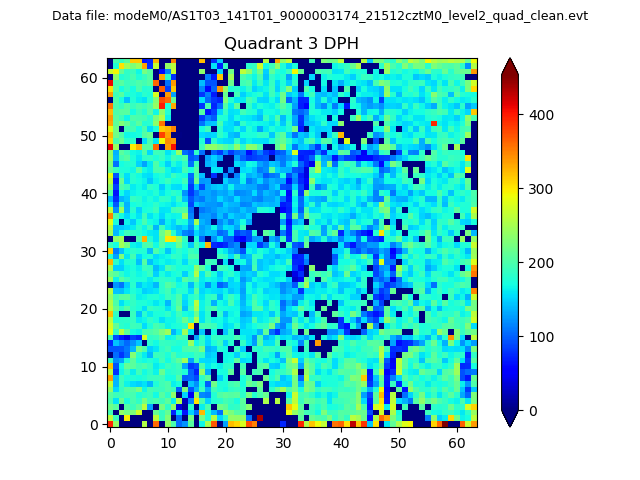 |
 |
Quadrant C |
| Plot type | Count rate plots | Images |
|---|---|---|
| Comparison with Poisson distribution Blue bars denote a histogram of data divided into 1 sec bins. Red curve is a Poisson curve with rate = median count rate of data. |
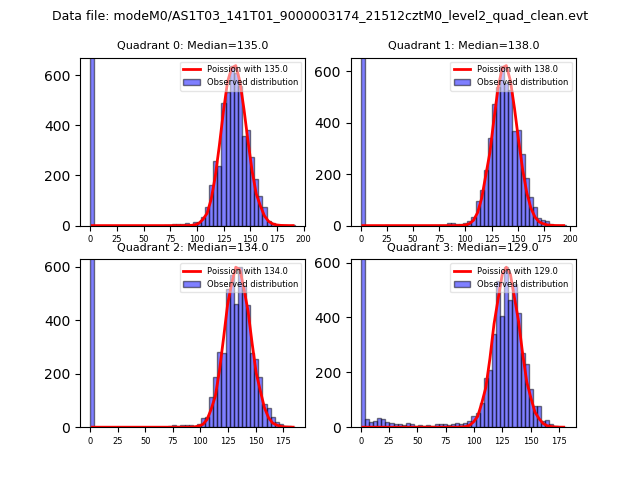 |
 |
| Quadrant-wise count rates Data is divided into 100 sec bins |
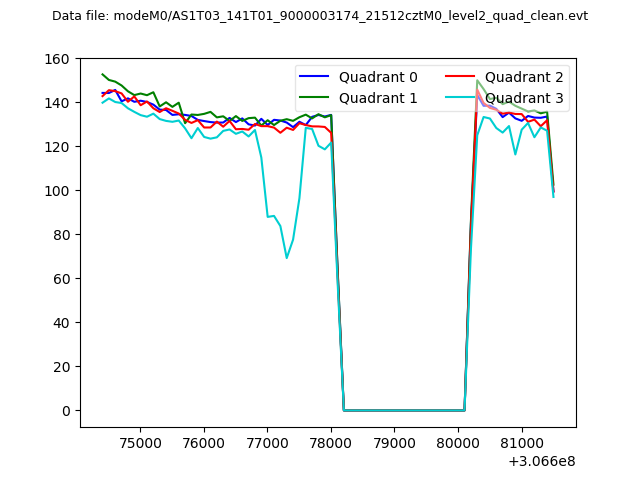 |
|
| Module-wise count rates for Quadrant A Data is divided into 100 sec bins |
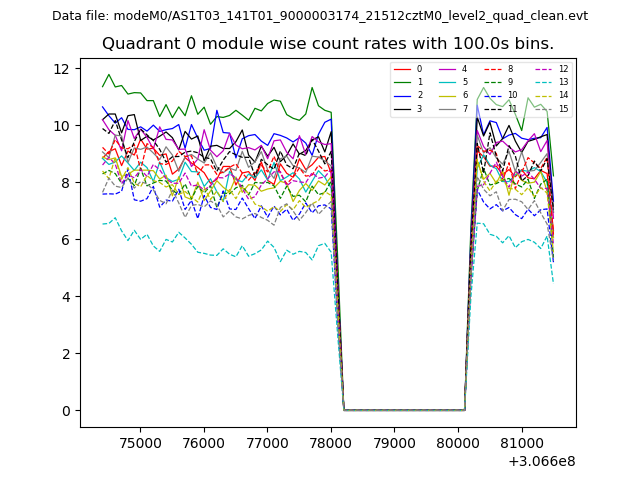 |
 |
| Module-wise count rates for Quadrant B Data is divided into 100 sec bins |
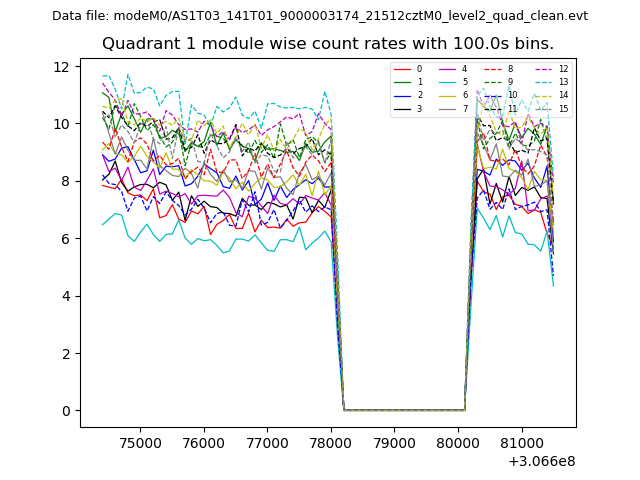 |
 |
| Module-wise count rates for Quadrant C Data is divided into 100 sec bins |
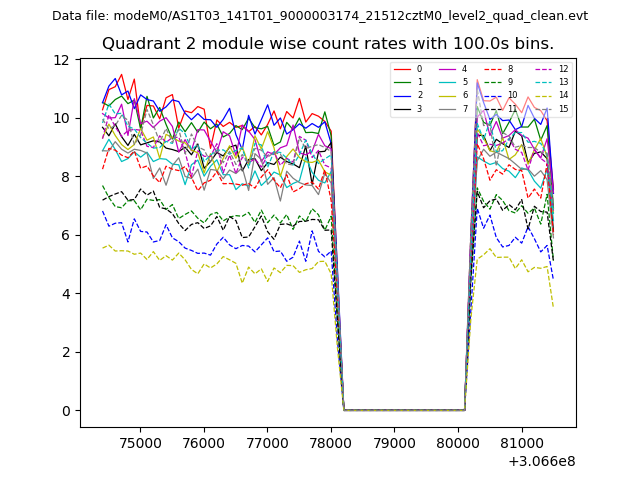 |
 |
| Module-wise count rates for Quadrant D Data is divided into 100 sec bins |
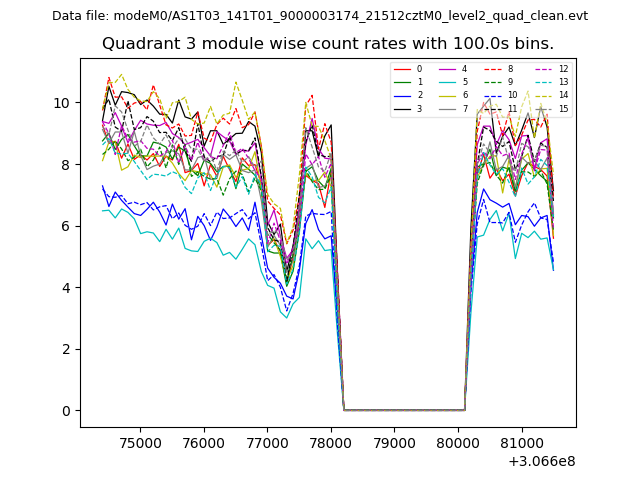 |
 |
| Parameter | Plot |
|---|---|
| CZT HV Monitor | 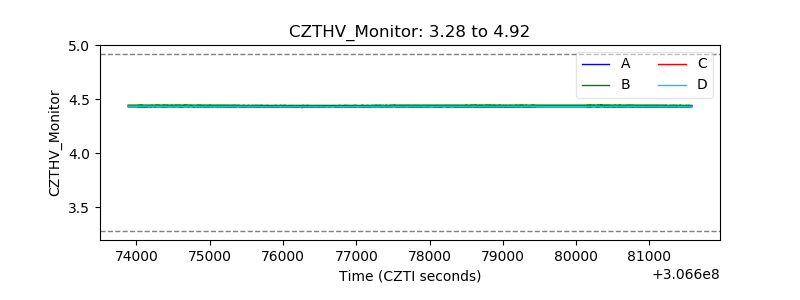 |
| D_VDD | 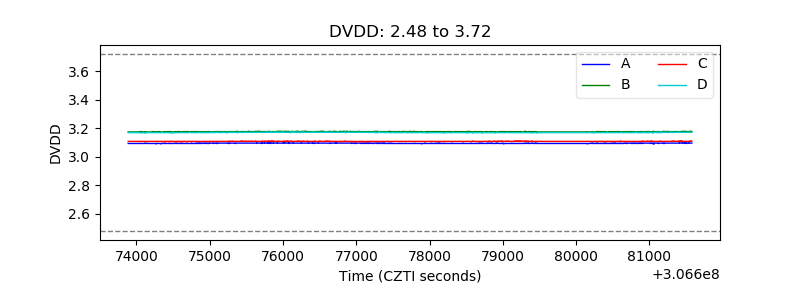 |
| Temperature 1 | 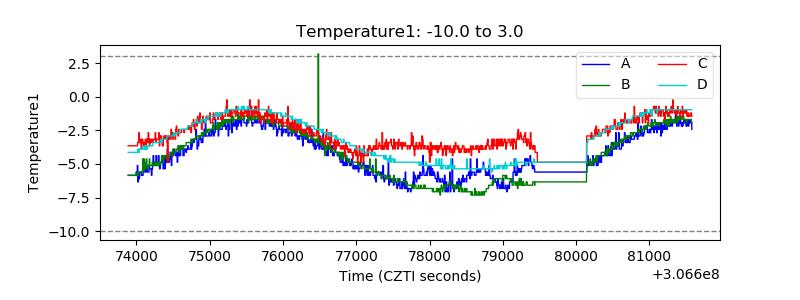 |
| Veto HV Monitor |  |
| Veto LLD | 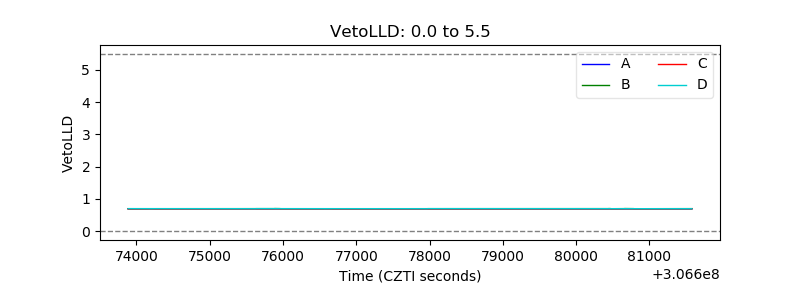 |
| Alpha Counter | 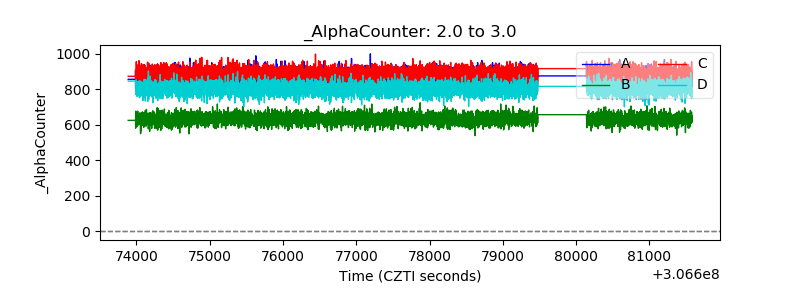 |
| _CPM_Rate | 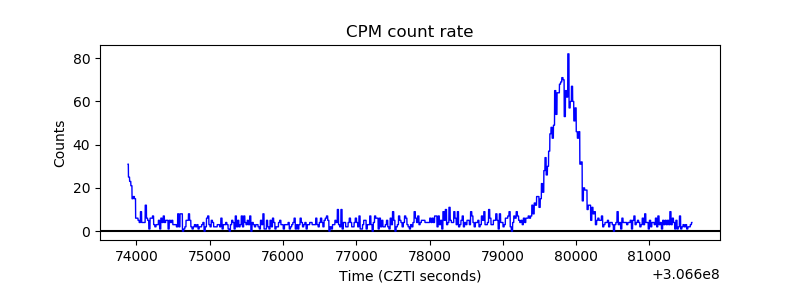 |
| CZT Counter | 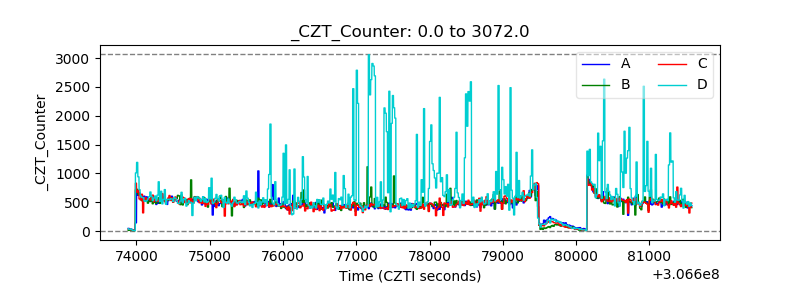 |
| +2.5 Volts monitor |  |
| +5 Volts monitor |  |
| _ROLL_ROT | 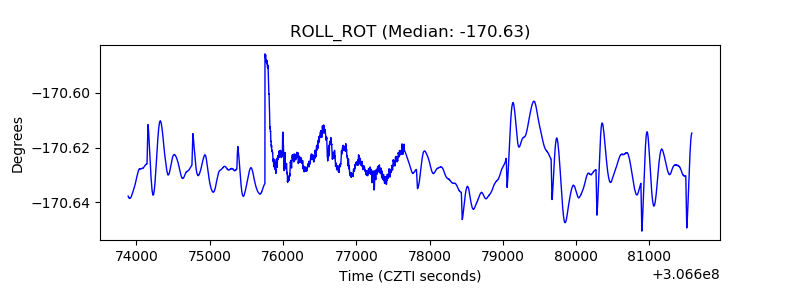 |
| _Roll_DEC | 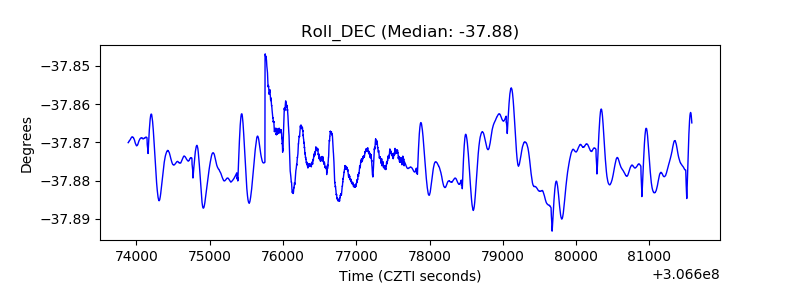 |
| _Roll_RA | 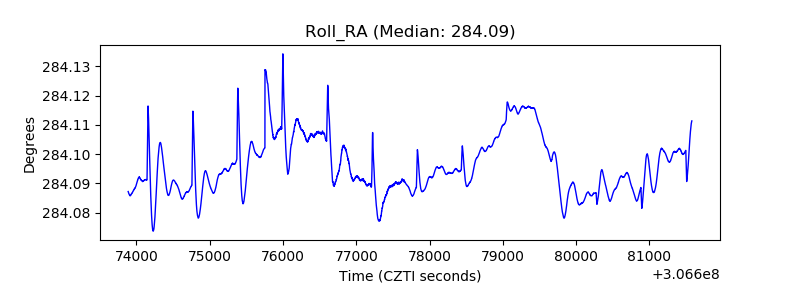 |
| Veto Counter | 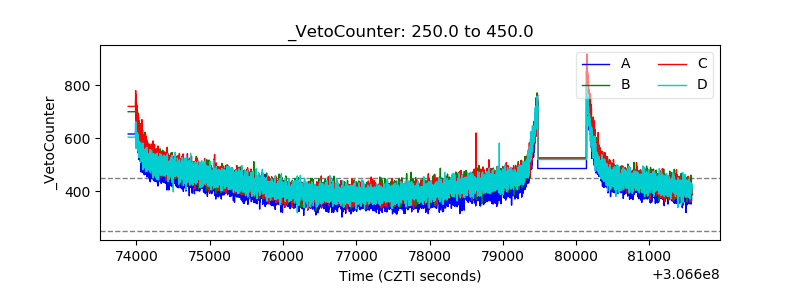 |