| Param | Original file | Final file |
|---|---|---|
| Filename | modeM0/AS1T03_141T01_9000003174_21513cztM0_level2.evt | modeM0/AS1T03_141T01_9000003174_21513cztM0_level2_quad_clean.evt |
| Size (bytes) | 539,020,800 | 105,814,080 |
| Size | 514.1 MB | 100.9 MB |
| Events in quadrant A | 3,615,375 | 681,894 |
| Events in quadrant B | 3,766,743 | 693,055 |
| Events in quadrant C | 3,552,168 | 676,667 |
| Events in quadrant D | 4,893,388 | 643,472 |
| Mode M9 | |||
|---|---|---|---|
| Quadrant | BADHDUFLAG | Total packets | Discarded packets |
| A | 0 | 3 | 0 |
| B | 0 | 3 | 0 |
| C | 0 | 3 | 0 |
| D | 0 | 3 | 0 |
| Mode M0 | |||
|---|---|---|---|
| Quadrant | BADHDUFLAG | Total packets | Discarded packets |
| A | 0 | 15335 | 0 |
| B | 0 | 15722 | 0 |
| C | 0 | 15234 | 0 |
| D | 0 | 19236 | 0 |
| Mode SS | |||
|---|---|---|---|
| Quadrant | BADHDUFLAG | Total packets | Discarded packets |
| A | 0 | 148 | 0 |
| B | 0 | 148 | 0 |
| C | 0 | 148 | 0 |
| D | 0 | 148 | 0 |
| Quadrant | Total seconds | Saturated seconds | Saturation percentage |
|---|---|---|---|
| A | 7318 | 85 | 1.161520% |
| B | 7318 | 146 | 1.995081% |
| C | 7319 | 102 | 1.393633% |
| D | 7319 | 286 | 3.907638% |
Noise dominated data is calculated using 1-second bins in cleaned event files. If a bin has >2000 counts, and if more than 50% of those come from <1% of pixels, then it is considered to be noise-dominated and hence unusable.
| Quadrant | # 1 sec bins | Bins with >0 counts | Bins with >2000 counts | High rate bins dominated by noise | Noise dominated (total time) | Noise dominated (detector-on time) | Marked lightcurve |
|---|---|---|---|---|---|---|---|
| A | 7603 | 7319 | 0 | 0 | 0.00% | 0.00% | 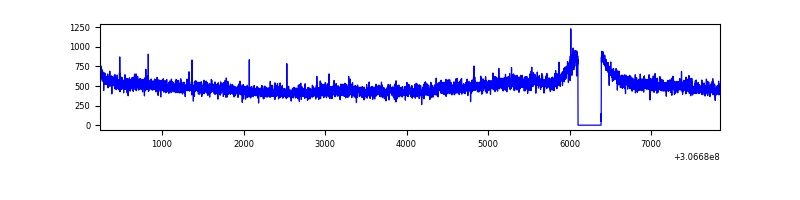 |
| B | 7603 | 7319 | 28 | 28 | 0.37% | 0.38% | 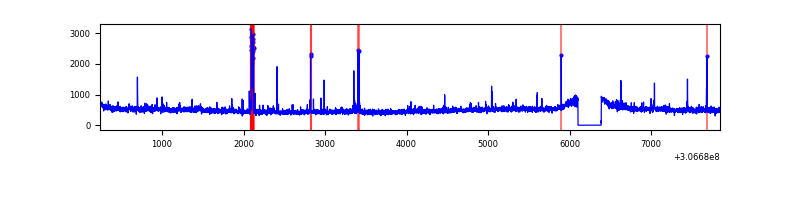 |
| C | 7604 | 7320 | 0 | 0 | 0.00% | 0.00% |  |
| D | 7604 | 7320 | 253 | 253 | 3.33% | 3.46% | 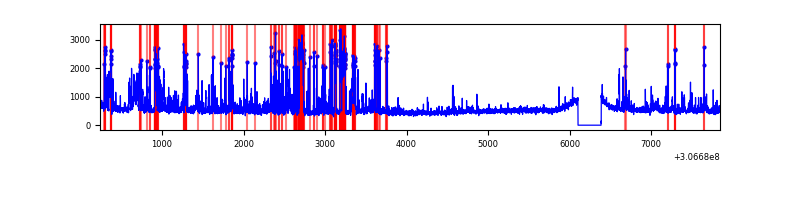 |
Top three noisy pixels from each quadrant. If the there are fewer than three noisy pixels in the level2.evt file, extra rows are filled as -1
| Pixel properties | Quadrant properties | ||||||
|---|---|---|---|---|---|---|---|
| Quadrant | DetID | PixID | Counts | Sigma | Mean | Median | Sigma |
| A | 15 | 48 | 85026 | 457.62 | 915 | 894 | 183.8 |
| A | 13 | 254 | 12595 | 63.65 | 915 | 894 | 183.8 |
| A | 0 | 226 | 8059 | 38.97 | 915 | 894 | 183.8 |
| B | 3 | 64 | 97500 | 553.11 | 908 | 885 | 174.7 |
| B | 0 | 230 | 46307 | 260.04 | 908 | 885 | 174.7 |
| B | 4 | 190 | 28146 | 156.07 | 908 | 885 | 174.7 |
| C | 14 | 238 | 136608 | 657.32 | 875 | 879 | 206.5 |
| C | 13 | 61 | 6082 | 25.2 | 875 | 879 | 206.5 |
| C | 0 | 239 | 4727 | 18.64 | 875 | 879 | 206.5 |
| D | 1 | 52 | 996681 | 4342.89 | 873 | 856 | 229.3 |
| D | 14 | 35 | 219064 | 951.63 | 873 | 856 | 229.3 |
| D | 13 | 153 | 134242 | 581.71 | 873 | 856 | 229.3 |
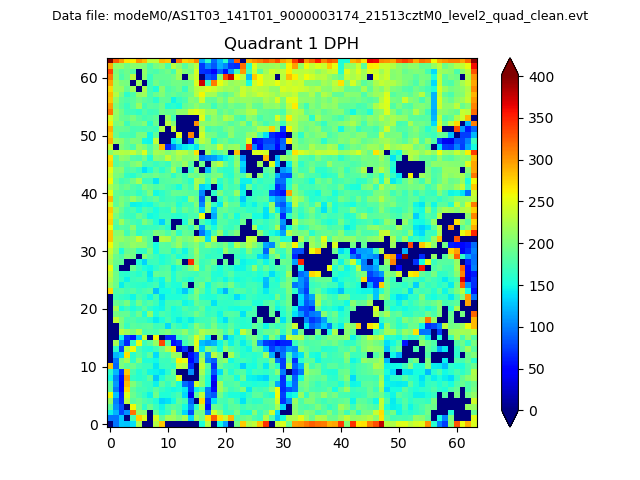
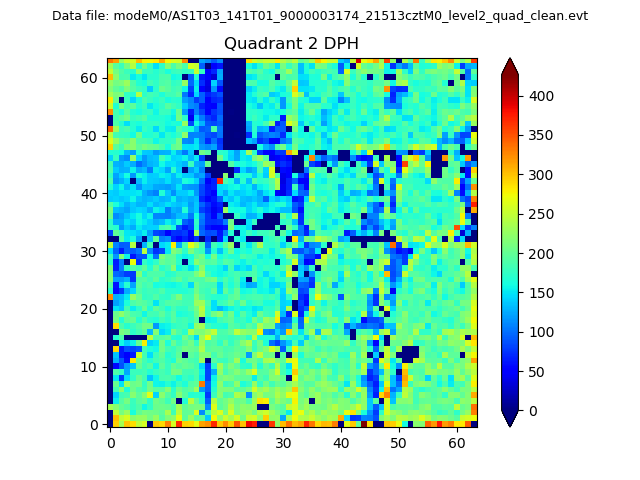
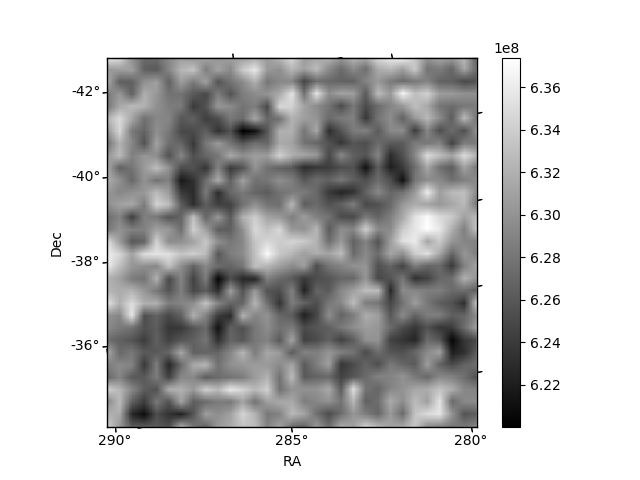
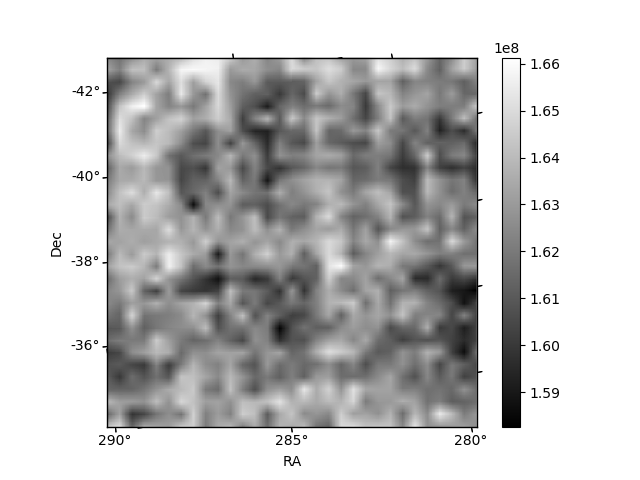
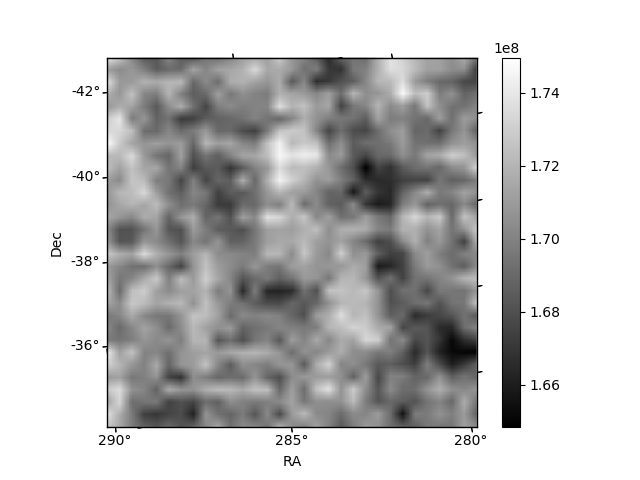
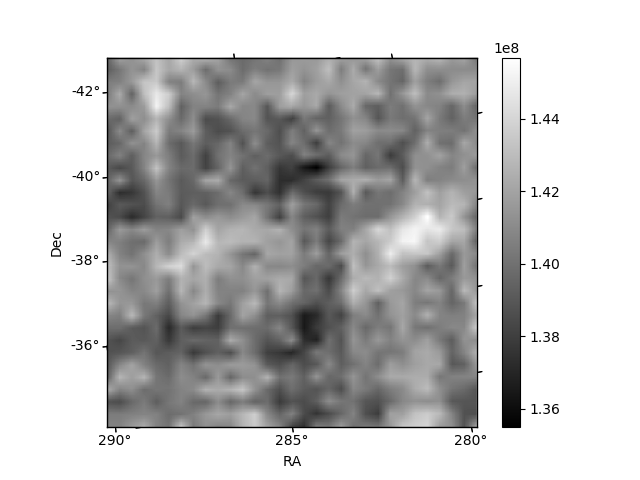
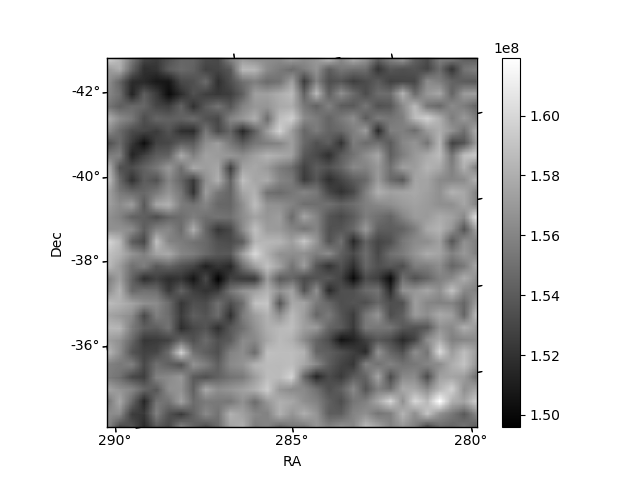
Histogram calculated using DETX and DETY for each event in the final _common_clean file
| Quadrant A | 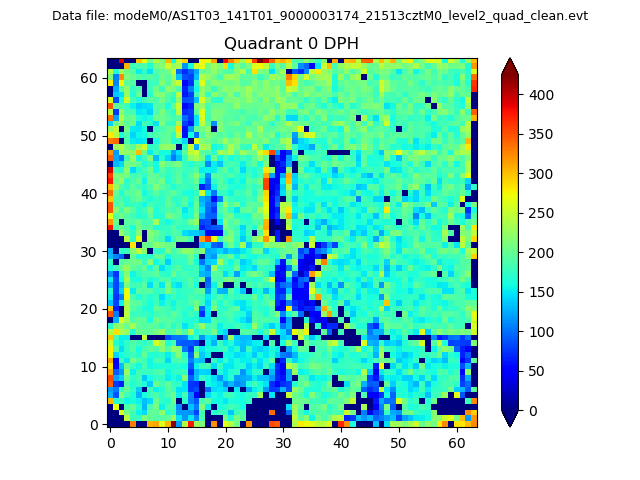 |
 |
Quadrant B |
|---|---|---|---|
| Quadrant D | 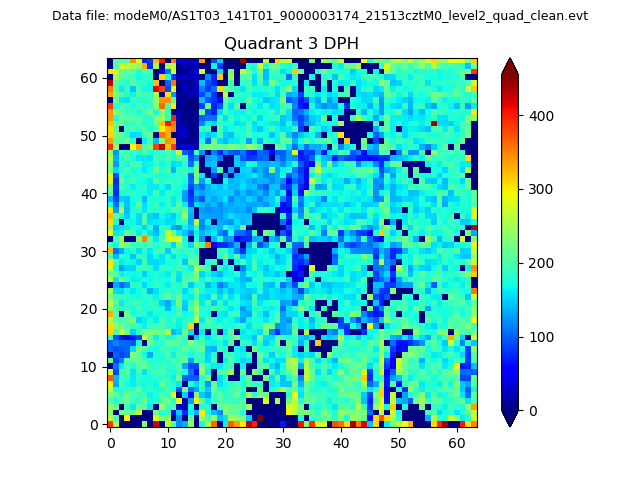 |
 |
Quadrant C |
| Plot type | Count rate plots | Images |
|---|---|---|
| Comparison with Poisson distribution Blue bars denote a histogram of data divided into 1 sec bins. Red curve is a Poisson curve with rate = median count rate of data. |
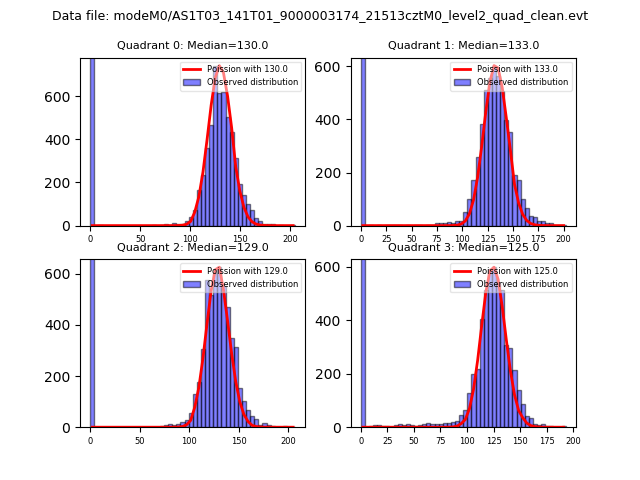 |
 |
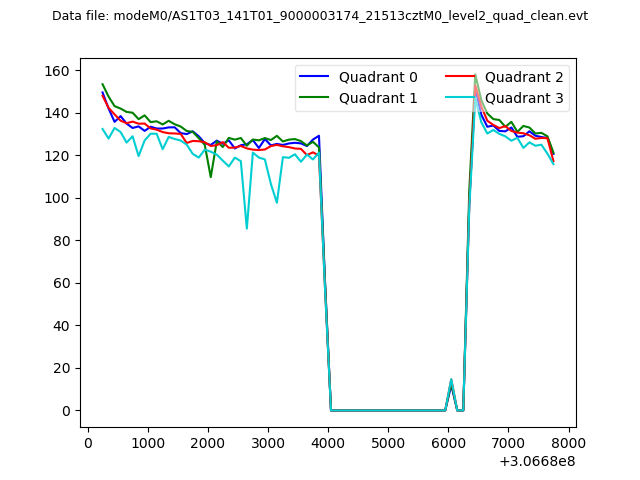
| Quadrant-wise count rates Data is divided into 100 sec bins |
 |
|
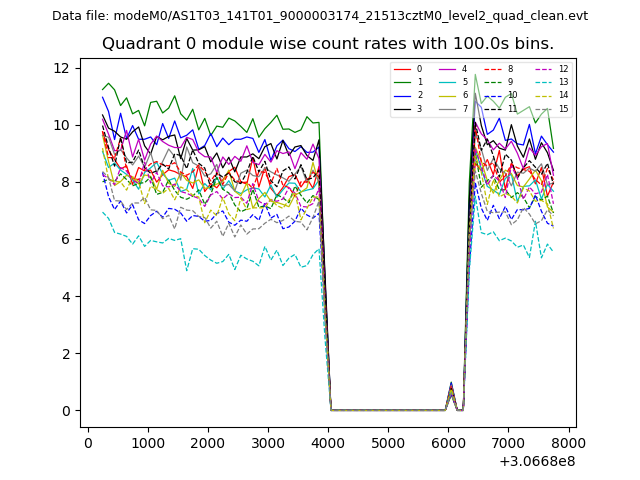
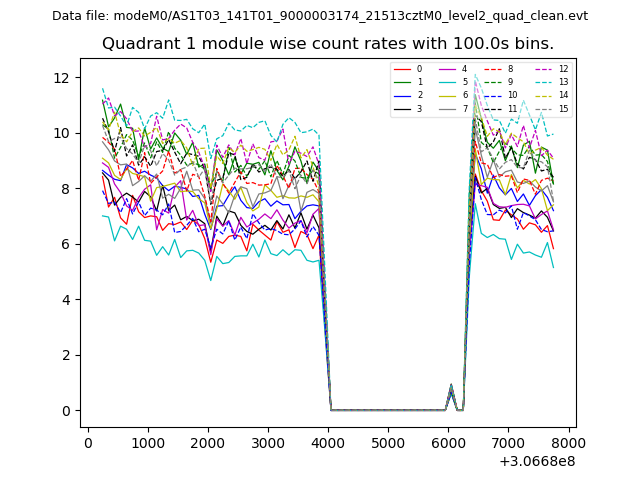
| Module-wise count rates for Quadrant A Data is divided into 100 sec bins |
 |
 |
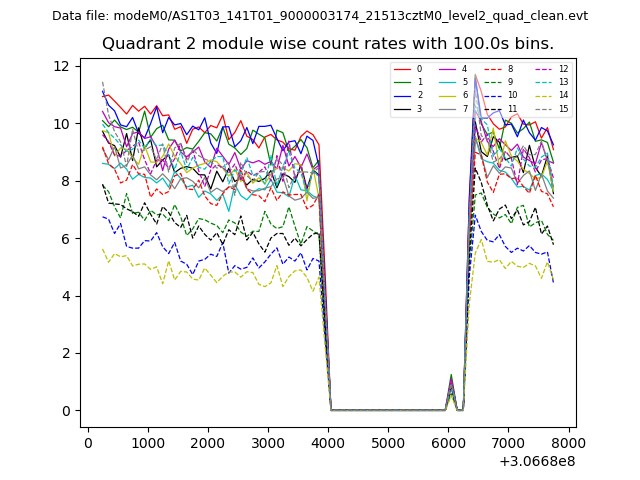
| Module-wise count rates for Quadrant B Data is divided into 100 sec bins |
 |
 |
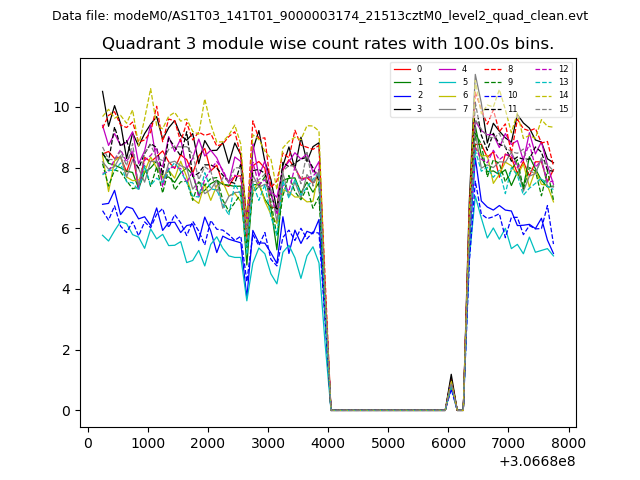
| Module-wise count rates for Quadrant C Data is divided into 100 sec bins |
 |
 |
| Module-wise count rates for Quadrant D Data is divided into 100 sec bins |
 |
 |
| Parameter | Plot |
|---|---|
| CZT HV Monitor | 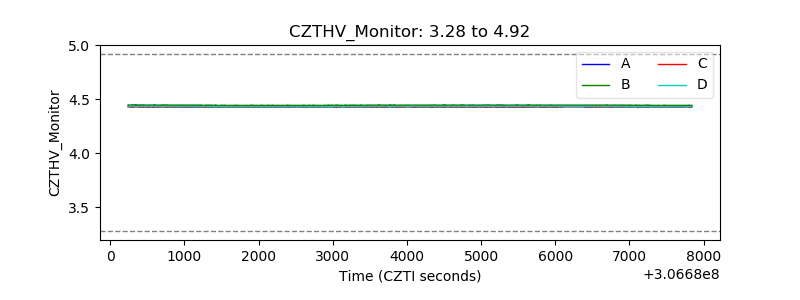 |
| D_VDD | 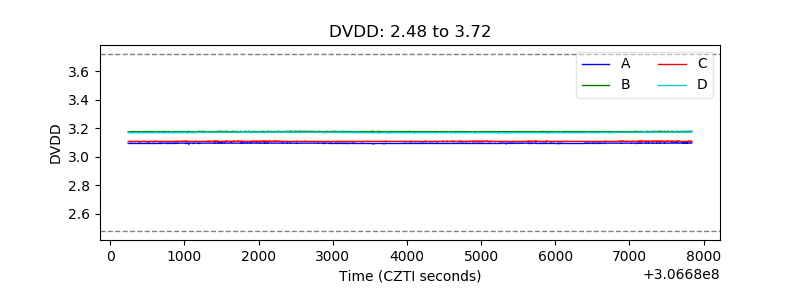 |
| Temperature 1 | 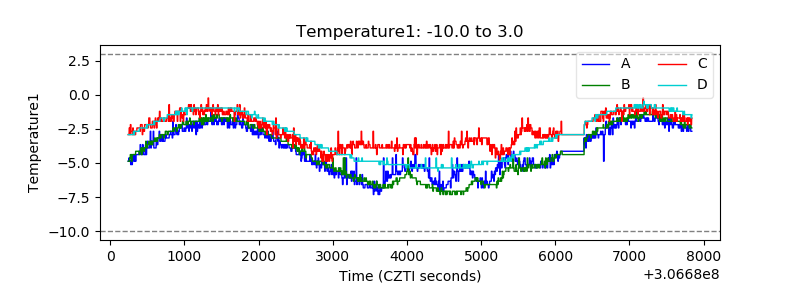 |
| Veto HV Monitor |  |
| Veto LLD | 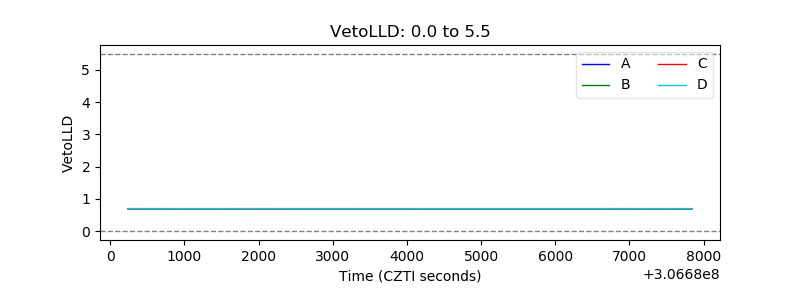 |
| Alpha Counter | 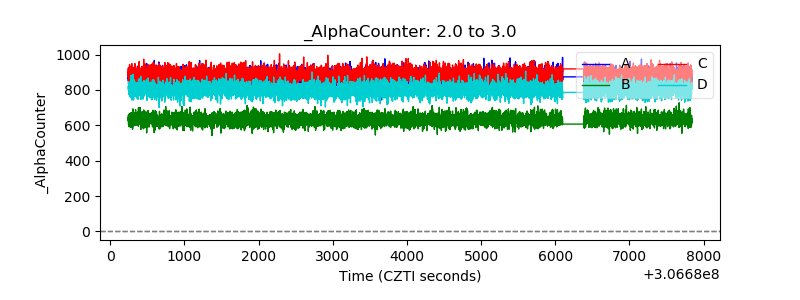 |
| _CPM_Rate | 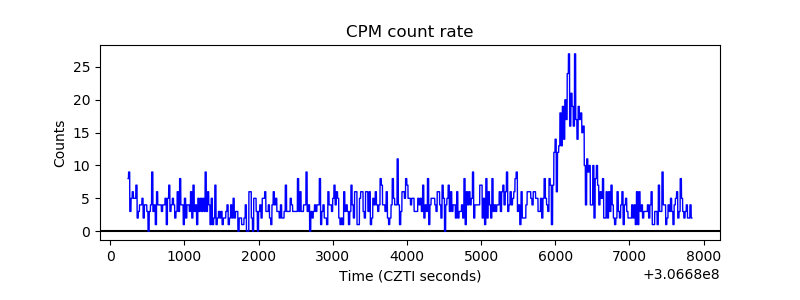 |
| CZT Counter | 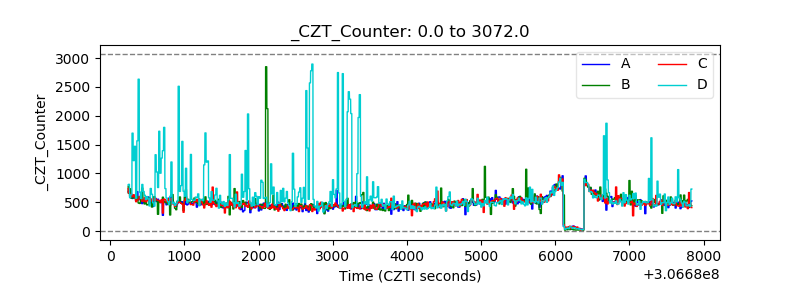 |
| +2.5 Volts monitor |  |
| +5 Volts monitor |  |
| _ROLL_ROT | 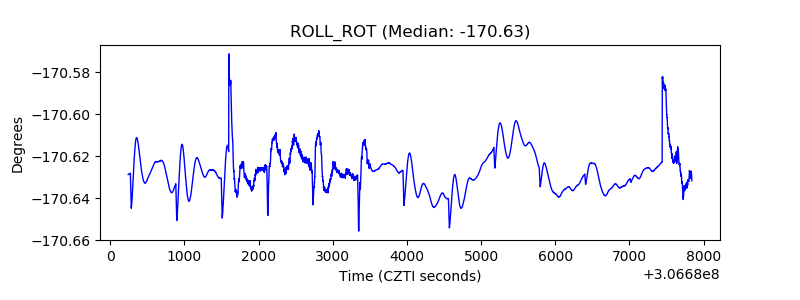 |
| _Roll_DEC | 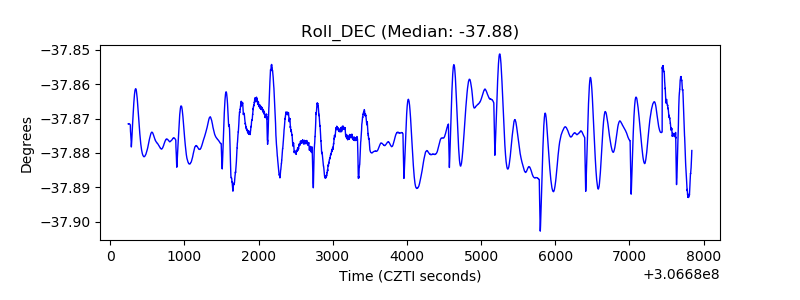 |
| _Roll_RA | 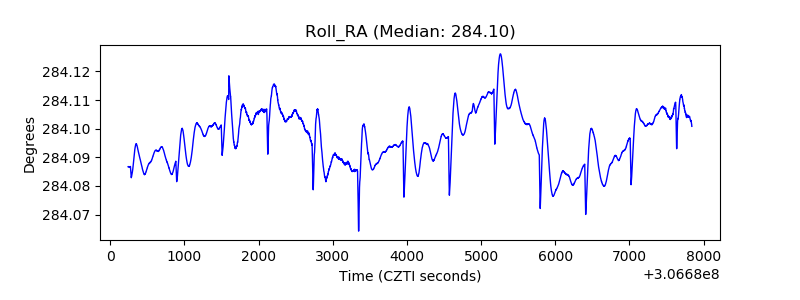 |
| Veto Counter | 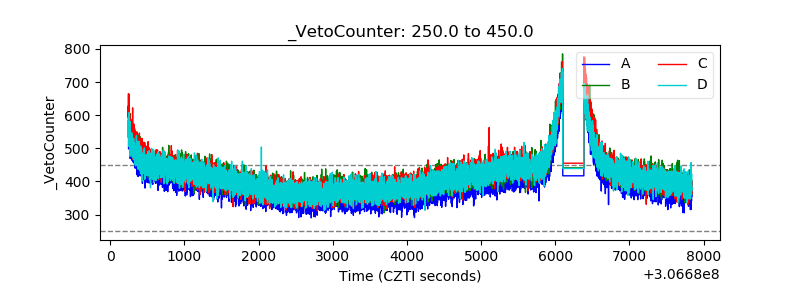 |