| Param | Original file | Final file |
|---|---|---|
| Filename | modeM0/AS1T03_141T01_9000003174_21517cztM0_level2.evt | modeM0/AS1T03_141T01_9000003174_21517cztM0_level2_quad_clean.evt |
| Size (bytes) | 463,734,720 | 81,239,040 |
| Size | 442.3 MB | 77.5 MB |
| Events in quadrant A | 2,855,219 | 518,562 |
| Events in quadrant B | 3,079,334 | 528,694 |
| Events in quadrant C | 2,874,000 | 511,691 |
| Events in quadrant D | 4,818,877 | 472,715 |
| Mode M9 | |||
|---|---|---|---|
| Quadrant | BADHDUFLAG | Total packets | Discarded packets |
| A | 0 | 8 | 0 |
| B | 0 | 9 | 0 |
| C | 0 | 9 | 0 |
| D | 0 | 9 | 0 |
| Mode M0 | |||
|---|---|---|---|
| Quadrant | BADHDUFLAG | Total packets | Discarded packets |
| A | 0 | 12575 | 0 |
| B | 0 | 13080 | 0 |
| C | 0 | 12609 | 0 |
| D | 0 | 18457 | 0 |
| Mode SS | |||
|---|---|---|---|
| Quadrant | BADHDUFLAG | Total packets | Discarded packets |
| A | 0 | 124 | 0 |
| B | 0 | 124 | 0 |
| C | 0 | 124 | 0 |
| D | 0 | 124 | 0 |
| Quadrant | Total seconds | Saturated seconds | Saturation percentage |
|---|---|---|---|
| A | 6137 | 24 | 0.391071% |
| B | 6137 | 51 | 0.831025% |
| C | 6137 | 57 | 0.928793% |
| D | 6137 | 440 | 7.169627% |
Noise dominated data is calculated using 1-second bins in cleaned event files. If a bin has >2000 counts, and if more than 50% of those come from <1% of pixels, then it is considered to be noise-dominated and hence unusable.
| Quadrant | # 1 sec bins | Bins with >0 counts | Bins with >2000 counts | High rate bins dominated by noise | Noise dominated (total time) | Noise dominated (detector-on time) | Marked lightcurve |
|---|---|---|---|---|---|---|---|
| A | 6717 | 6138 | 0 | 0 | 0.00% | 0.00% | 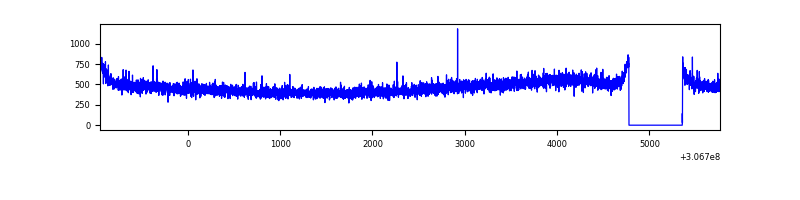 |
| B | 6717 | 6138 | 3 | 3 | 0.04% | 0.05% | 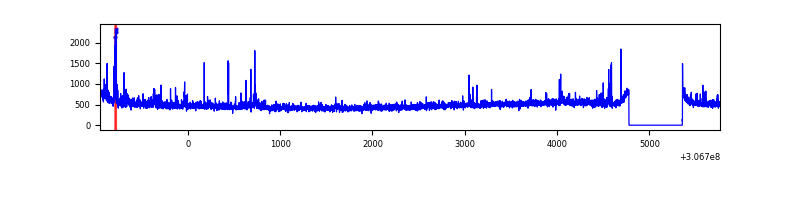 |
| C | 6717 | 6138 | 1 | 1 | 0.01% | 0.02% | 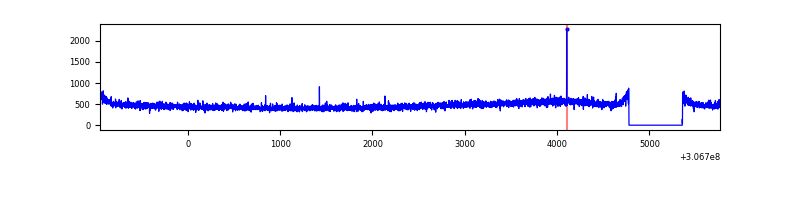 |
| D | 6717 | 6138 | 393 | 393 | 5.85% | 6.40% | 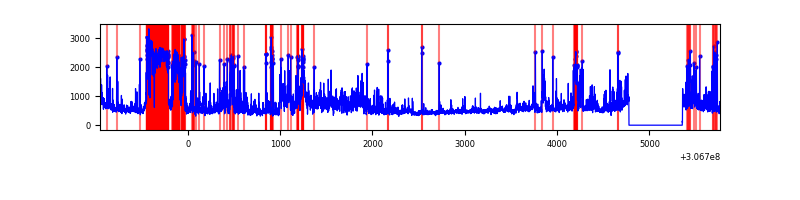 |
Top three noisy pixels from each quadrant. If the there are fewer than three noisy pixels in the level2.evt file, extra rows are filled as -1
| Pixel properties | Quadrant properties | ||||||
|---|---|---|---|---|---|---|---|
| Quadrant | DetID | PixID | Counts | Sigma | Mean | Median | Sigma |
| A | 13 | 254 | 10396 | 64.74 | 740 | 724 | 149.4 |
| A | 3 | 137 | 6463 | 38.41 | 740 | 724 | 149.4 |
| A | 0 | 226 | 6447 | 38.31 | 740 | 724 | 149.4 |
| B | 0 | 230 | 56408 | 392.33 | 738 | 718 | 141.9 |
| B | 0 | 189 | 37947 | 262.27 | 738 | 718 | 141.9 |
| B | 3 | 64 | 23068 | 157.45 | 738 | 718 | 141.9 |
| C | 14 | 238 | 110829 | 663.79 | 707 | 710 | 165.9 |
| C | 13 | 61 | 4836 | 24.87 | 707 | 710 | 165.9 |
| C | 0 | 239 | 3424 | 16.36 | 707 | 710 | 165.9 |
| D | 13 | 174 | 495910 | 2947.09 | 695 | 673 | 168.0 |
| D | 7 | 38 | 426089 | 2531.59 | 695 | 673 | 168.0 |
| D | 13 | 153 | 343362 | 2039.3 | 695 | 673 | 168.0 |
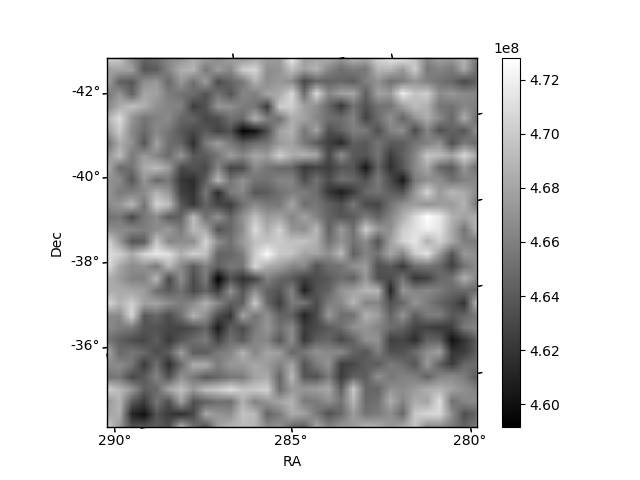
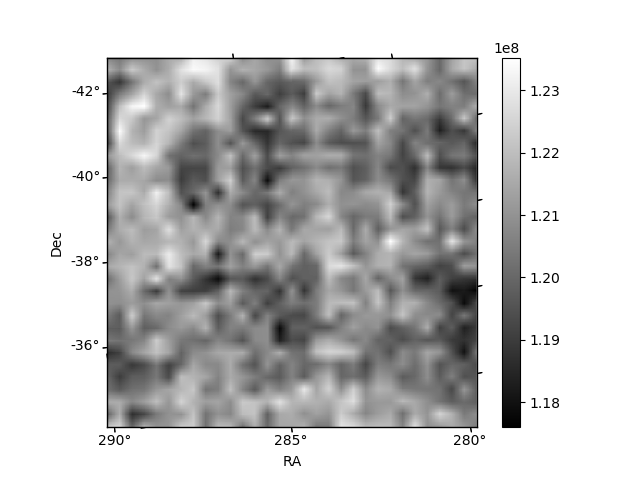
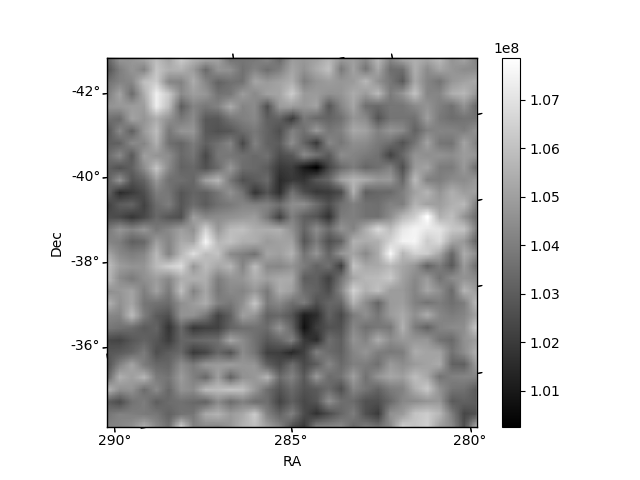
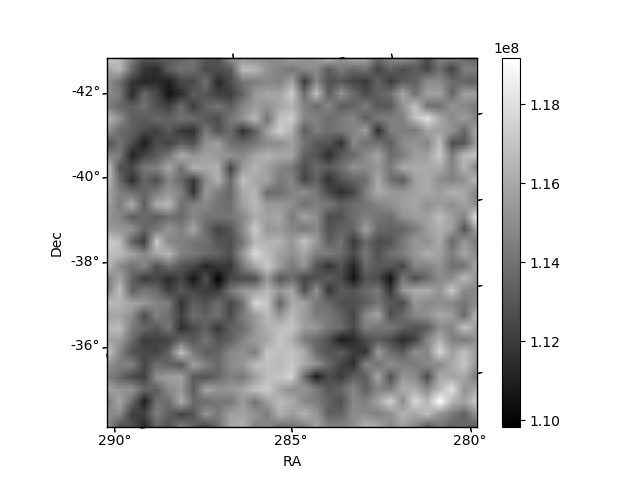
Histogram calculated using DETX and DETY for each event in the final _common_clean file
| Quadrant A | 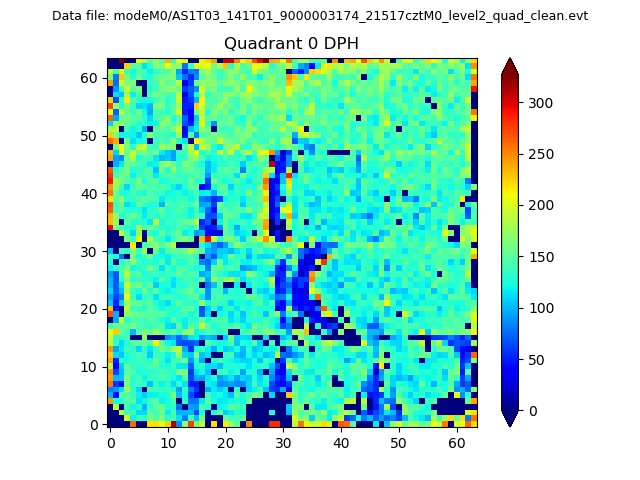 |
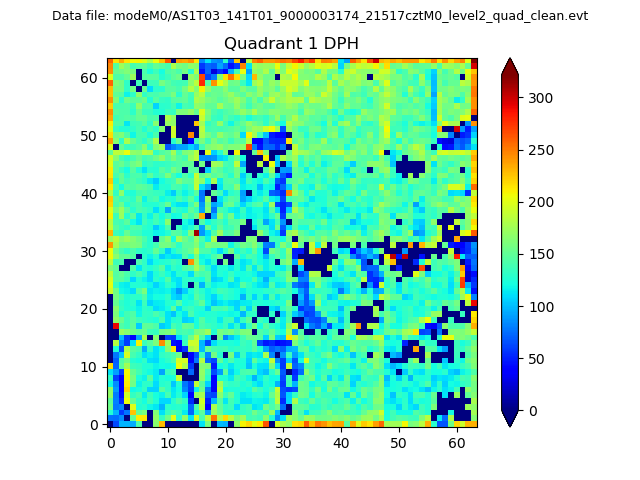 |
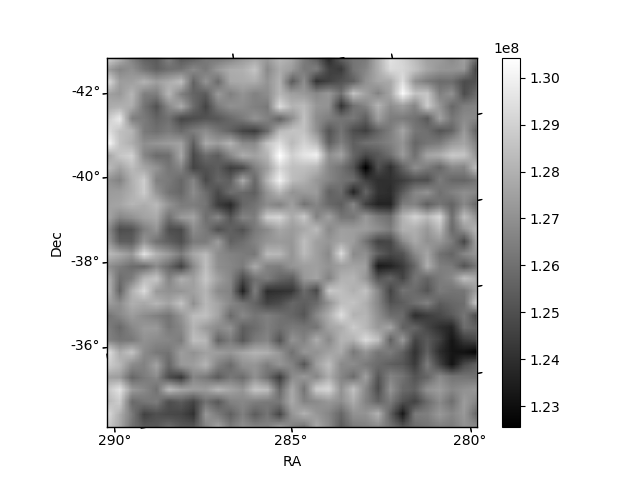
Quadrant B |
|---|---|---|---|
| Quadrant D | 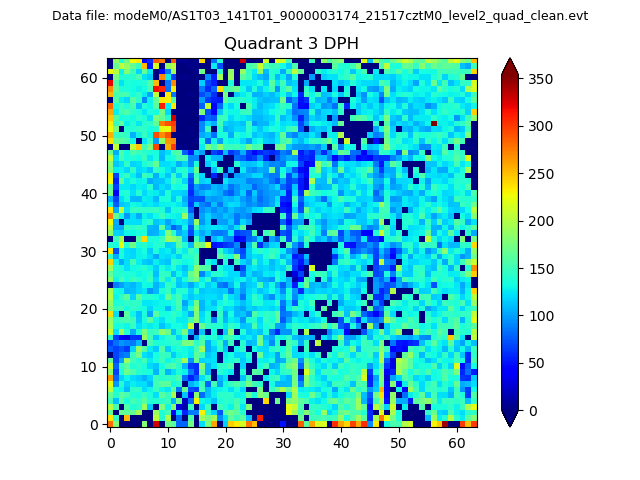 |
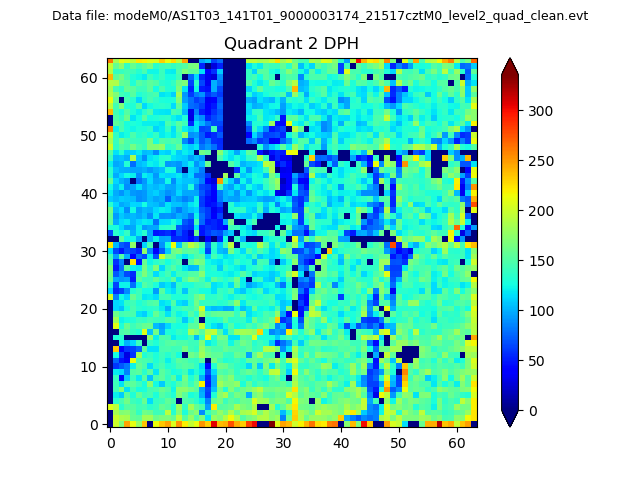 |
Quadrant C |
| Plot type | Count rate plots | Images |
|---|---|---|
| Comparison with Poisson distribution Blue bars denote a histogram of data divided into 1 sec bins. Red curve is a Poisson curve with rate = median count rate of data. |
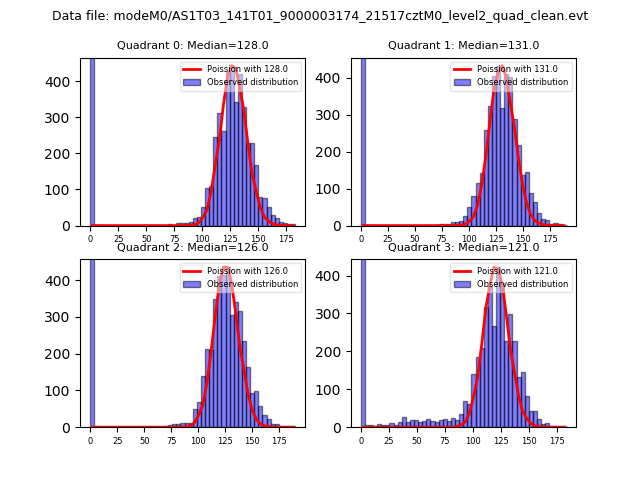 |
 |
| Quadrant-wise count rates Data is divided into 100 sec bins |
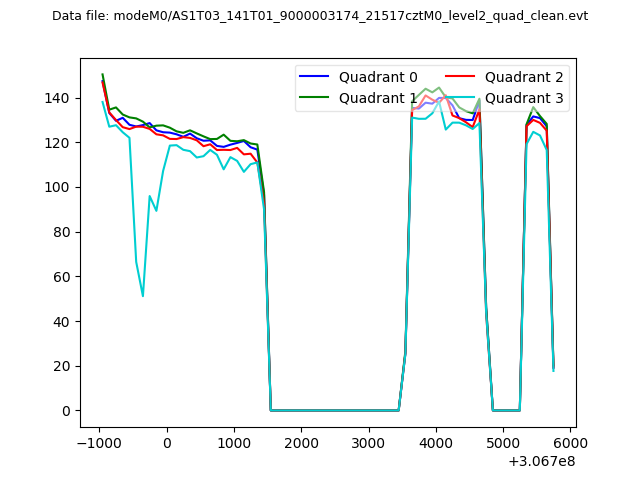 |
|
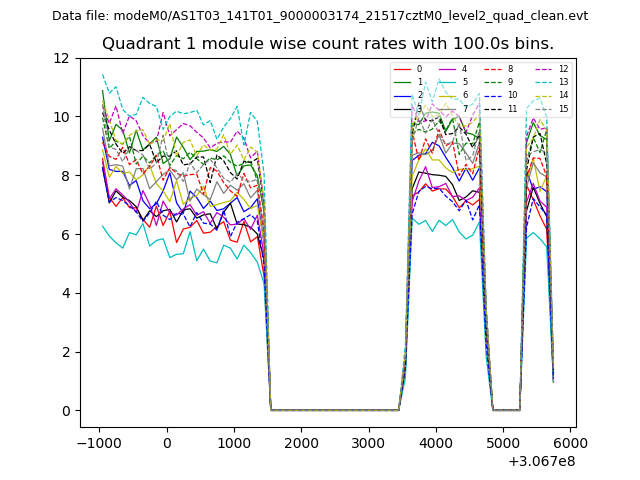
| Module-wise count rates for Quadrant A Data is divided into 100 sec bins |
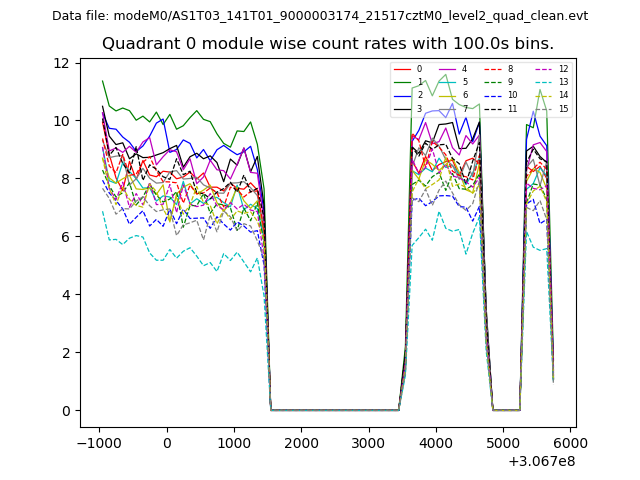 |
 |
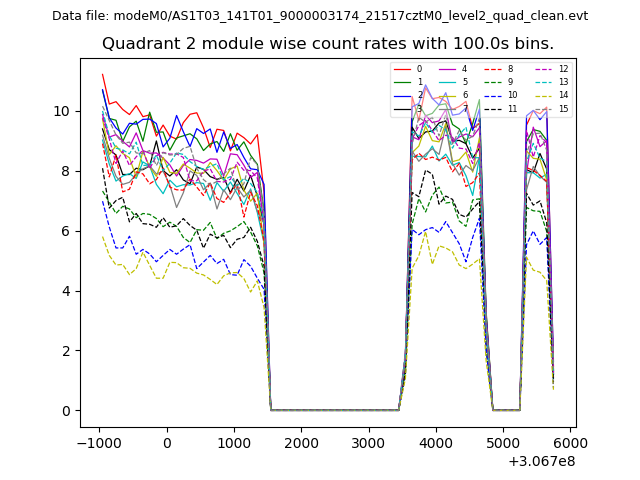
| Module-wise count rates for Quadrant B Data is divided into 100 sec bins |
 |
 |
| Module-wise count rates for Quadrant C Data is divided into 100 sec bins |
 |
 |
| Module-wise count rates for Quadrant D Data is divided into 100 sec bins |
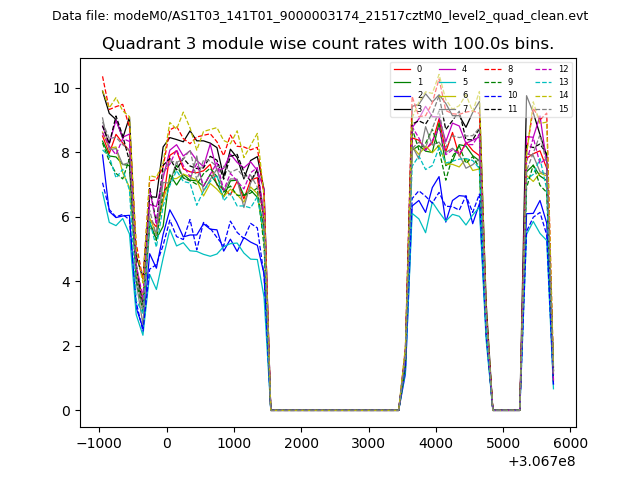 |
 |
| Parameter | Plot |
|---|---|
| CZT HV Monitor | 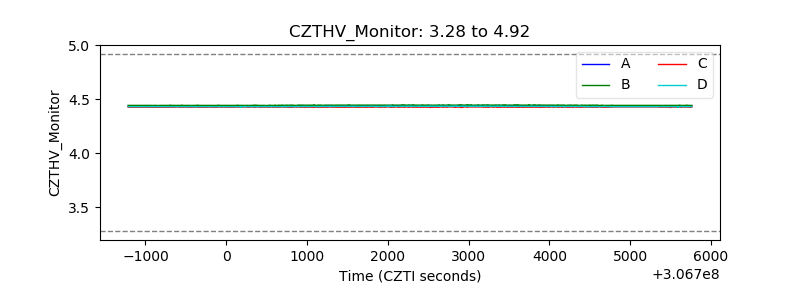 |
| D_VDD | 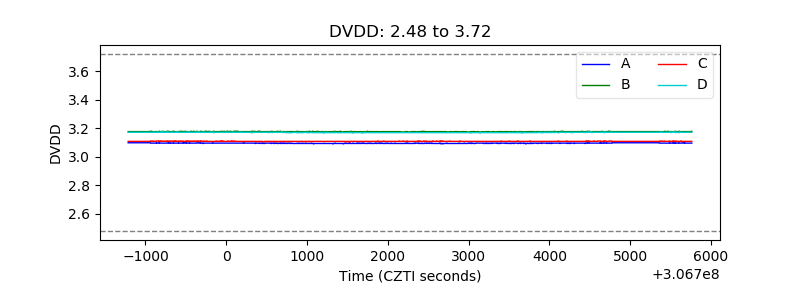 |
| Temperature 1 | 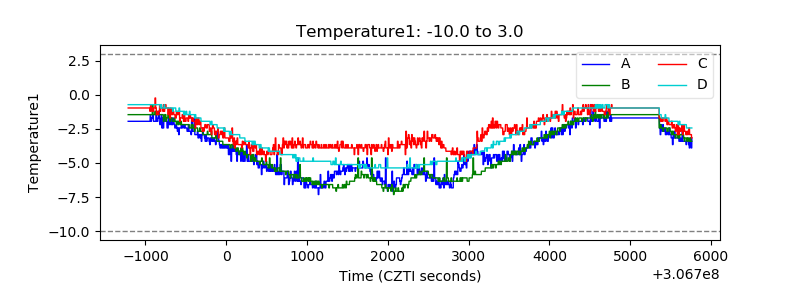 |
| Veto HV Monitor | 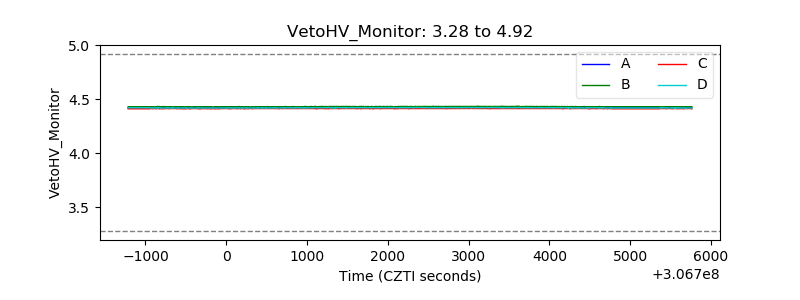 |
| Veto LLD | 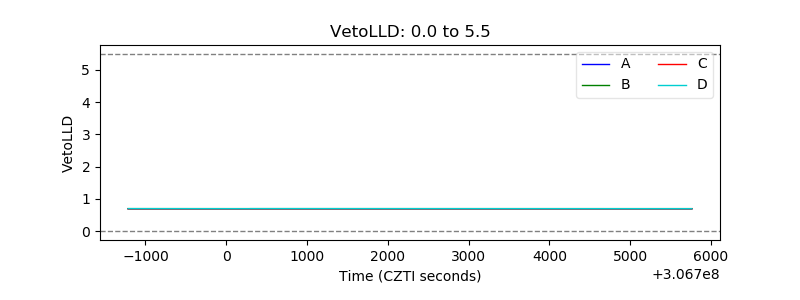 |
| Alpha Counter | 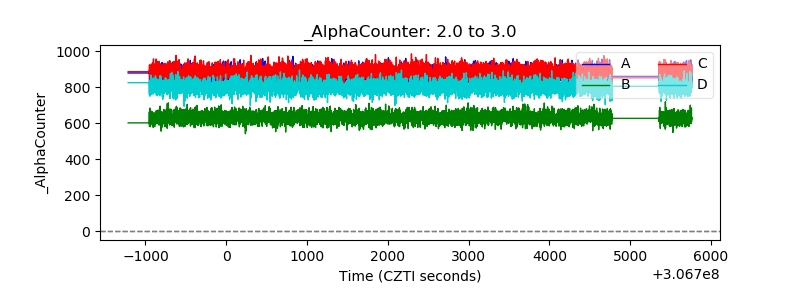 |
| _CPM_Rate | 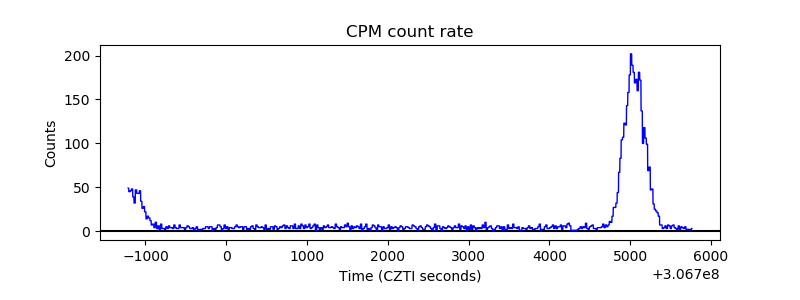 |
| CZT Counter | 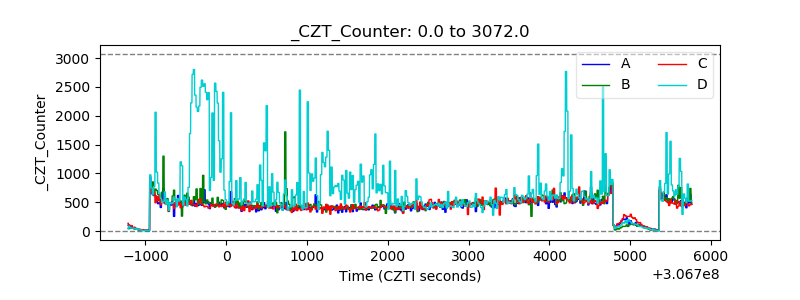 |
| +2.5 Volts monitor |  |
| +5 Volts monitor |  |
| _ROLL_ROT | 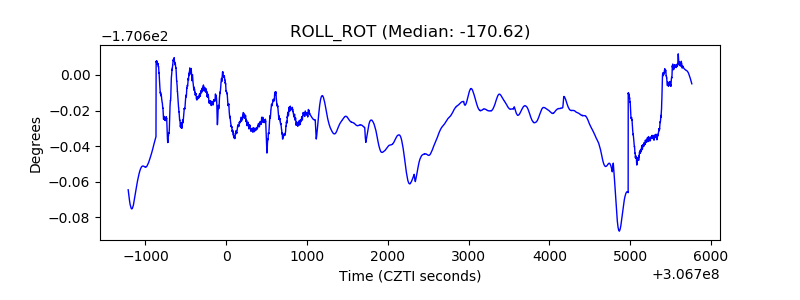 |
| _Roll_DEC | 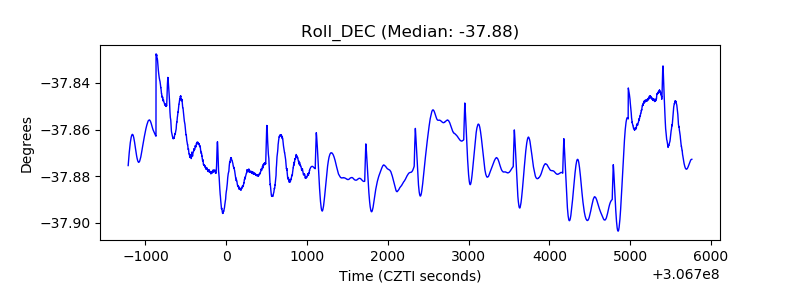 |
| _Roll_RA | 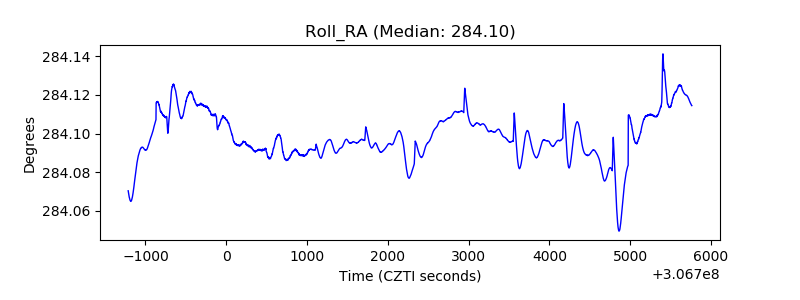 |
| Veto Counter |  |