| Param | Original file | Final file |
|---|---|---|
| Filename | modeM0/AS1A05_144T02_9000003176cztM0_level2.fits | modeM0/AS1A05_144T02_9000003176cztM0_level2_quad_clean.evt |
| Size (bytes) | 844,804,800 | 813,864,960 |
| Size | 805.7 MB | 776.2 MB |
| Events in quadrant A | 5,226,924 | 4,825,767 |
| Events in quadrant B | 4,983,680 | 4,849,500 |
| Events in quadrant C | 5,061,318 | 4,728,108 |
| Events in quadrant D | 4,300,170 | 4,234,475 |
| Mode M9 | |||
|---|---|---|---|
| Quadrant | BADHDUFLAG | Total packets | Discarded packets |
| A | 0 | 141 | 0 |
| B | 0 | 141 | 0 |
| C | 0 | 141 | 0 |
| D | 0 | 141 | 0 |
| Mode M0 | |||
|---|---|---|---|
| Quadrant | BADHDUFLAG | Total packets | Discarded packets |
| A | 0 | 179392 | 0 |
| B | 0 | 183832 | 0 |
| C | 0 | 198418 | 0 |
| D | 0 | 254785 | 0 |
| Mode SS | |||
|---|---|---|---|
| Quadrant | BADHDUFLAG | Total packets | Discarded packets |
| A | 0 | 1790 | 0 |
| B | 0 | 1792 | 0 |
| C | 0 | 1788 | 0 |
| D | 0 | 1782 | 0 |
| Quadrant | Total seconds | Saturated seconds | Saturation percentage |
|---|---|---|---|
| A | 87676 | 651 | 0.742507% |
| B | 87710 | 844 | 0.962262% |
| C | 87719 | 2174 | 2.478368% |
| D | 87541 | 5766 | 6.586628% |
Noise dominated data is calculated using 1-second bins in cleaned event files. If a bin has >2000 counts, and if more than 50% of those come from <1% of pixels, then it is considered to be noise-dominated and hence unusable.
| Quadrant | # 1 sec bins | Bins with >0 counts | Bins with >2000 counts | High rate bins dominated by noise | Noise dominated (total time) | Noise dominated (detector-on time) | Marked lightcurve |
|---|---|---|---|---|---|---|---|
| A | 102544 | 88094 | 0 | 0 | 0.00% | 0.00% |  |
| B | 102544 | 88107 | 0 | 0 | 0.00% | 0.00% | 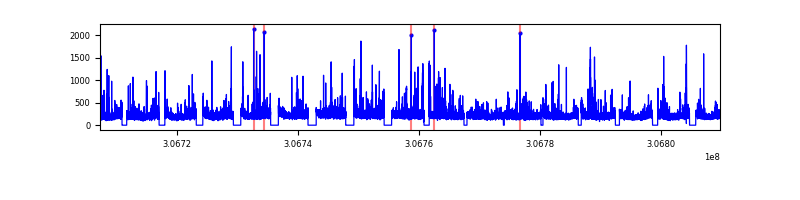 |
| C | 102543 | 88136 | 0 | 0 | 0.00% | 0.00% |  |
| D | 102543 | 87905 | 0 | 0 | 0.00% | 0.00% | 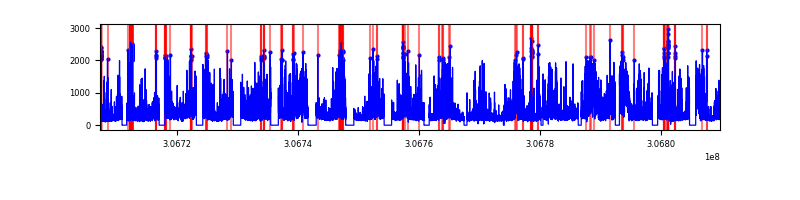 |
Top three noisy pixels from each quadrant. If the there are fewer than three noisy pixels in the level2.evt file, extra rows are filled as -1
| Pixel properties | Quadrant properties | ||||||
|---|---|---|---|---|---|---|---|
| Quadrant | DetID | PixID | Counts | Sigma | Mean | Median | Sigma |
| A | 0 | 29 | 5140 | 11.42 | 1362 | 1281 | 337.9 |
| A | 7 | 110 | 4047 | 8.19 | 1362 | 1281 | 337.9 |
| A | 0 | 30 | 3984 | 8.0 | 1362 | 1281 | 337.9 |
| B | 2 | 9 | 3968 | 10.58 | 1317 | 1262 | 255.7 |
| B | 2 | 8 | 3376 | 8.27 | 1317 | 1262 | 255.7 |
| B | 5 | 255 | 3314 | 8.02 | 1317 | 1262 | 255.7 |
| C | 12 | 241 | 3530 | 6.66 | 1337 | 1253 | 341.8 |
| C | 9 | 209 | 3489 | 6.54 | 1337 | 1253 | 341.8 |
| C | 3 | 126 | 3414 | 6.32 | 1337 | 1253 | 341.8 |
| D | 10 | 189 | 3053 | 5.91 | 1229 | 1124 | 326.6 |
| D | 7 | 3 | 3037 | 5.86 | 1229 | 1124 | 326.6 |
| D | 3 | 14 | 3031 | 5.84 | 1229 | 1124 | 326.6 |
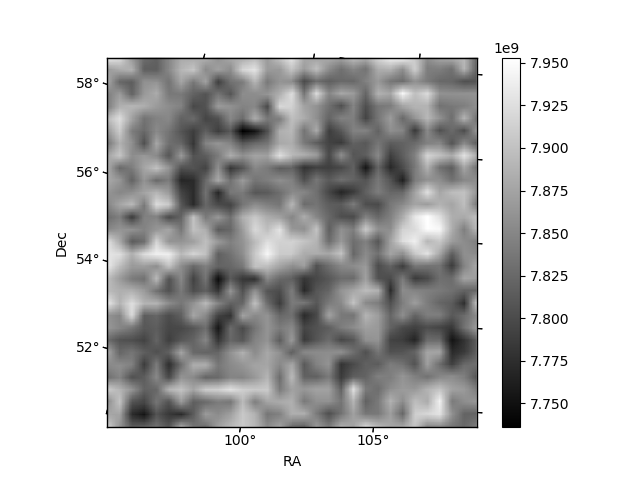
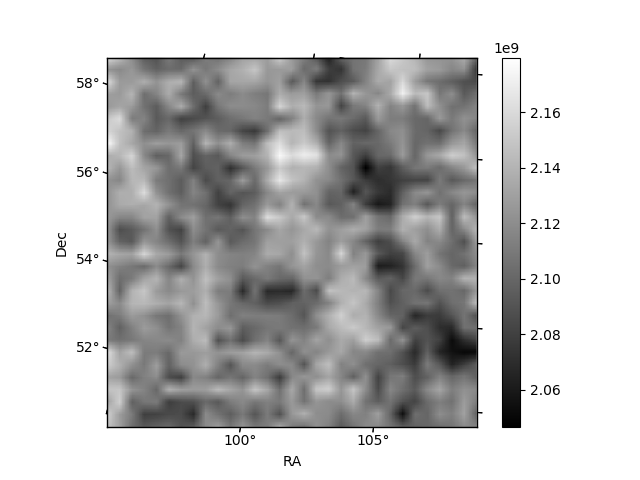
Histogram calculated using DETX and DETY for each event in the final _common_clean file
| Quadrant A |  |
 |
Quadrant B |
|---|---|---|---|
| Quadrant D | 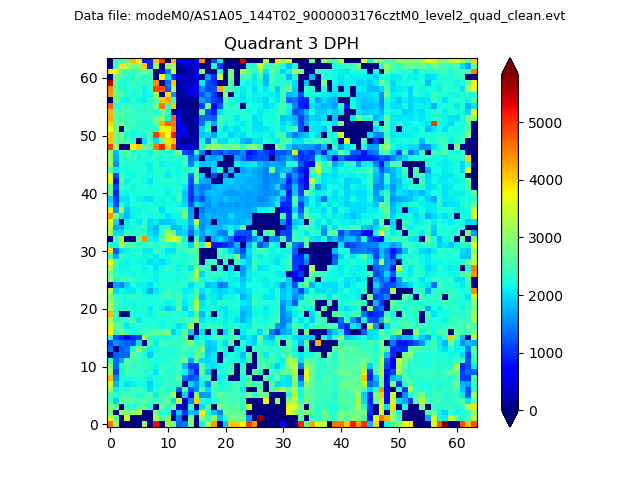 |
 |
Quadrant C |
| Plot type | Count rate plots | Images |
|---|---|---|
| Comparison with Poisson distribution Blue bars denote a histogram of data divided into 1 sec bins. Red curve is a Poisson curve with rate = median count rate of data. |
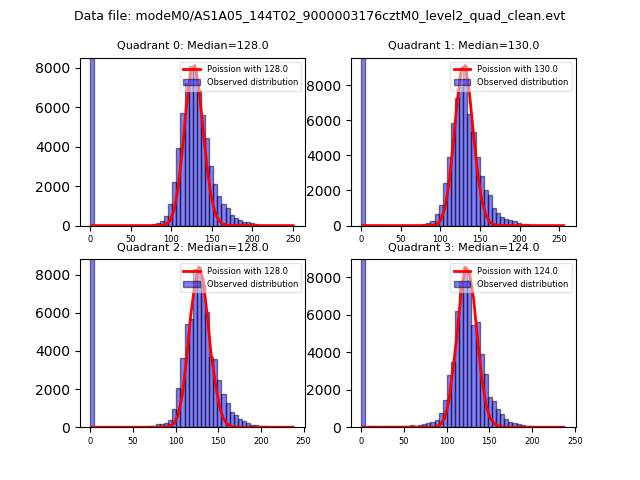 |
 |
| Quadrant-wise count rates Data is divided into 100 sec bins |
 |
|
| Module-wise count rates for Quadrant A Data is divided into 100 sec bins |
 |
 |
| Module-wise count rates for Quadrant B Data is divided into 100 sec bins |
 |
 |
| Module-wise count rates for Quadrant C Data is divided into 100 sec bins |
 |
 |
| Module-wise count rates for Quadrant D Data is divided into 100 sec bins |
 |
 |
| Parameter | Plot |
|---|---|
| CZT HV Monitor |  |
| D_VDD |  |
| Temperature 1 |  |
| Veto HV Monitor |  |
| Veto LLD |  |
| Alpha Counter |  |
| _CPM_Rate | 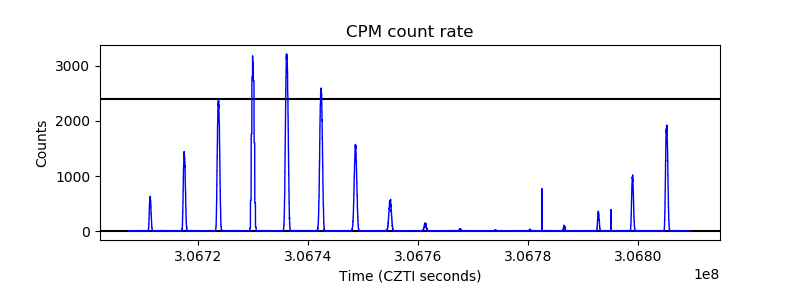 |
| CZT Counter |  |
| +2.5 Volts monitor |  |
| +5 Volts monitor |  |
| _ROLL_ROT | 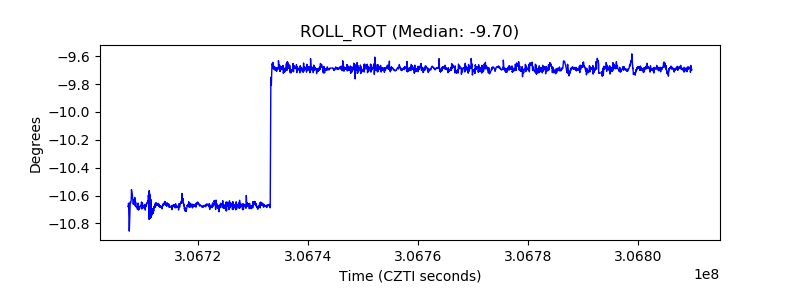 |
| _Roll_DEC |  |
| _Roll_RA | 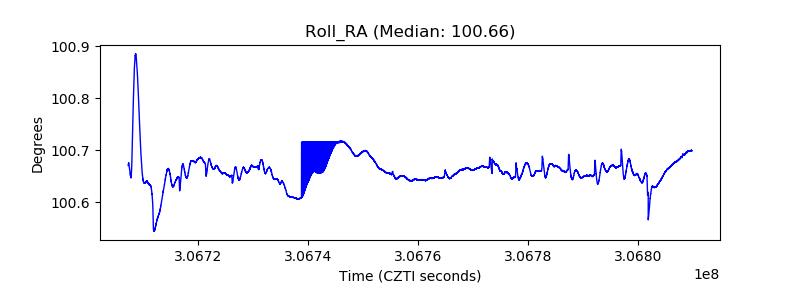 |
| Veto Counter |  |