| Param | Original file | Final file |
|---|---|---|
| Filename | modeM0/AS1A05_144T02_9000003176_21518cztM0_level2.evt | modeM0/AS1A05_144T02_9000003176_21518cztM0_level2_quad_clean.evt |
| Size (bytes) | 493,194,240 | 108,671,040 |
| Size | 470.3 MB | 103.6 MB |
| Events in quadrant A | 3,202,318 | 702,494 |
| Events in quadrant B | 3,339,820 | 719,389 |
| Events in quadrant C | 3,287,695 | 709,861 |
| Events in quadrant D | 4,632,668 | 673,416 |
| Mode M9 | |||
|---|---|---|---|
| Quadrant | BADHDUFLAG | Total packets | Discarded packets |
| A | 0 | 17 | 0 |
| B | 0 | 17 | 0 |
| C | 0 | 17 | 0 |
| D | 0 | 17 | 0 |
| Mode M0 | |||
|---|---|---|---|
| Quadrant | BADHDUFLAG | Total packets | Discarded packets |
| A | 0 | 14229 | 2 |
| B | 0 | 14577 | 2 |
| C | 0 | 14350 | 2 |
| D | 0 | 18651 | 3 |
| Mode SS | |||
|---|---|---|---|
| Quadrant | BADHDUFLAG | Total packets | Discarded packets |
| A | 0 | 144 | 0 |
| B | 0 | 144 | 0 |
| C | 0 | 144 | 0 |
| D | 0 | 144 | 0 |
| Quadrant | Total seconds | Saturated seconds | Saturation percentage |
|---|---|---|---|
| A | 6976 | 16 | 0.229358% |
| B | 6977 | 30 | 0.429984% |
| C | 6977 | 78 | 1.117959% |
| D | 6976 | 319 | 4.572821% |
Noise dominated data is calculated using 1-second bins in cleaned event files. If a bin has >2000 counts, and if more than 50% of those come from <1% of pixels, then it is considered to be noise-dominated and hence unusable.
| Quadrant | # 1 sec bins | Bins with >0 counts | Bins with >2000 counts | High rate bins dominated by noise | Noise dominated (total time) | Noise dominated (detector-on time) | Marked lightcurve |
|---|---|---|---|---|---|---|---|
| A | 8706 | 6978 | 0 | 0 | 0.00% | 0.00% | 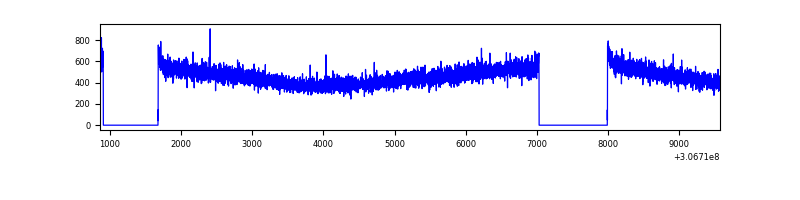 |
| B | 8707 | 6979 | 1 | 1 | 0.01% | 0.01% | 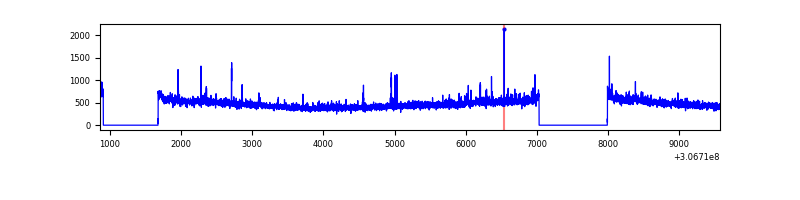 |
| C | 8707 | 6979 | 1 | 1 | 0.01% | 0.01% | 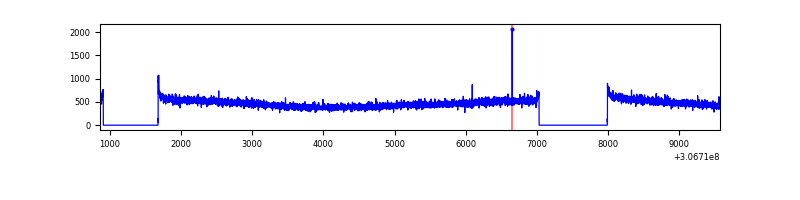 |
| D | 8706 | 6978 | 267 | 267 | 3.07% | 3.83% | 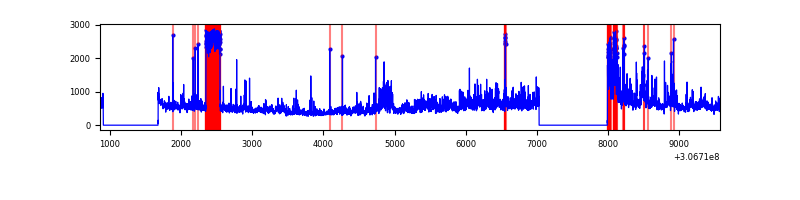 |
Top three noisy pixels from each quadrant. If the there are fewer than three noisy pixels in the level2.evt file, extra rows are filled as -1
| Pixel properties | Quadrant properties | ||||||
|---|---|---|---|---|---|---|---|
| Quadrant | DetID | PixID | Counts | Sigma | Mean | Median | Sigma |
| A | 13 | 254 | 11323 | 62.73 | 828 | 809 | 167.6 |
| A | 15 | 48 | 7522 | 40.05 | 828 | 809 | 167.6 |
| A | 0 | 226 | 7035 | 37.14 | 828 | 809 | 167.6 |
| B | 0 | 230 | 34115 | 209.65 | 831 | 810 | 158.9 |
| B | 12 | 111 | 19291 | 116.33 | 831 | 810 | 158.9 |
| B | 11 | 111 | 16812 | 100.73 | 831 | 810 | 158.9 |
| C | 14 | 238 | 127515 | 672.55 | 809 | 814 | 188.4 |
| C | 13 | 61 | 5615 | 25.48 | 809 | 814 | 188.4 |
| C | 3 | 233 | 4385 | 18.96 | 809 | 814 | 188.4 |
| D | 1 | 52 | 1362250 | 7102.55 | 795 | 773 | 191.7 |
| D | 14 | 35 | 170190 | 883.81 | 795 | 773 | 191.7 |
| D | 13 | 153 | 55430 | 285.13 | 795 | 773 | 191.7 |
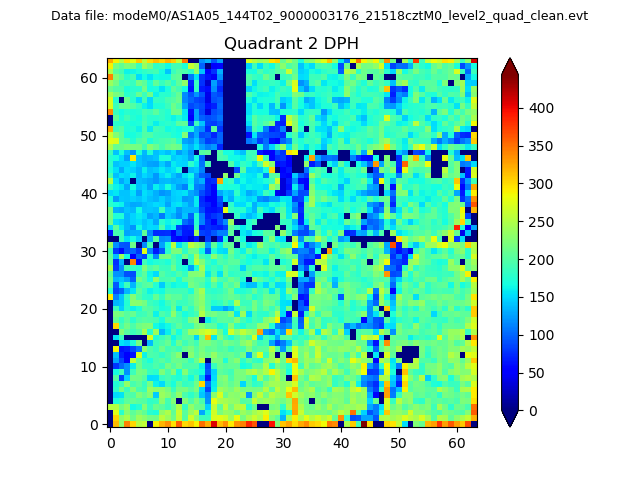
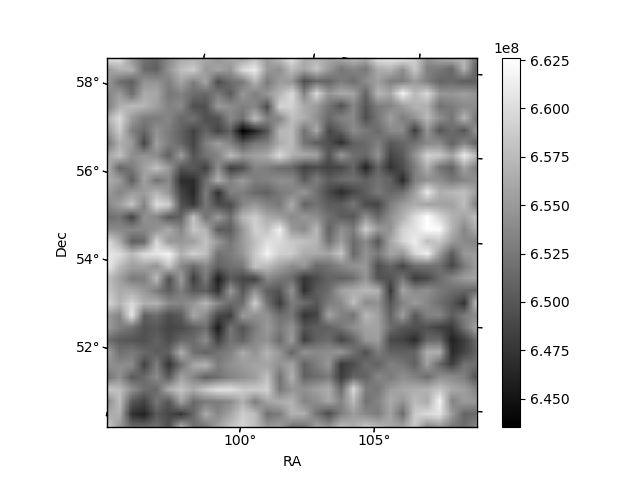
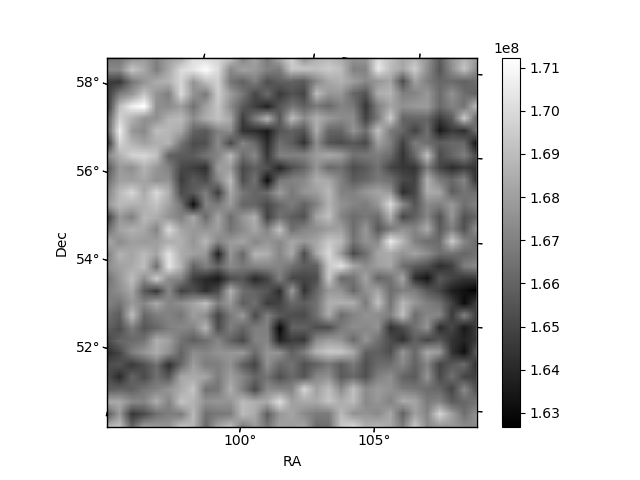
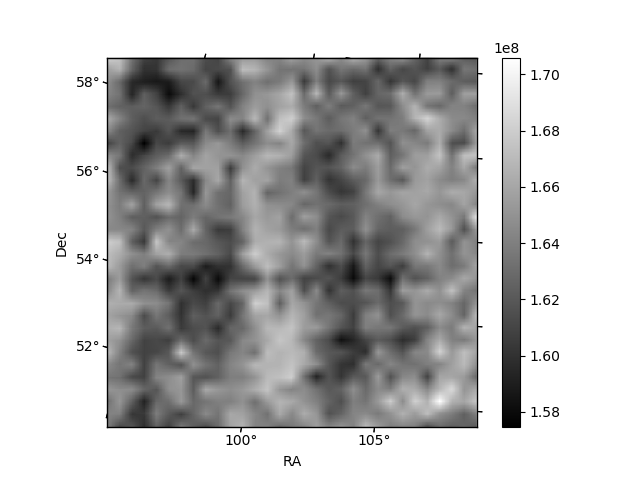
Histogram calculated using DETX and DETY for each event in the final _common_clean file
| Quadrant A | 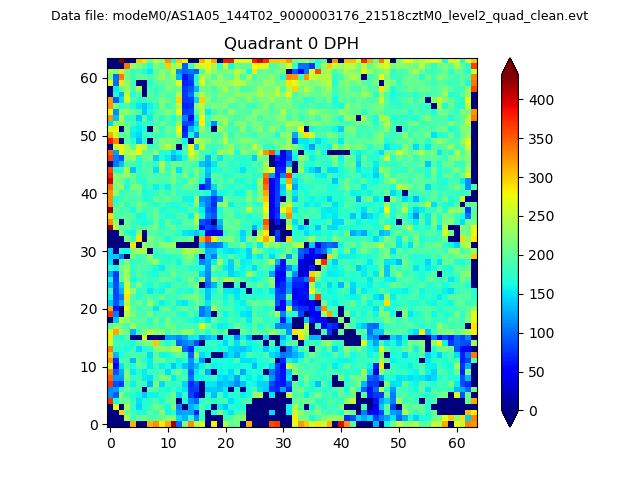 |
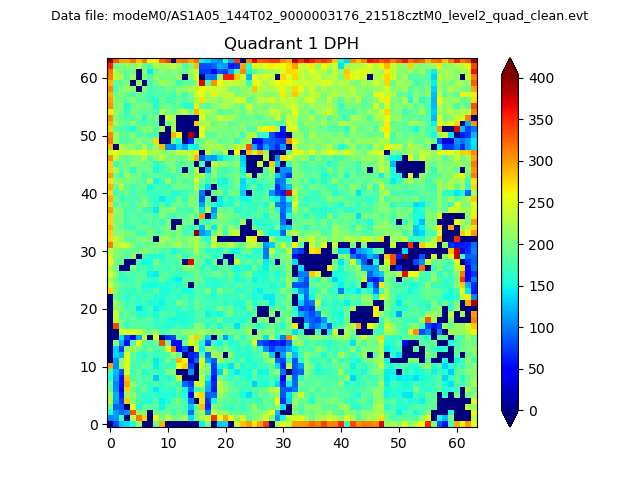 |
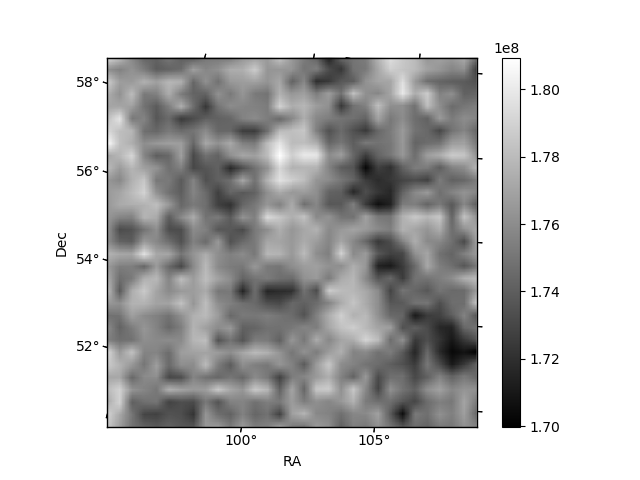
Quadrant B |
|---|---|---|---|
| Quadrant D | 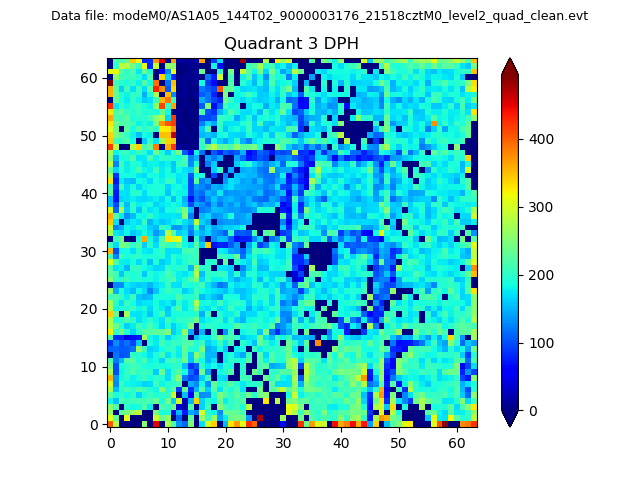 |
 |
Quadrant C |
| Plot type | Count rate plots | Images |
|---|---|---|
| Comparison with Poisson distribution Blue bars denote a histogram of data divided into 1 sec bins. Red curve is a Poisson curve with rate = median count rate of data. |
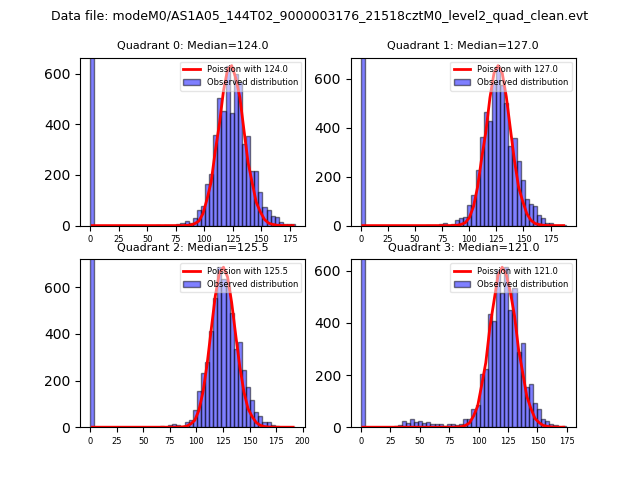 |
 |
| Quadrant-wise count rates Data is divided into 100 sec bins |
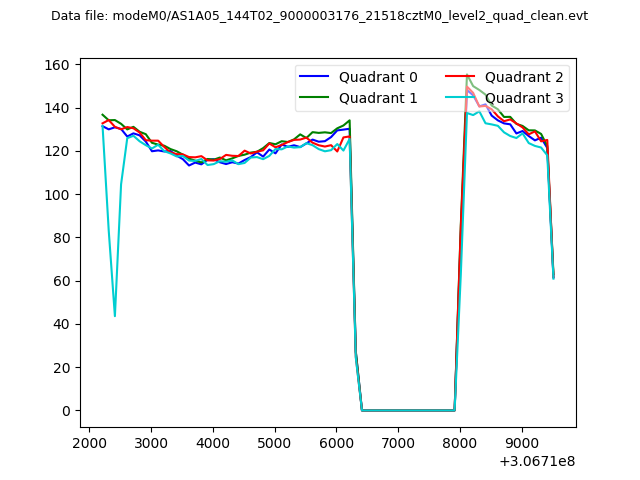 |
|
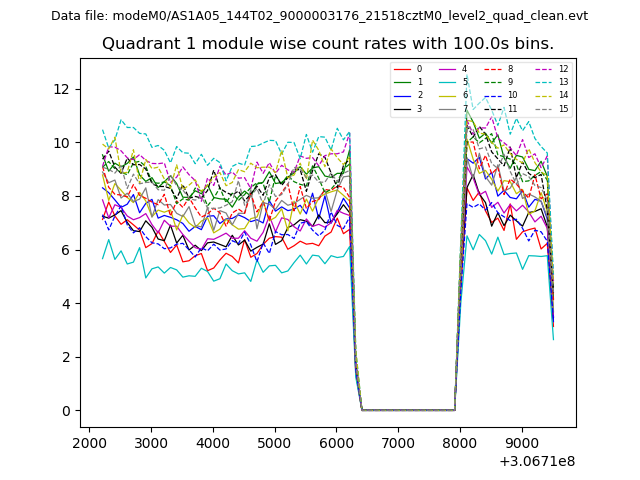
| Module-wise count rates for Quadrant A Data is divided into 100 sec bins |
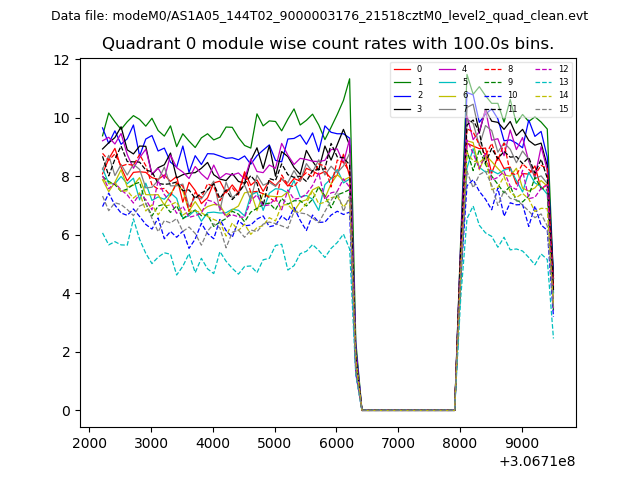 |
 |
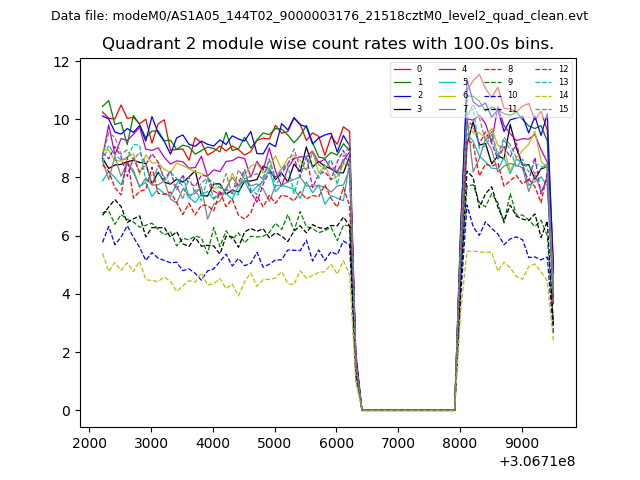
| Module-wise count rates for Quadrant B Data is divided into 100 sec bins |
 |
 |
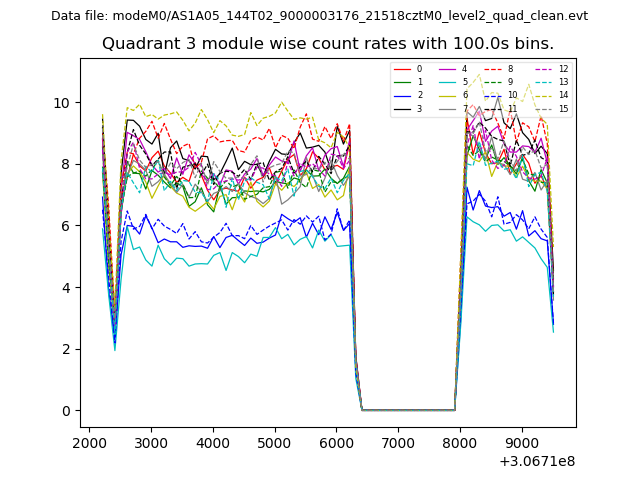
| Module-wise count rates for Quadrant C Data is divided into 100 sec bins |
 |
 |
| Module-wise count rates for Quadrant D Data is divided into 100 sec bins |
 |
 |
| Parameter | Plot |
|---|---|
| CZT HV Monitor | 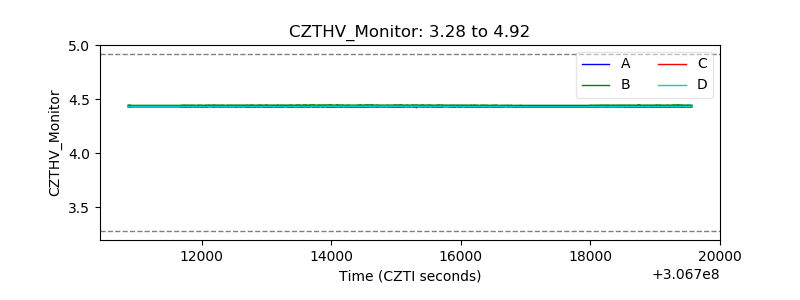 |
| D_VDD | 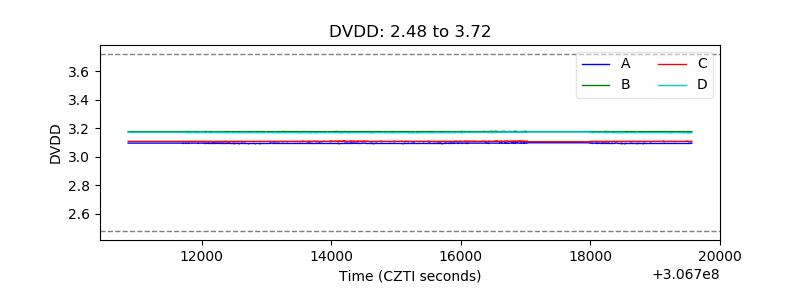 |
| Temperature 1 |  |
| Veto HV Monitor | 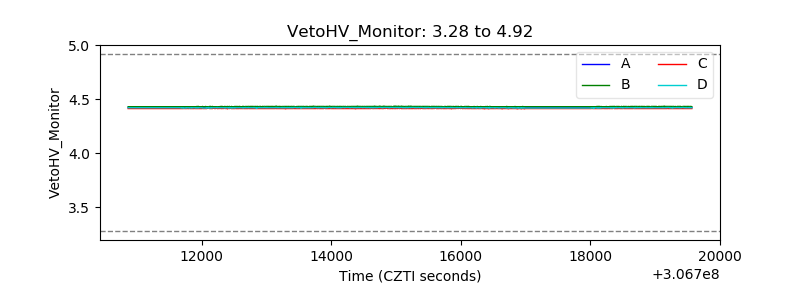 |
| Veto LLD | 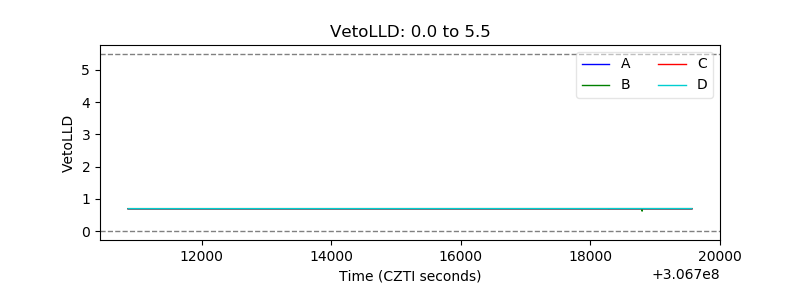 |
| Alpha Counter | 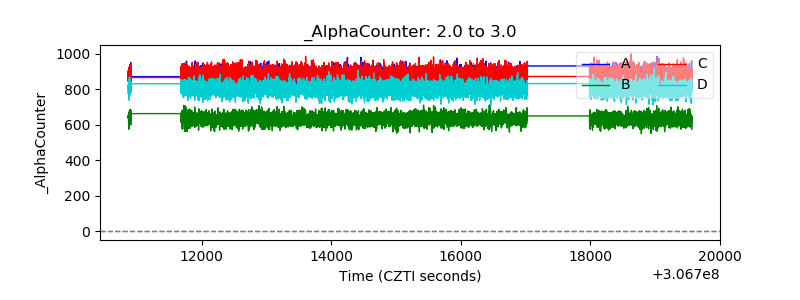 |
| _CPM_Rate | 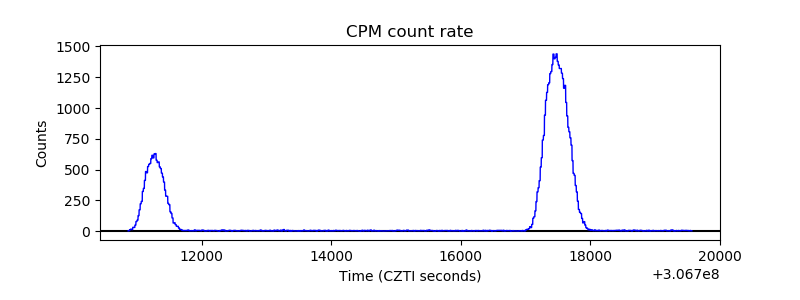 |
| CZT Counter | 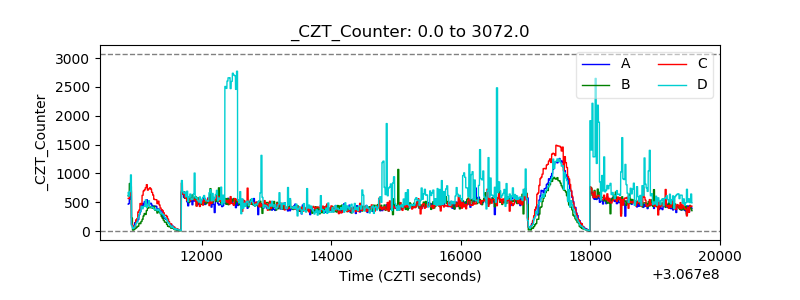 |
| +2.5 Volts monitor | 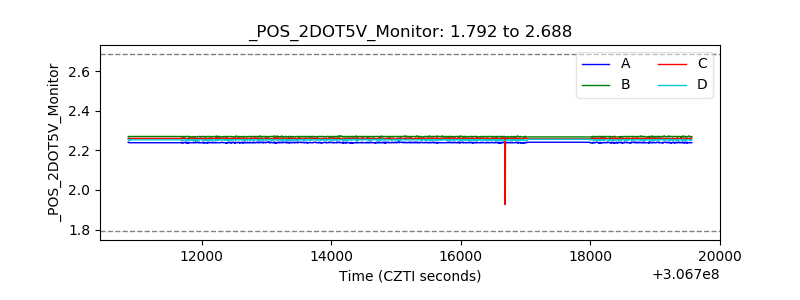 |
| +5 Volts monitor |  |
| _ROLL_ROT | 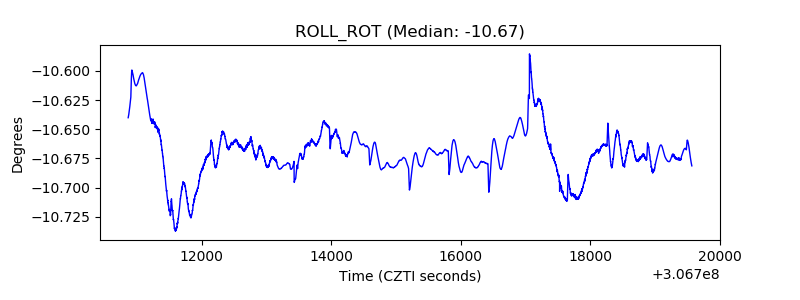 |
| _Roll_DEC | 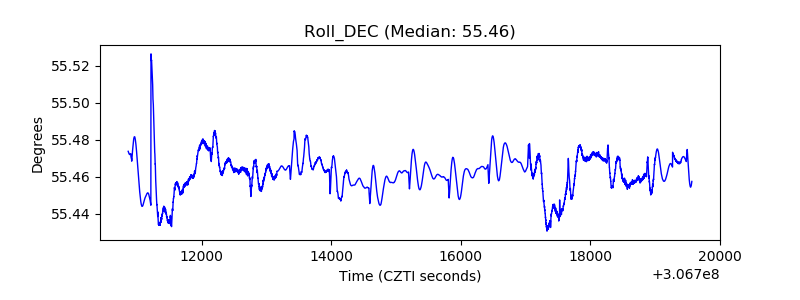 |
| _Roll_RA | 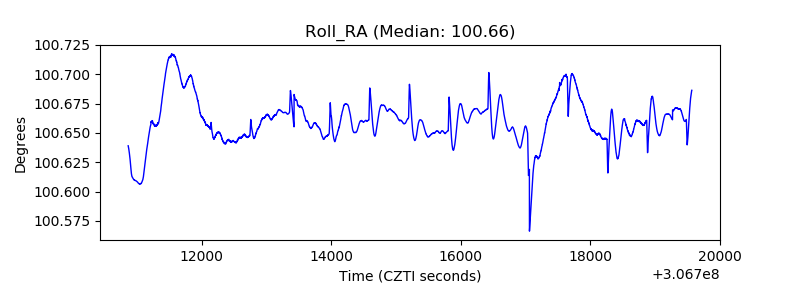 |
| Veto Counter | 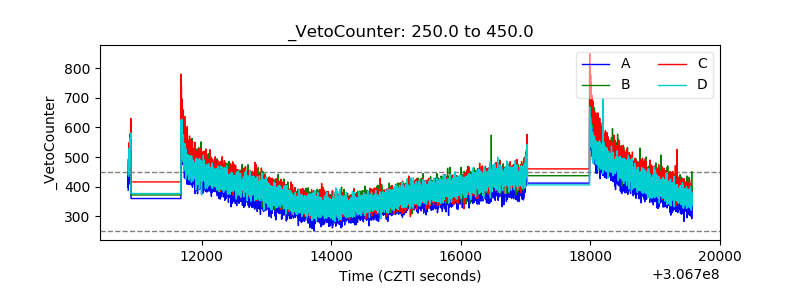 |