| Param | Original file | Final file |
|---|---|---|
| Filename | modeM0/AS1A05_144T02_9000003176_21521cztM0_level2.evt | modeM0/AS1A05_144T02_9000003176_21521cztM0_level2_quad_clean.evt |
| Size (bytes) | 429,635,520 | 101,692,800 |
| Size | 409.7 MB | 97.0 MB |
| Events in quadrant A | 2,857,084 | 662,608 |
| Events in quadrant B | 2,969,703 | 682,397 |
| Events in quadrant C | 2,913,526 | 665,857 |
| Events in quadrant D | 3,853,786 | 640,319 |
| Mode M9 | |||
|---|---|---|---|
| Quadrant | BADHDUFLAG | Total packets | Discarded packets |
| A | 0 | 12 | 0 |
| B | 0 | 12 | 0 |
| C | 0 | 12 | 0 |
| D | 0 | 12 | 0 |
| Mode M0 | |||
|---|---|---|---|
| Quadrant | BADHDUFLAG | Total packets | Discarded packets |
| A | 0 | 12531 | 1 |
| B | 0 | 12804 | 1 |
| C | 0 | 12653 | 1 |
| D | 0 | 15827 | 1 |
| Mode SS | |||
|---|---|---|---|
| Quadrant | BADHDUFLAG | Total packets | Discarded packets |
| A | 0 | 126 | 0 |
| B | 0 | 126 | 0 |
| C | 0 | 126 | 0 |
| D | 0 | 126 | 0 |
| Quadrant | Total seconds | Saturated seconds | Saturation percentage |
|---|---|---|---|
| A | 6137 | 14 | 0.228124% |
| B | 6137 | 17 | 0.277008% |
| C | 6137 | 28 | 0.456249% |
| D | 6137 | 149 | 2.427896% |
Noise dominated data is calculated using 1-second bins in cleaned event files. If a bin has >2000 counts, and if more than 50% of those come from <1% of pixels, then it is considered to be noise-dominated and hence unusable.
| Quadrant | # 1 sec bins | Bins with >0 counts | Bins with >2000 counts | High rate bins dominated by noise | Noise dominated (total time) | Noise dominated (detector-on time) | Marked lightcurve |
|---|---|---|---|---|---|---|---|
| A | 7367 | 6138 | 0 | 0 | 0.00% | 0.00% | 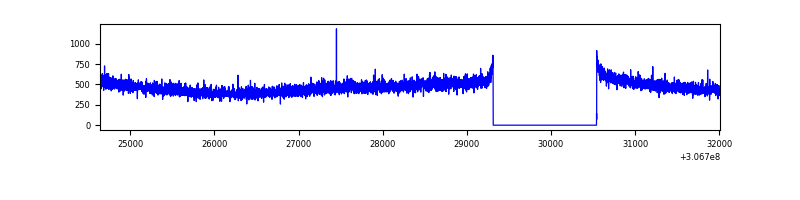 |
| B | 7367 | 6138 | 3 | 3 | 0.04% | 0.05% | 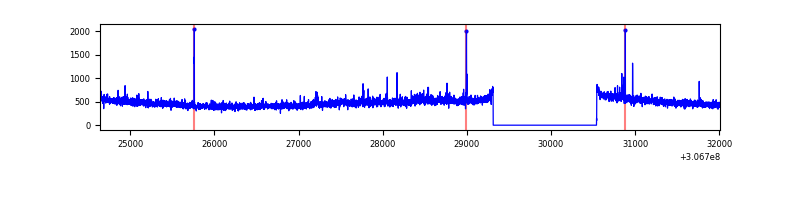 |
| C | 7367 | 6138 | 0 | 0 | 0.00% | 0.00% | 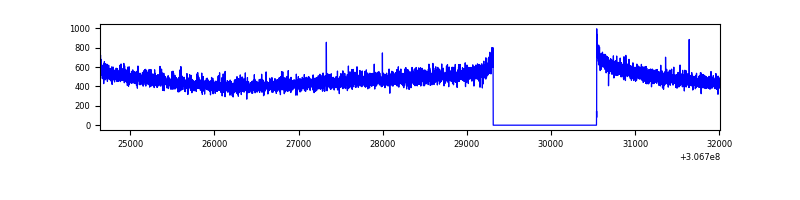 |
| D | 7367 | 6138 | 110 | 110 | 1.49% | 1.79% | 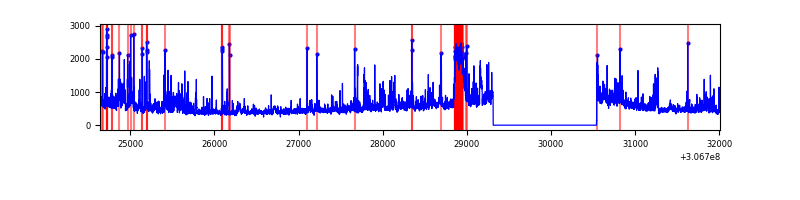 |
Top three noisy pixels from each quadrant. If the there are fewer than three noisy pixels in the level2.evt file, extra rows are filled as -1
| Pixel properties | Quadrant properties | ||||||
|---|---|---|---|---|---|---|---|
| Quadrant | DetID | PixID | Counts | Sigma | Mean | Median | Sigma |
| A | 3 | 1 | 12622 | 80.93 | 737 | 723 | 147.0 |
| A | 13 | 254 | 9685 | 60.96 | 737 | 723 | 147.0 |
| A | 0 | 226 | 6473 | 39.11 | 737 | 723 | 147.0 |
| B | 0 | 230 | 26773 | 187.56 | 740 | 721 | 138.9 |
| B | 4 | 190 | 24375 | 170.3 | 740 | 721 | 138.9 |
| B | 12 | 111 | 16357 | 112.57 | 740 | 721 | 138.9 |
| C | 14 | 238 | 114686 | 693.08 | 713 | 720 | 164.4 |
| C | 8 | 128 | 11485 | 65.47 | 713 | 720 | 164.4 |
| C | 8 | 112 | 5322 | 27.99 | 713 | 720 | 164.4 |
| D | 1 | 52 | 756069 | 4238.64 | 703 | 688 | 178.2 |
| D | 7 | 38 | 215074 | 1202.97 | 703 | 688 | 178.2 |
| D | 14 | 35 | 92528 | 515.34 | 703 | 688 | 178.2 |
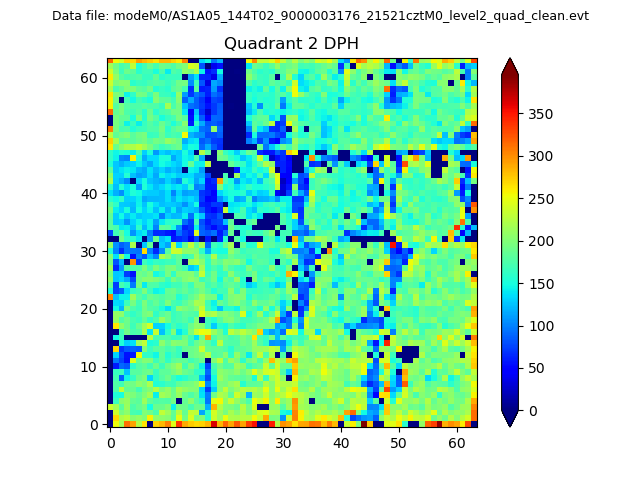
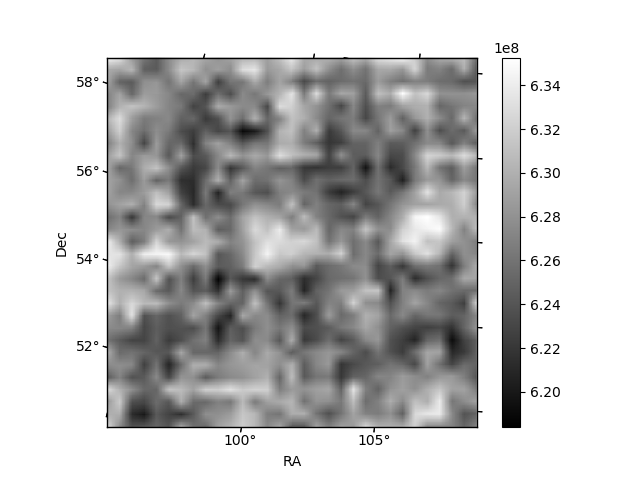
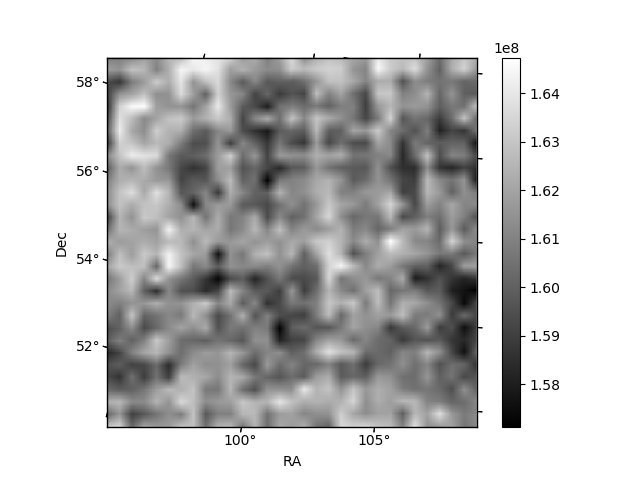
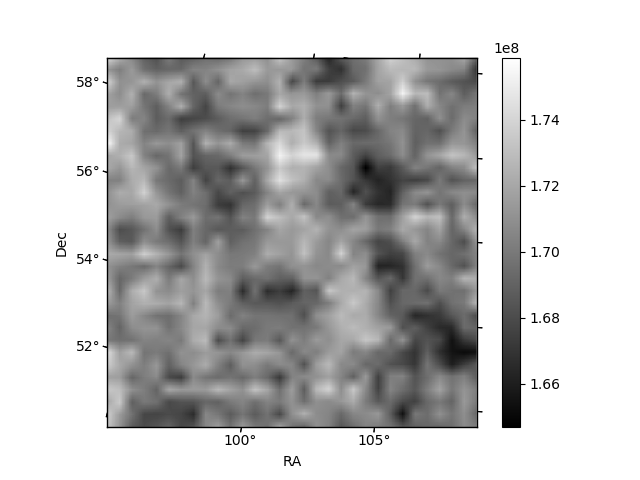
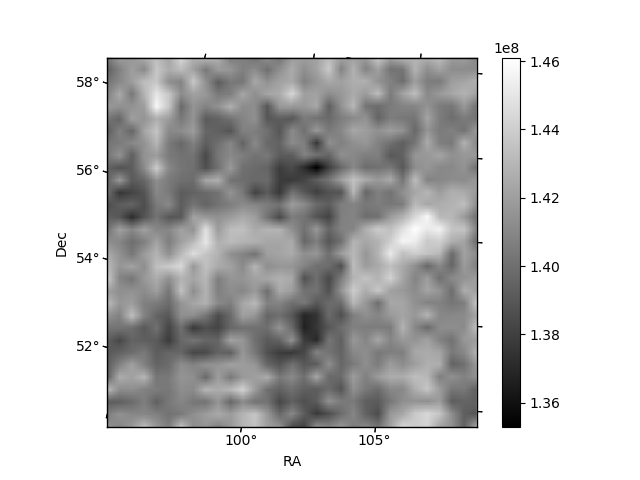
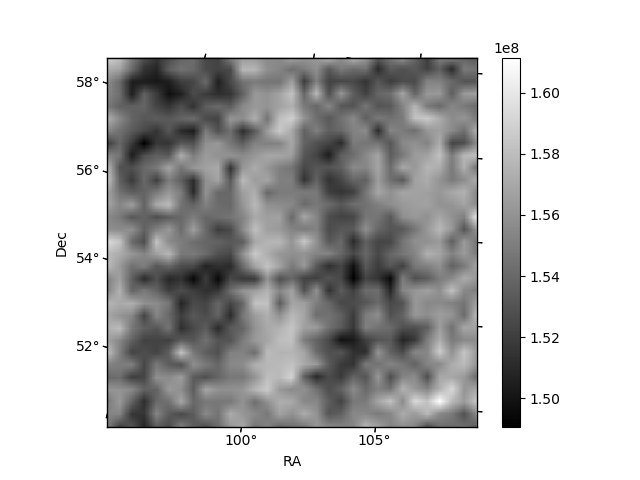
Histogram calculated using DETX and DETY for each event in the final _common_clean file
| Quadrant A | 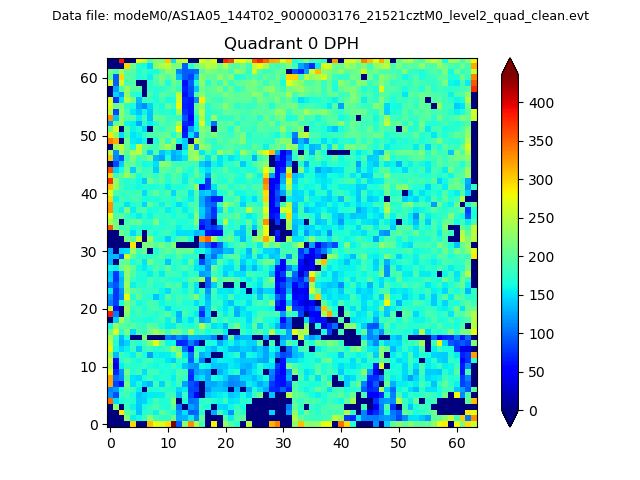 |
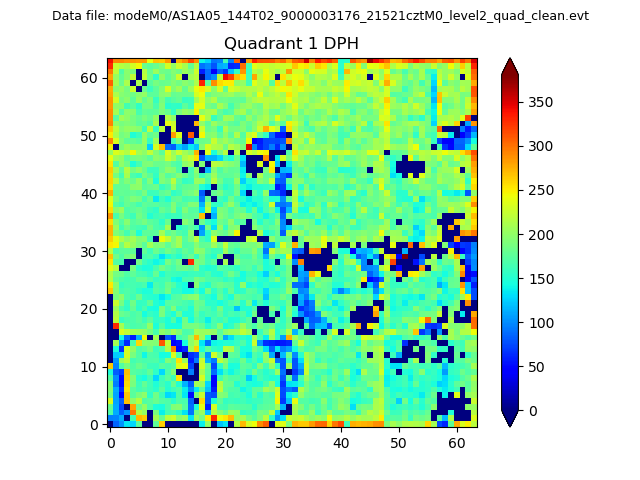 |
Quadrant B |
|---|---|---|---|
| Quadrant D | 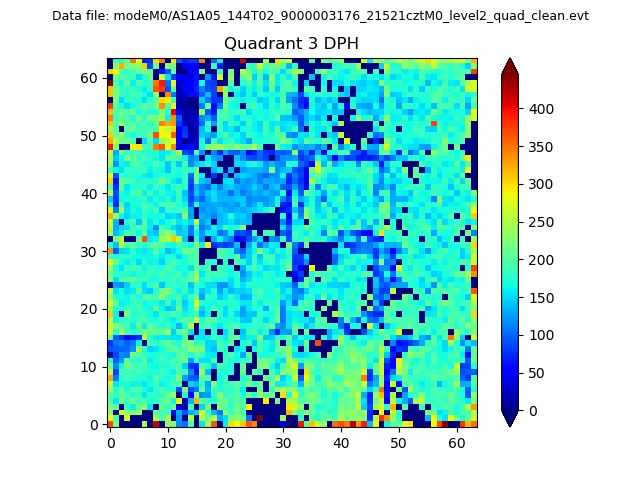 |
 |
Quadrant C |
| Plot type | Count rate plots | Images |
|---|---|---|
| Comparison with Poisson distribution Blue bars denote a histogram of data divided into 1 sec bins. Red curve is a Poisson curve with rate = median count rate of data. |
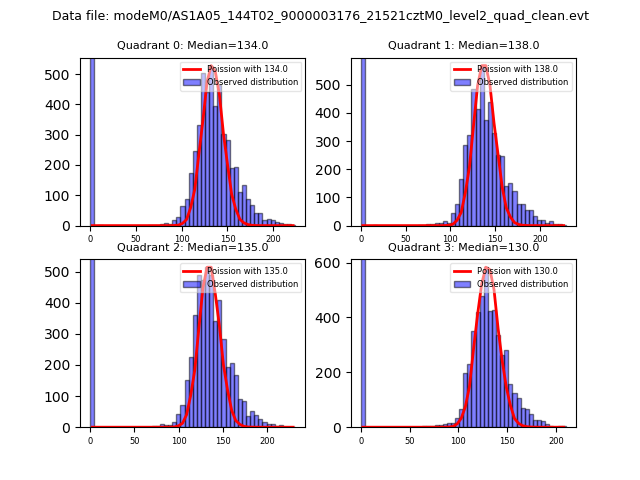 |
 |
| Quadrant-wise count rates Data is divided into 100 sec bins |
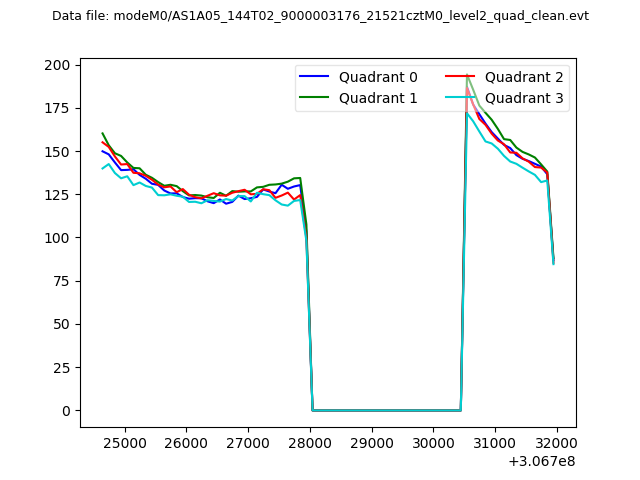 |
|
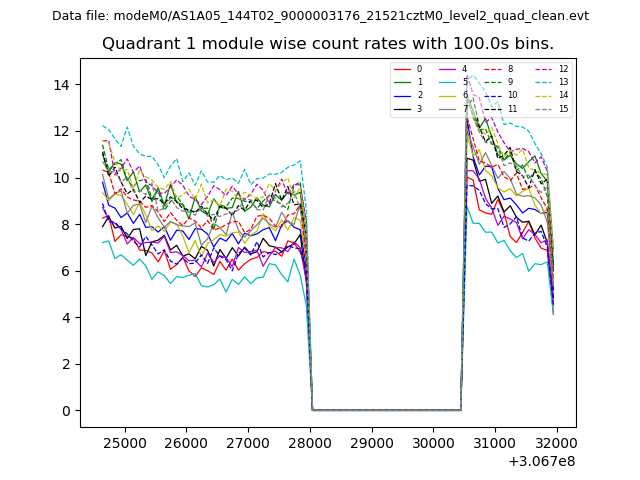
| Module-wise count rates for Quadrant A Data is divided into 100 sec bins |
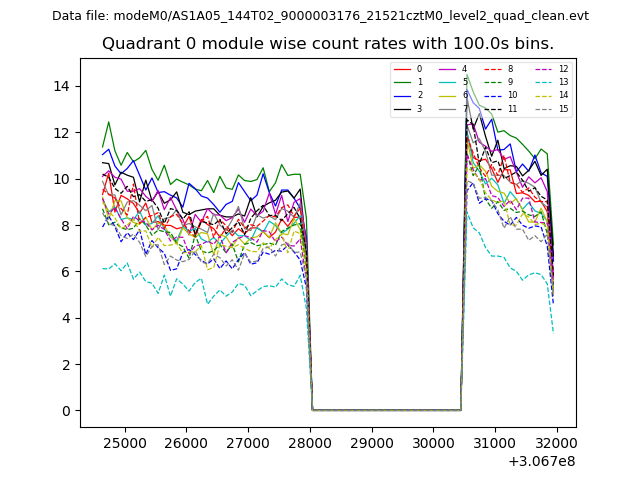 |
 |
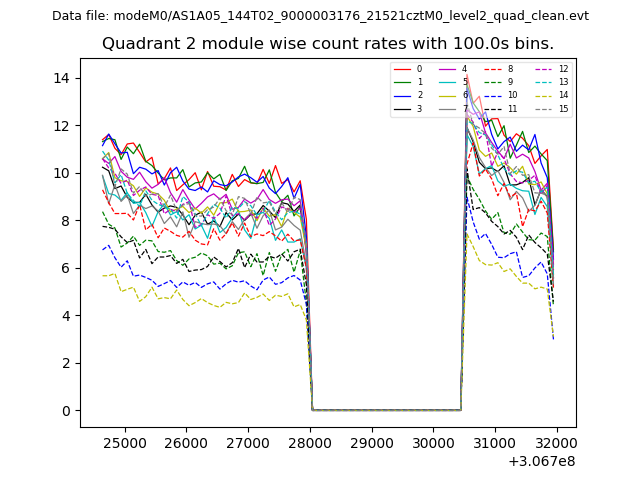
| Module-wise count rates for Quadrant B Data is divided into 100 sec bins |
 |
 |
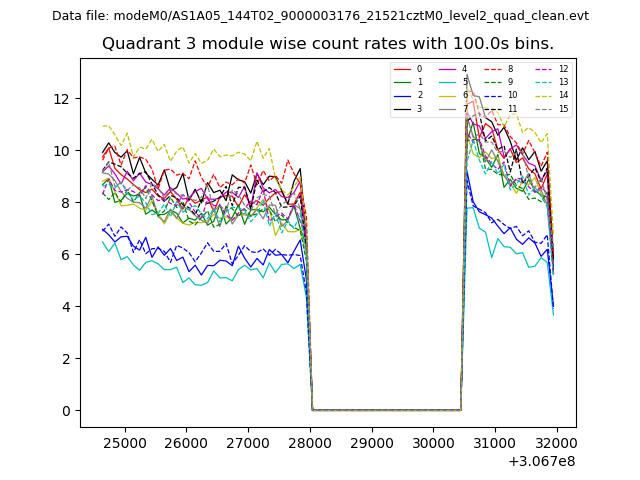
| Module-wise count rates for Quadrant C Data is divided into 100 sec bins |
 |
 |
| Module-wise count rates for Quadrant D Data is divided into 100 sec bins |
 |
 |
| Parameter | Plot |
|---|---|
| CZT HV Monitor | 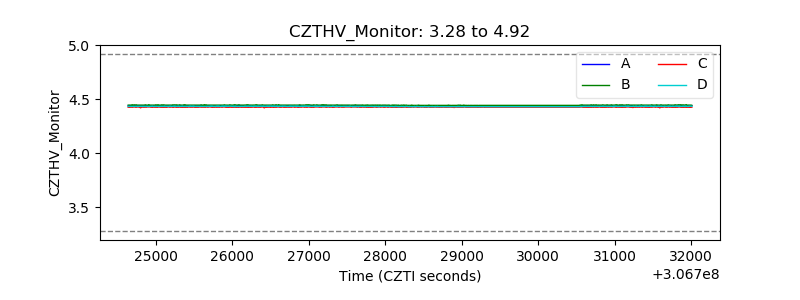 |
| D_VDD | 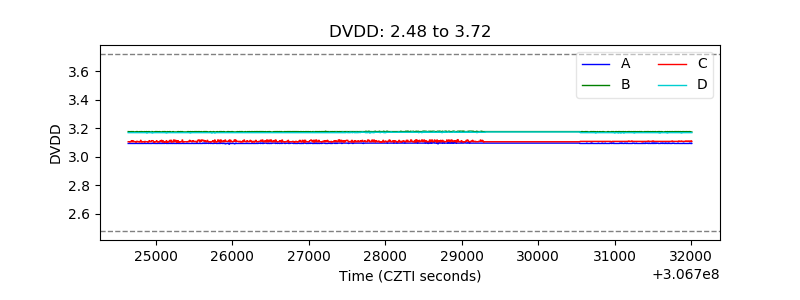 |
| Temperature 1 | 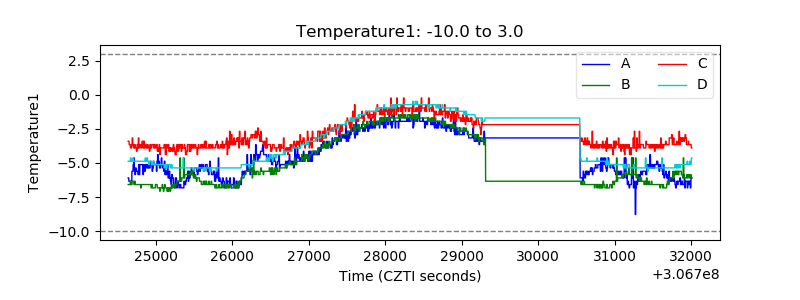 |
| Veto HV Monitor | 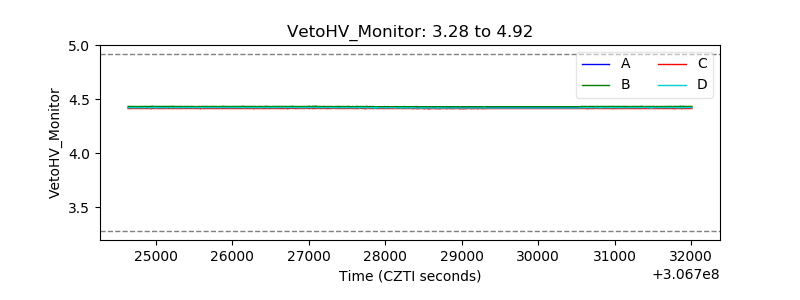 |
| Veto LLD | 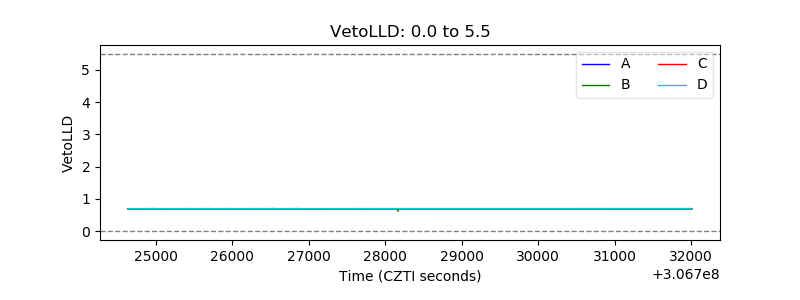 |
| Alpha Counter | 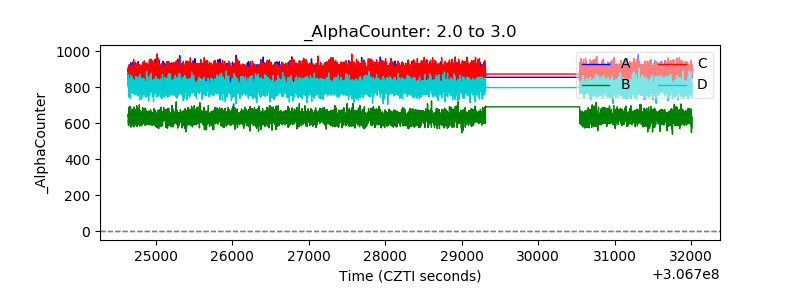 |
| _CPM_Rate | 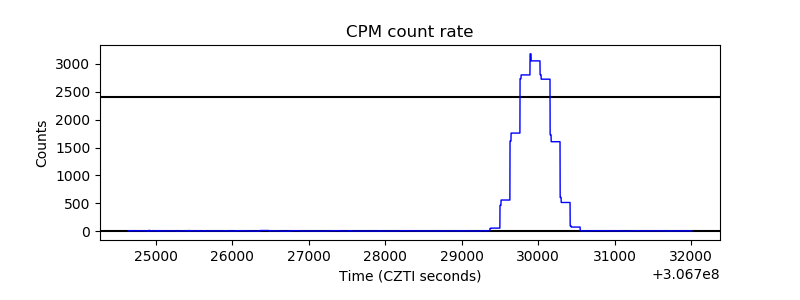 |
| CZT Counter | 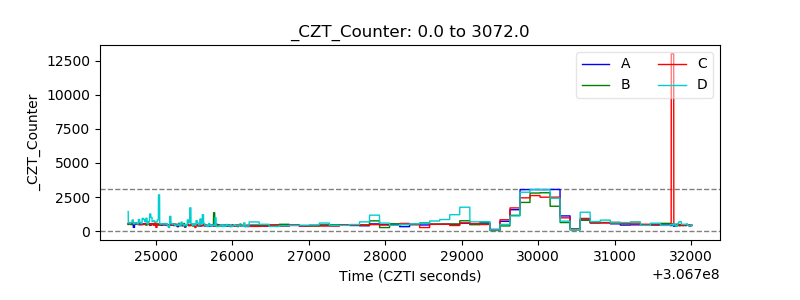 |
| +2.5 Volts monitor |  |
| +5 Volts monitor |  |
| _ROLL_ROT | 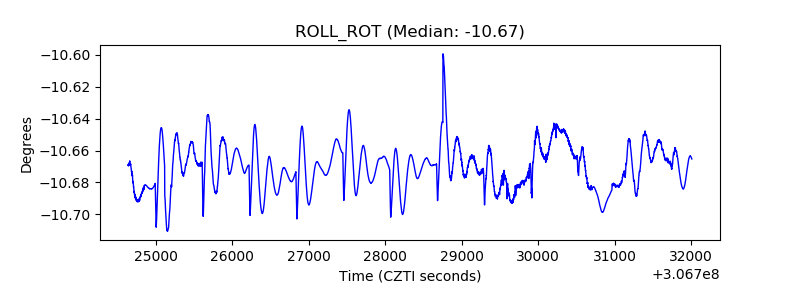 |
| _Roll_DEC | 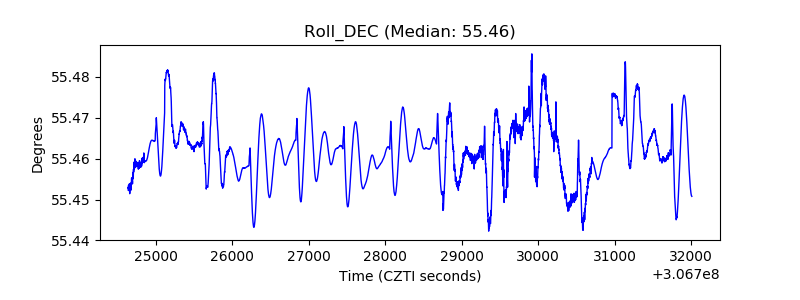 |
| _Roll_RA | 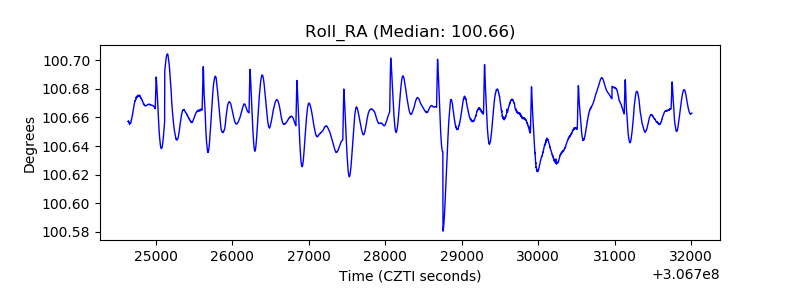 |
| Veto Counter | 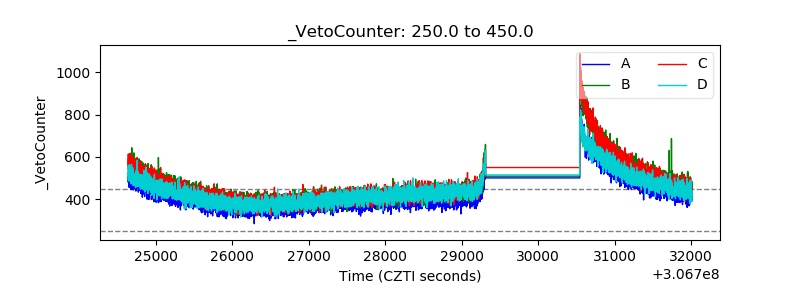 |