| Param | Original file | Final file |
|---|---|---|
| Filename | modeM0/AS1A05_144T02_9000003176_21522cztM0_level2.evt | modeM0/AS1A05_144T02_9000003176_21522cztM0_level2_quad_clean.evt |
| Size (bytes) | 402,753,600 | 96,768,000 |
| Size | 384.1 MB | 92.3 MB |
| Events in quadrant A | 2,716,866 | 642,991 |
| Events in quadrant B | 2,834,177 | 665,665 |
| Events in quadrant C | 2,752,612 | 637,462 |
| Events in quadrant D | 3,517,900 | 598,628 |
| Mode M9 | |||
|---|---|---|---|
| Quadrant | BADHDUFLAG | Total packets | Discarded packets |
| A | 0 | 12 | 0 |
| B | 0 | 12 | 0 |
| C | 0 | 12 | 0 |
| D | 0 | 12 | 0 |
| Mode M0 | |||
|---|---|---|---|
| Quadrant | BADHDUFLAG | Total packets | Discarded packets |
| A | 0 | 13288 | 1743 |
| B | 0 | 13599 | 1682 |
| C | 0 | 13295 | 1621 |
| D | 0 | 17355 | 3226 |
| Mode SS | |||
|---|---|---|---|
| Quadrant | BADHDUFLAG | Total packets | Discarded packets |
| A | 0 | 130 | 12 |
| B | 0 | 130 | 16 |
| C | 0 | 130 | 14 |
| D | 0 | 130 | 20 |
| Quadrant | Total seconds | Saturated seconds | Saturation percentage |
|---|---|---|---|
| A | 5514 | 32 | 0.580341% |
| B | 5560 | 46 | 0.827338% |
| C | 5557 | 54 | 0.971747% |
| D | 5357 | 126 | 2.352063% |
Noise dominated data is calculated using 1-second bins in cleaned event files. If a bin has >2000 counts, and if more than 50% of those come from <1% of pixels, then it is considered to be noise-dominated and hence unusable.
| Quadrant | # 1 sec bins | Bins with >0 counts | Bins with >2000 counts | High rate bins dominated by noise | Noise dominated (total time) | Noise dominated (detector-on time) | Marked lightcurve |
|---|---|---|---|---|---|---|---|
| A | 7616 | 6095 | 0 | 0 | 0.00% | 0.00% | 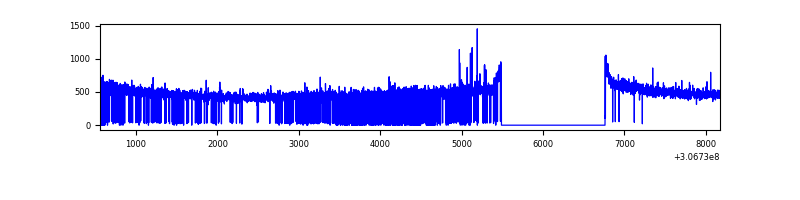 |
| B | 7616 | 6125 | 3 | 3 | 0.04% | 0.05% | 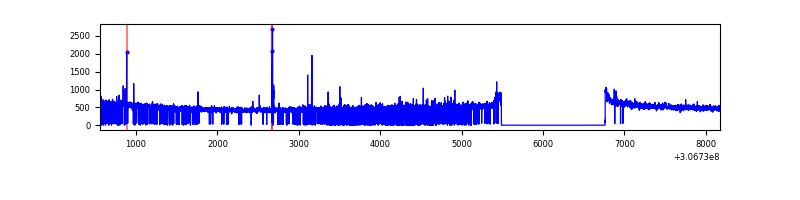 |
| C | 7617 | 6146 | 0 | 0 | 0.00% | 0.00% | 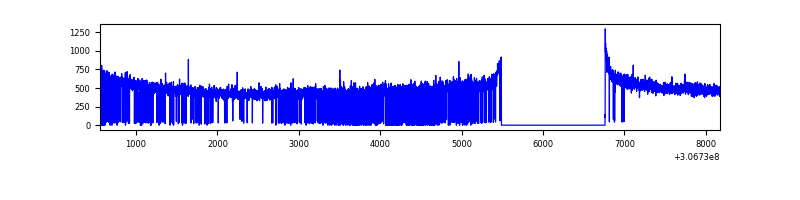 |
| D | 7617 | 5984 | 69 | 69 | 0.91% | 1.15% | 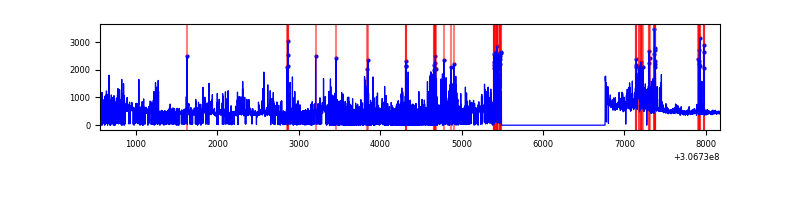 |
Top three noisy pixels from each quadrant. If the there are fewer than three noisy pixels in the level2.evt file, extra rows are filled as -1
| Pixel properties | Quadrant properties | ||||||
|---|---|---|---|---|---|---|---|
| Quadrant | DetID | PixID | Counts | Sigma | Mean | Median | Sigma |
| A | 12 | 96 | 10582 | 71.27 | 699 | 686 | 138.9 |
| A | 15 | 48 | 10068 | 67.57 | 699 | 686 | 138.9 |
| A | 13 | 254 | 9321 | 62.19 | 699 | 686 | 138.9 |
| B | 3 | 64 | 24045 | 177.53 | 707 | 691 | 131.6 |
| B | 4 | 190 | 15984 | 116.25 | 707 | 691 | 131.6 |
| B | 12 | 111 | 15214 | 110.4 | 707 | 691 | 131.6 |
| C | 14 | 238 | 111728 | 717.32 | 675 | 680 | 154.8 |
| C | 3 | 233 | 6849 | 39.85 | 675 | 680 | 154.8 |
| C | 13 | 61 | 4763 | 26.37 | 675 | 680 | 154.8 |
| D | 1 | 52 | 792677 | 4792.24 | 641 | 626 | 165.3 |
| D | 14 | 35 | 102475 | 616.23 | 641 | 626 | 165.3 |
| D | 7 | 38 | 89876 | 540.0 | 641 | 626 | 165.3 |
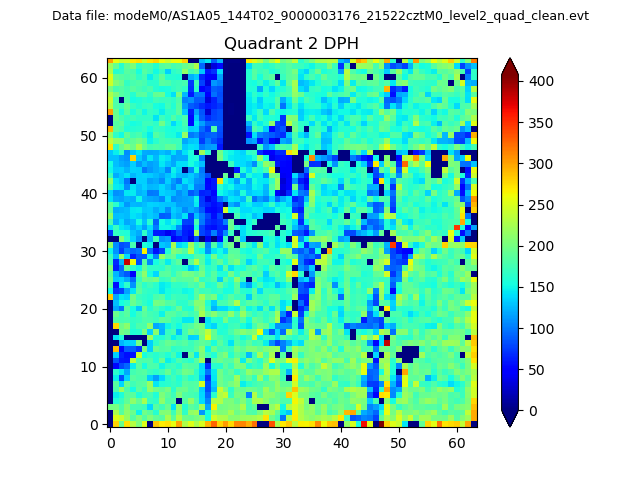
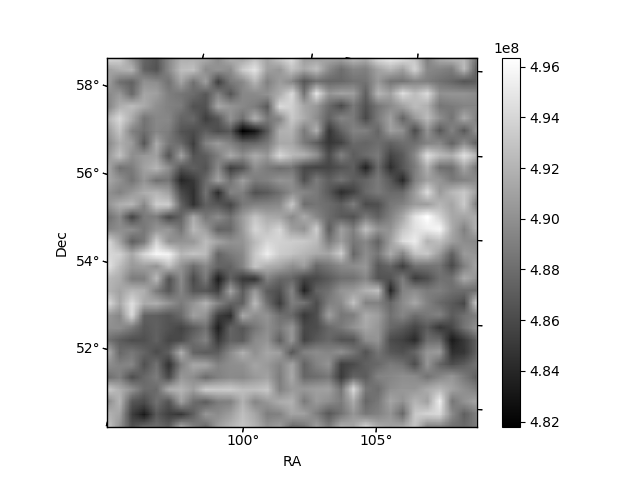
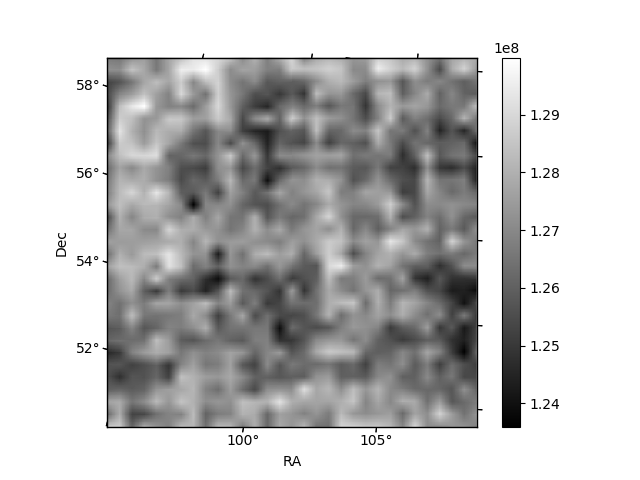
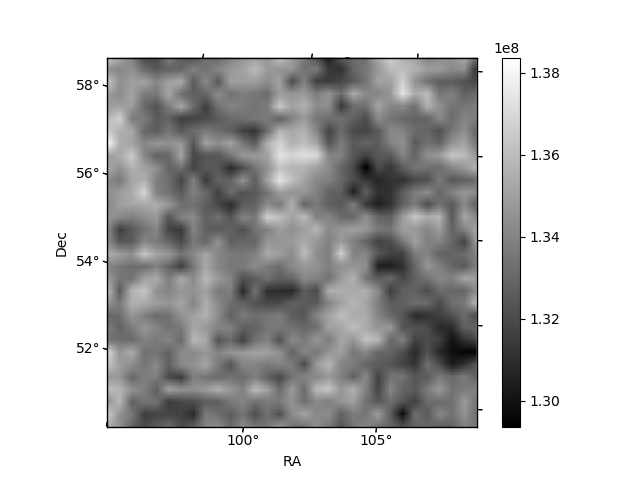
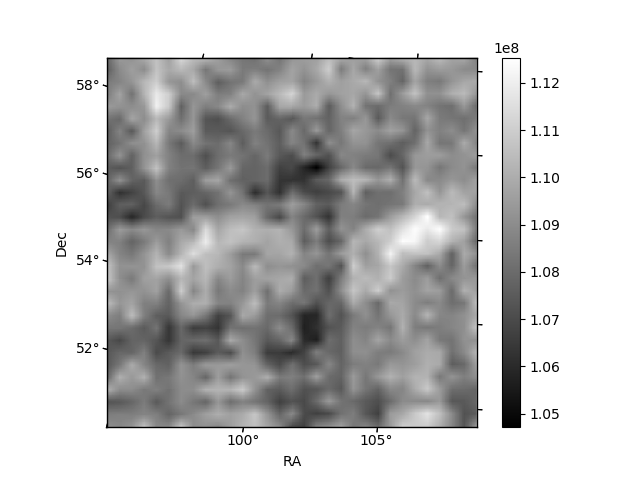
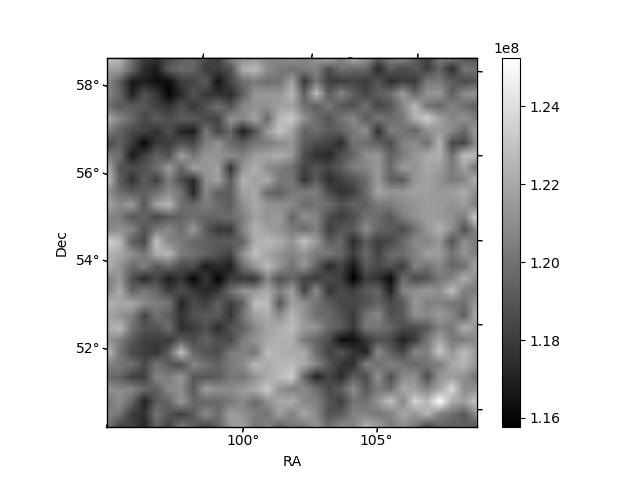
Histogram calculated using DETX and DETY for each event in the final _common_clean file
| Quadrant A | 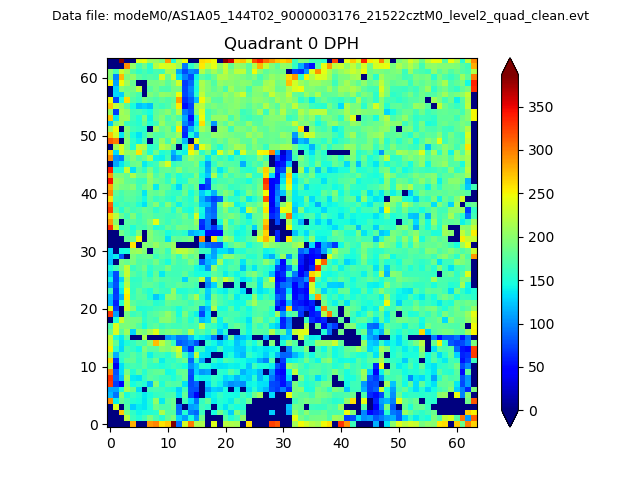 |
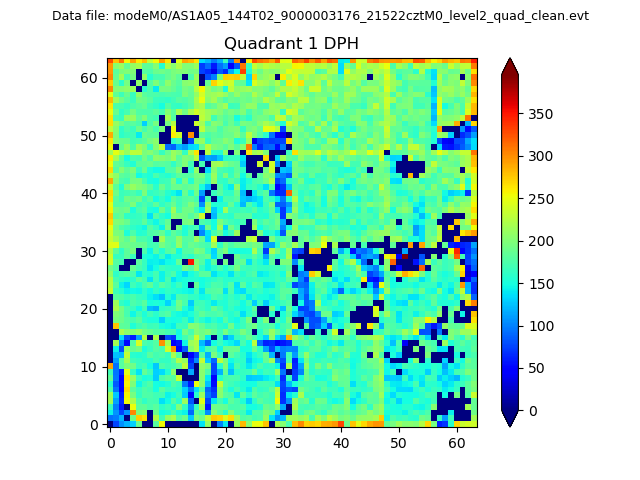 |
Quadrant B |
|---|---|---|---|
| Quadrant D | 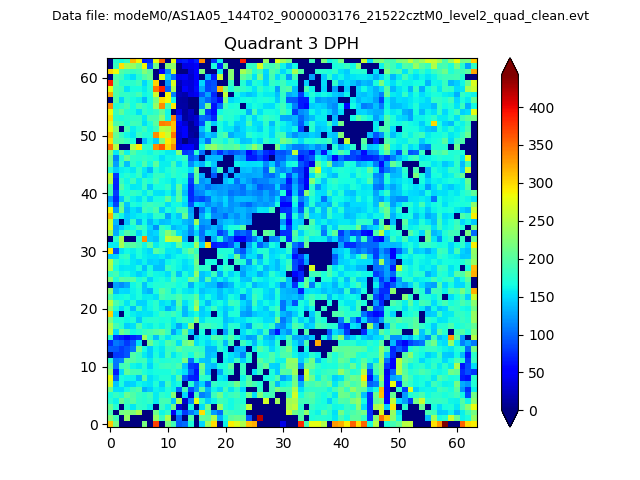 |
 |
Quadrant C |
| Plot type | Count rate plots | Images |
|---|---|---|
| Comparison with Poisson distribution Blue bars denote a histogram of data divided into 1 sec bins. Red curve is a Poisson curve with rate = median count rate of data. |
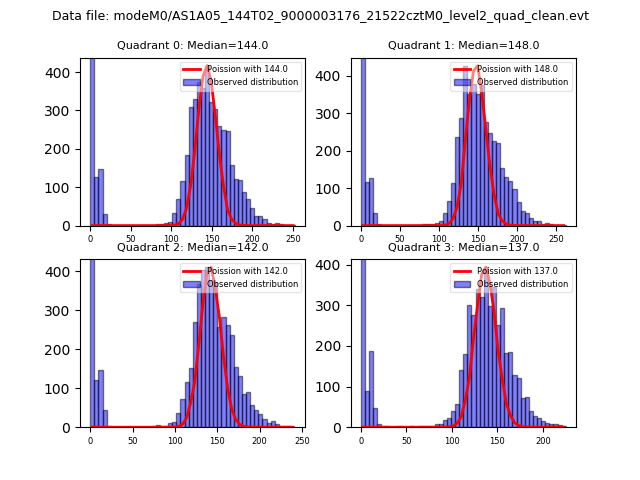 |
 |
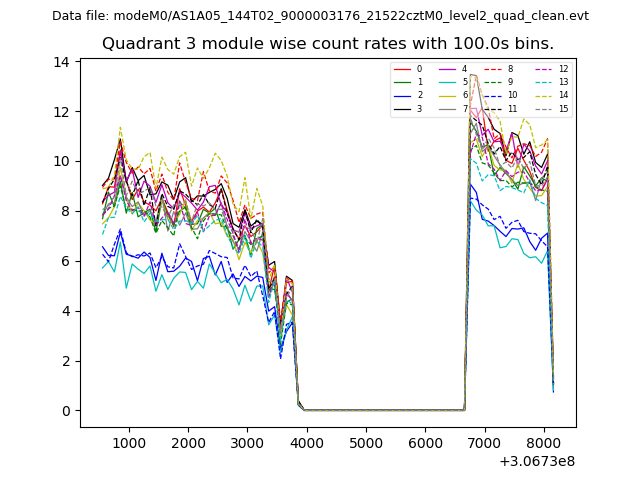
| Quadrant-wise count rates Data is divided into 100 sec bins |
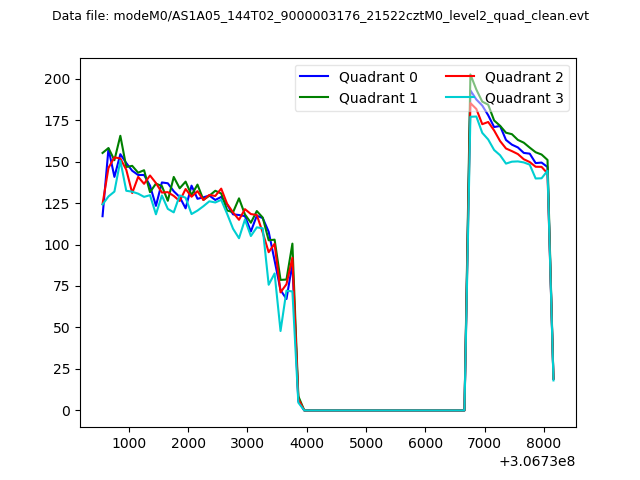 |
|
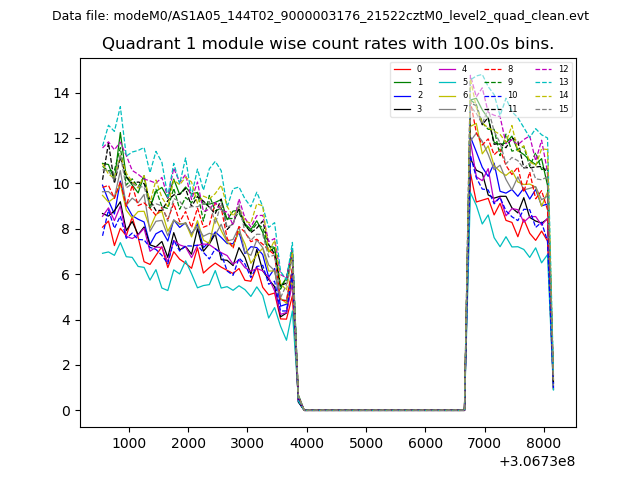
| Module-wise count rates for Quadrant A Data is divided into 100 sec bins |
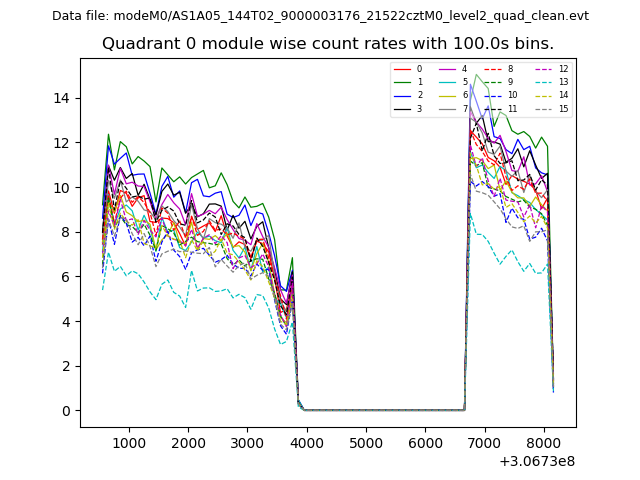 |
 |
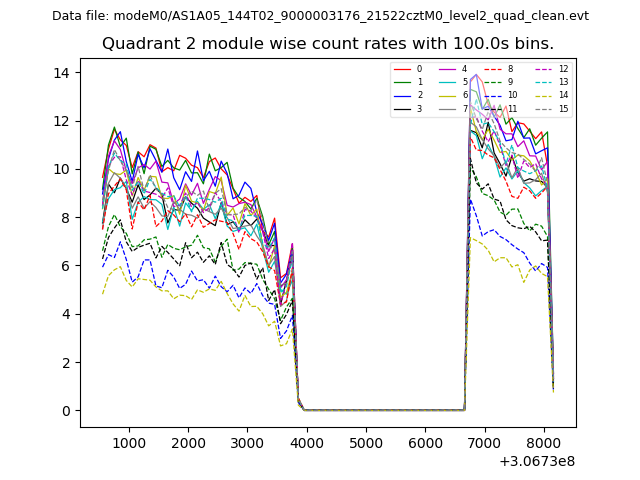
| Module-wise count rates for Quadrant B Data is divided into 100 sec bins |
 |
 |
| Module-wise count rates for Quadrant C Data is divided into 100 sec bins |
 |
 |
| Module-wise count rates for Quadrant D Data is divided into 100 sec bins |
 |
 |
| Parameter | Plot |
|---|---|
| CZT HV Monitor | 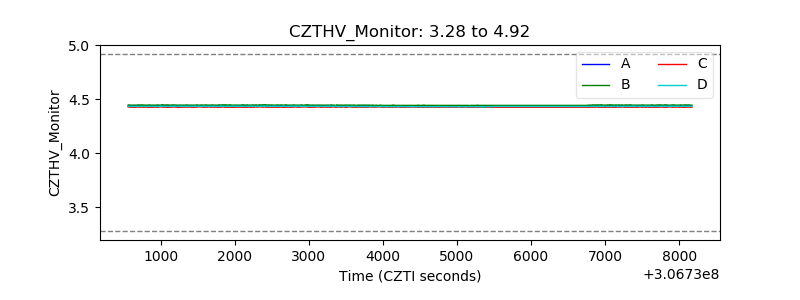 |
| D_VDD | 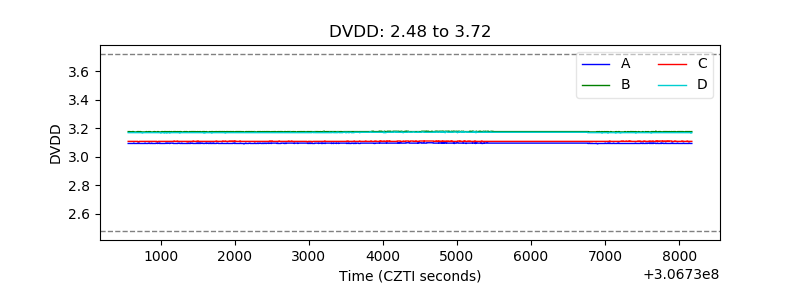 |
| Temperature 1 | 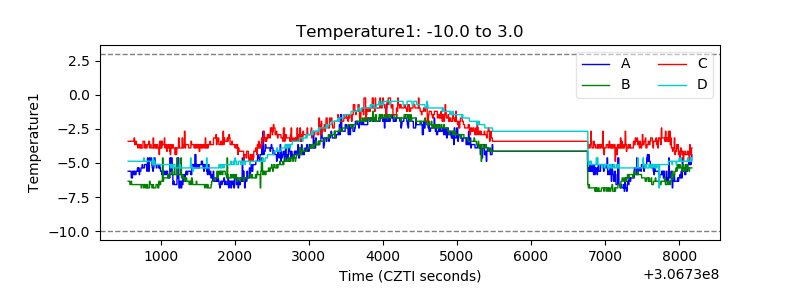 |
| Veto HV Monitor | 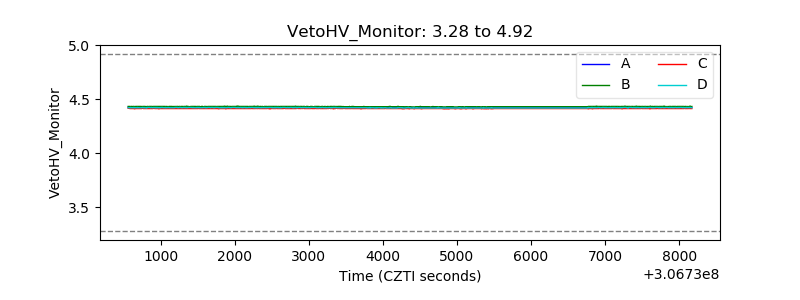 |
| Veto LLD | 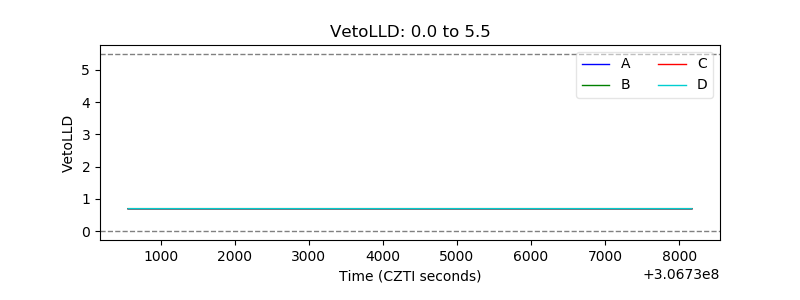 |
| Alpha Counter | 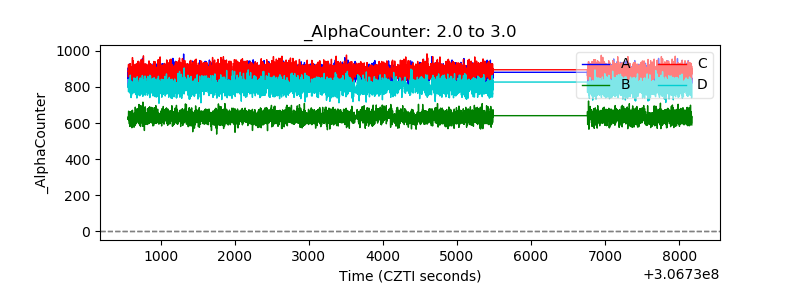 |
| _CPM_Rate |  |
| CZT Counter | 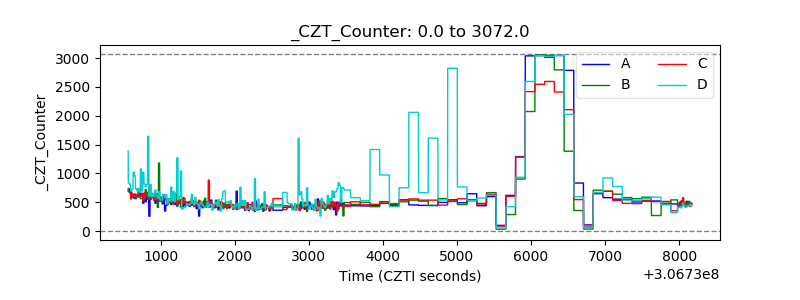 |
| +2.5 Volts monitor |  |
| +5 Volts monitor |  |
| _ROLL_ROT | 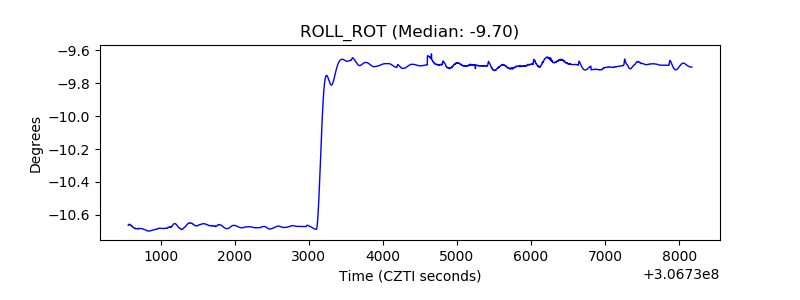 |
| _Roll_DEC | 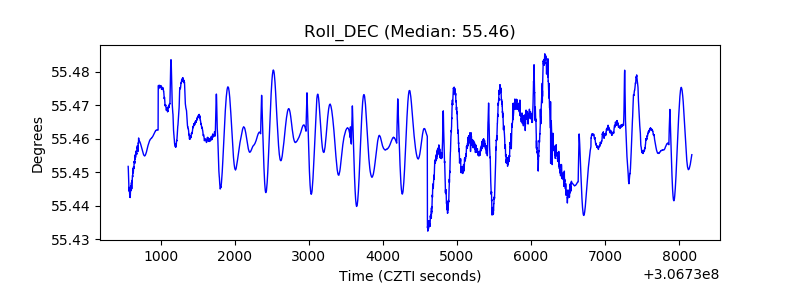 |
| _Roll_RA | 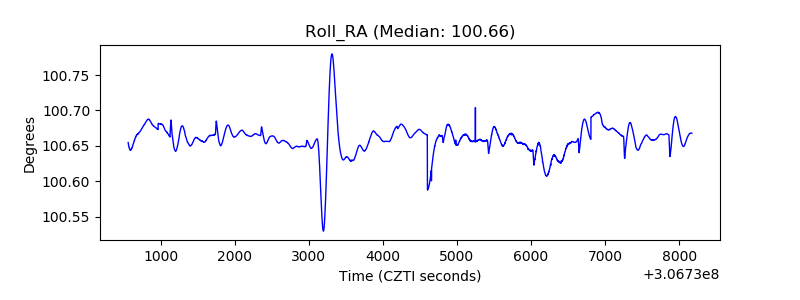 |
| Veto Counter | 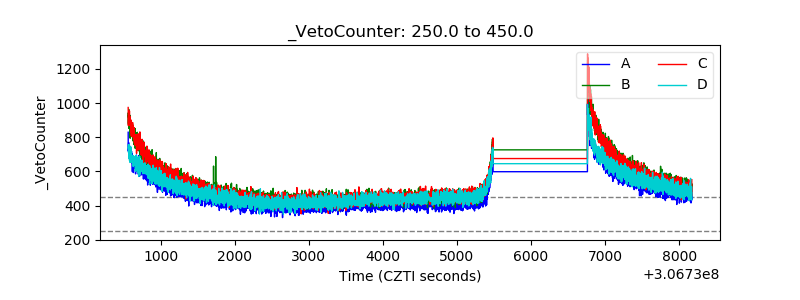 |