| Param | Original file | Final file |
|---|---|---|
| Filename | modeM0/AS1A05_144T02_9000003176_21525cztM0_level2.evt | modeM0/AS1A05_144T02_9000003176_21525cztM0_level2_quad_clean.evt |
| Size (bytes) | 456,621,120 | 101,934,720 |
| Size | 435.5 MB | 97.2 MB |
| Events in quadrant A | 3,141,797 | 671,769 |
| Events in quadrant B | 3,210,867 | 675,984 |
| Events in quadrant C | 3,110,442 | 653,948 |
| Events in quadrant D | 3,936,708 | 644,817 |
| Mode M9 | |||
|---|---|---|---|
| Quadrant | BADHDUFLAG | Total packets | Discarded packets |
| A | 0 | 13 | 0 |
| B | 0 | 13 | 0 |
| C | 0 | 13 | 0 |
| D | 0 | 13 | 0 |
| Mode M0 | |||
|---|---|---|---|
| Quadrant | BADHDUFLAG | Total packets | Discarded packets |
| A | 0 | 13056 | 2 |
| B | 0 | 13259 | 2 |
| C | 0 | 12999 | 2 |
| D | 0 | 15903 | 2 |
| Mode SS | |||
|---|---|---|---|
| Quadrant | BADHDUFLAG | Total packets | Discarded packets |
| A | 0 | 128 | 0 |
| B | 0 | 128 | 0 |
| C | 0 | 128 | 0 |
| D | 0 | 128 | 0 |
| Quadrant | Total seconds | Saturated seconds | Saturation percentage |
|---|---|---|---|
| A | 6314 | 40 | 0.633513% |
| B | 6315 | 49 | 0.775930% |
| C | 6315 | 50 | 0.791766% |
| D | 6315 | 117 | 1.852732% |
Noise dominated data is calculated using 1-second bins in cleaned event files. If a bin has >2000 counts, and if more than 50% of those come from <1% of pixels, then it is considered to be noise-dominated and hence unusable.
| Quadrant | # 1 sec bins | Bins with >0 counts | Bins with >2000 counts | High rate bins dominated by noise | Noise dominated (total time) | Noise dominated (detector-on time) | Marked lightcurve |
|---|---|---|---|---|---|---|---|
| A | 7559 | 6315 | 0 | 0 | 0.00% | 0.00% | 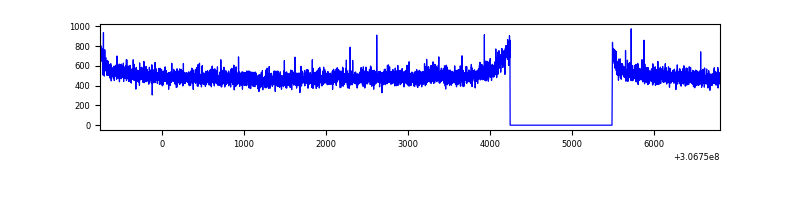 |
| B | 7560 | 6316 | 5 | 5 | 0.07% | 0.08% | 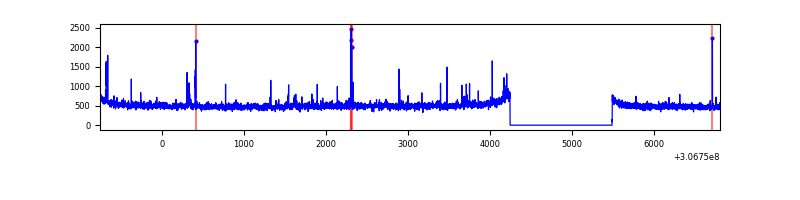 |
| C | 7560 | 6316 | 0 | 0 | 0.00% | 0.00% | 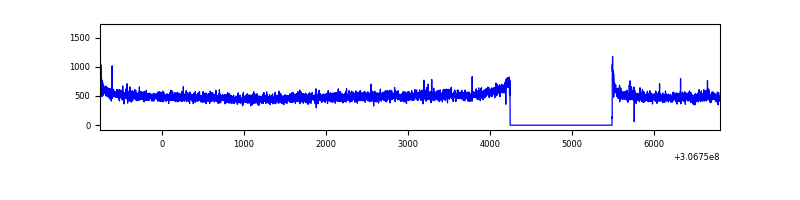 |
| D | 7560 | 6316 | 75 | 75 | 0.99% | 1.19% |  |
Top three noisy pixels from each quadrant. If the there are fewer than three noisy pixels in the level2.evt file, extra rows are filled as -1
| Pixel properties | Quadrant properties | ||||||
|---|---|---|---|---|---|---|---|
| Quadrant | DetID | PixID | Counts | Sigma | Mean | Median | Sigma |
| A | 15 | 48 | 34115 | 207.44 | 805 | 791 | 160.6 |
| A | 13 | 254 | 10508 | 60.49 | 805 | 791 | 160.6 |
| A | 0 | 226 | 7108 | 39.32 | 805 | 791 | 160.6 |
| B | 3 | 64 | 41557 | 273.3 | 793 | 775 | 149.2 |
| B | 0 | 230 | 20249 | 130.5 | 793 | 775 | 149.2 |
| B | 0 | 190 | 18591 | 119.39 | 793 | 775 | 149.2 |
| C | 14 | 238 | 123450 | 707.14 | 758 | 765 | 173.5 |
| C | 3 | 233 | 21535 | 119.72 | 758 | 765 | 173.5 |
| C | 0 | 10 | 11743 | 63.28 | 758 | 765 | 173.5 |
| D | 1 | 52 | 394272 | 2000.69 | 769 | 750 | 196.7 |
| D | 7 | 38 | 237700 | 1204.67 | 769 | 750 | 196.7 |
| D | 14 | 35 | 221498 | 1122.3 | 769 | 750 | 196.7 |
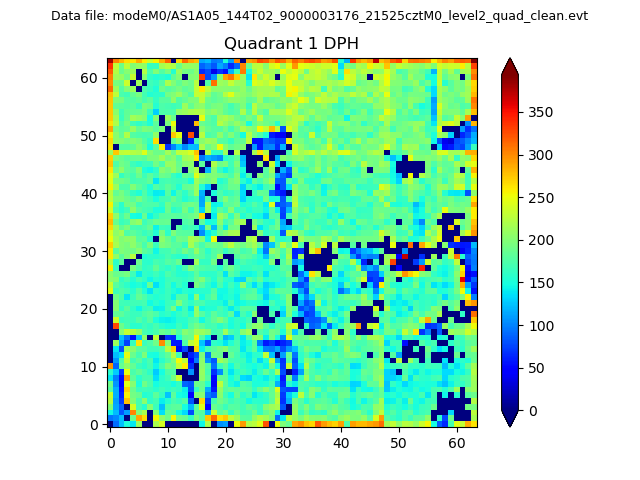
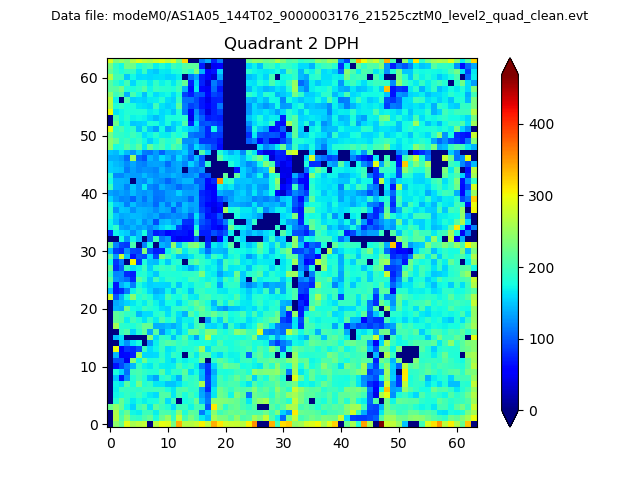
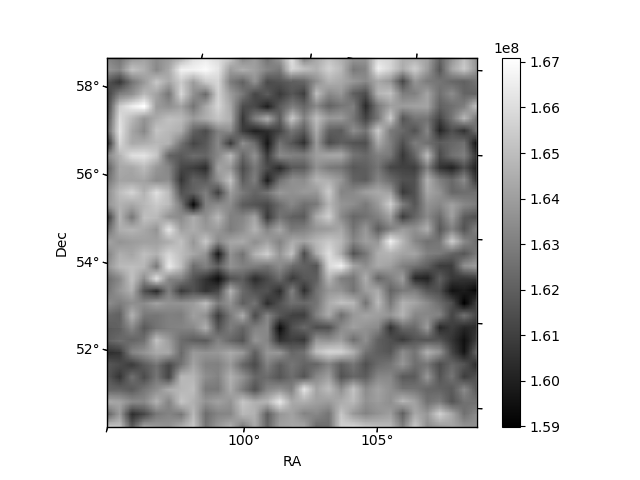
Histogram calculated using DETX and DETY for each event in the final _common_clean file
| Quadrant A | 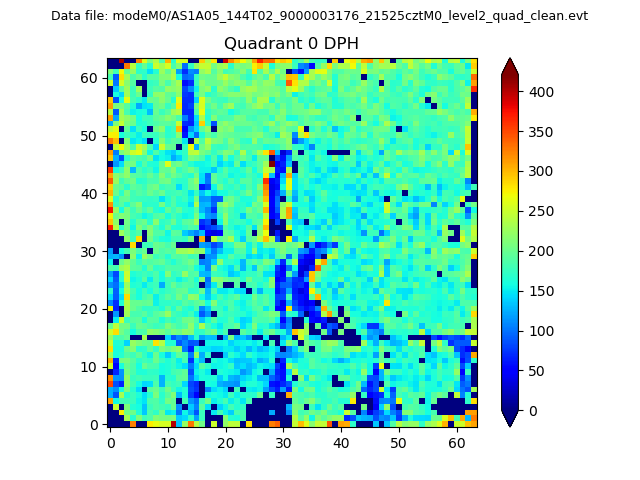 |
 |
Quadrant B |
|---|---|---|---|
| Quadrant D | 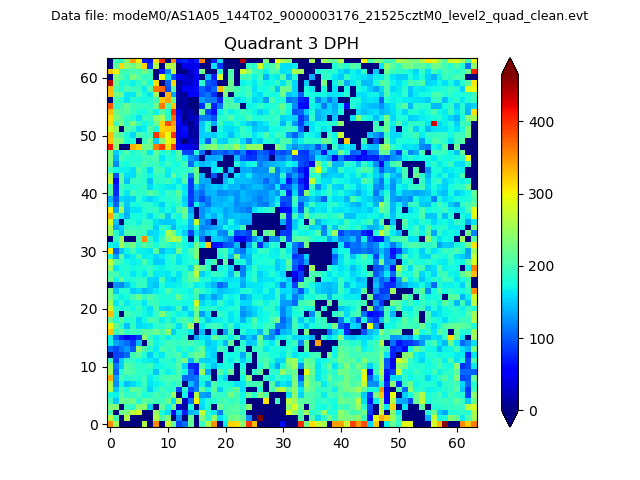 |
 |
Quadrant C |
| Plot type | Count rate plots | Images |
|---|---|---|
| Comparison with Poisson distribution Blue bars denote a histogram of data divided into 1 sec bins. Red curve is a Poisson curve with rate = median count rate of data. |
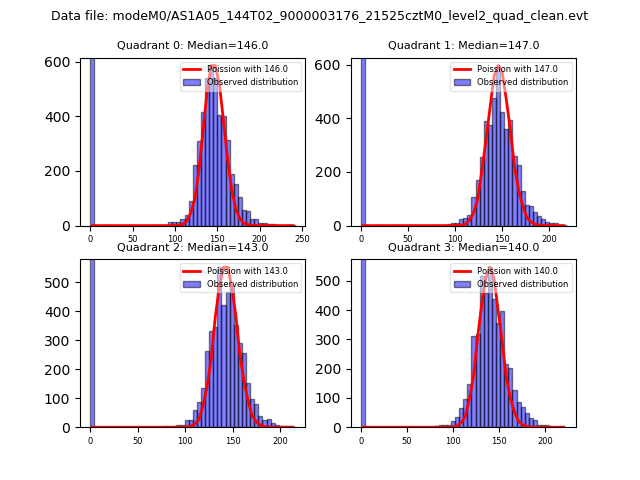 |
 |
| Quadrant-wise count rates Data is divided into 100 sec bins |
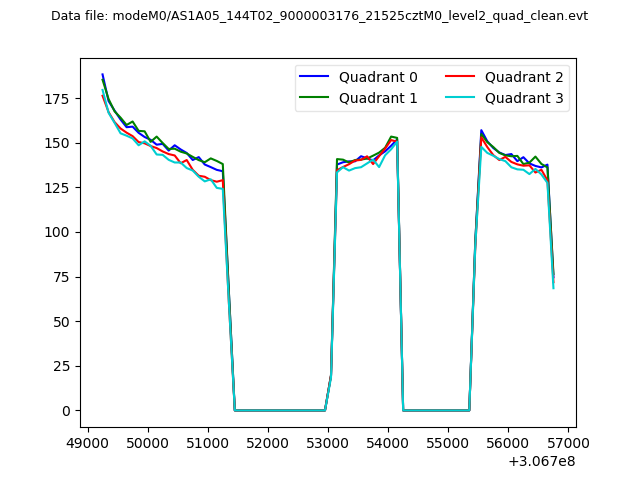 |
|
| Module-wise count rates for Quadrant A Data is divided into 100 sec bins |
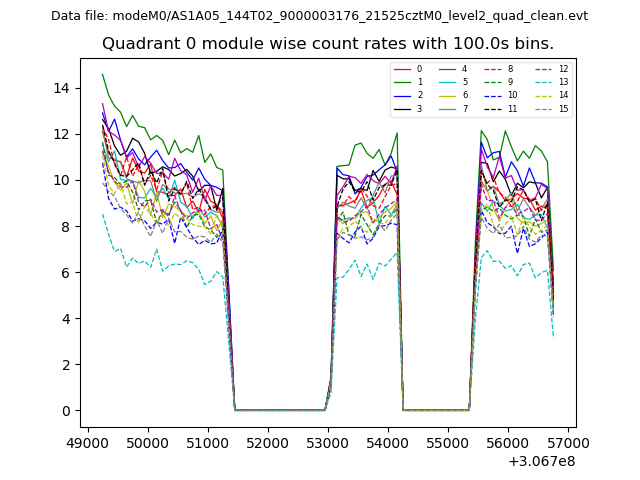 |
 |
| Module-wise count rates for Quadrant B Data is divided into 100 sec bins |
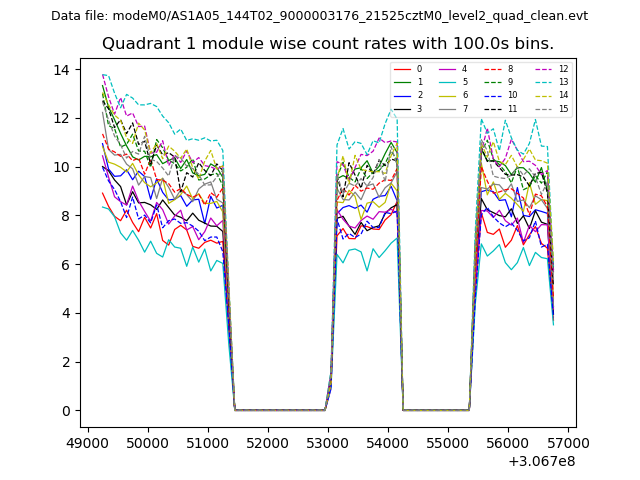 |
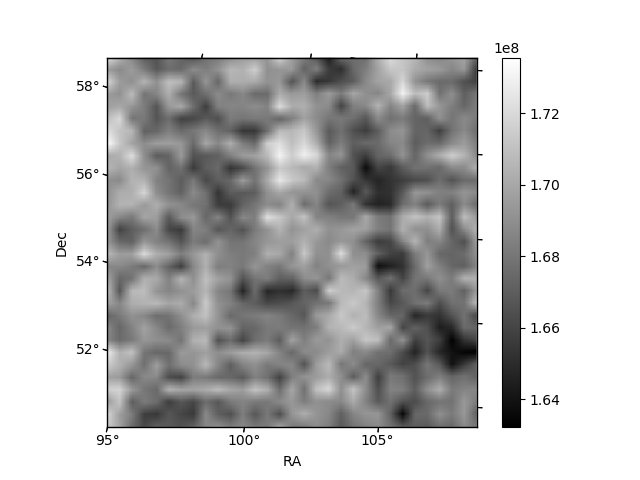 |
| Module-wise count rates for Quadrant C Data is divided into 100 sec bins |
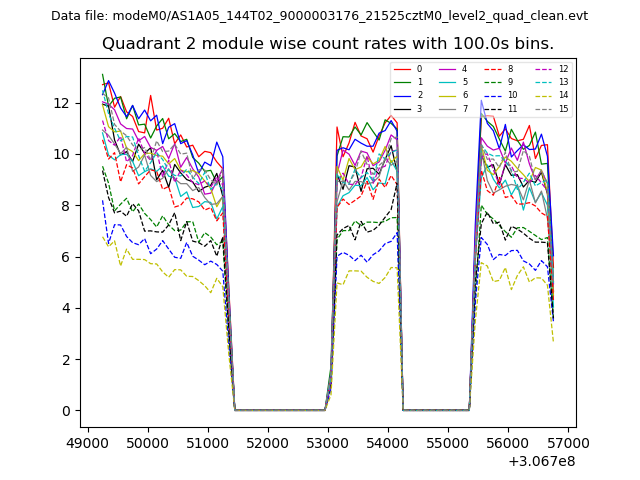 |
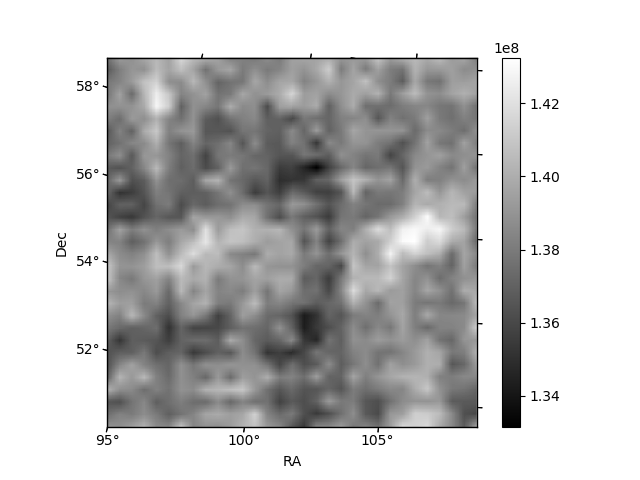 |
| Module-wise count rates for Quadrant D Data is divided into 100 sec bins |
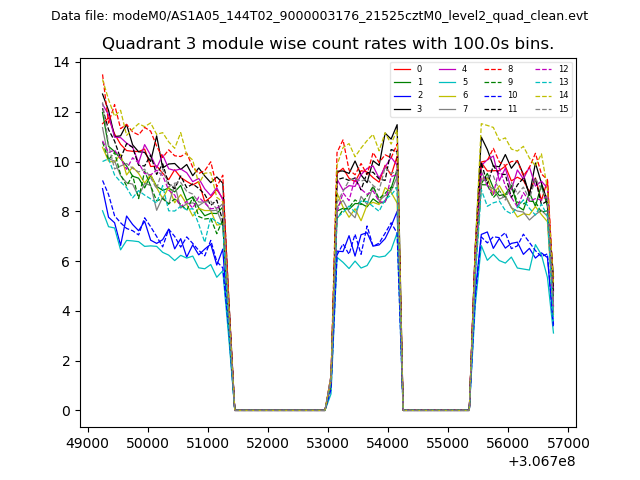 |
 |
| Parameter | Plot |
|---|---|
| CZT HV Monitor | 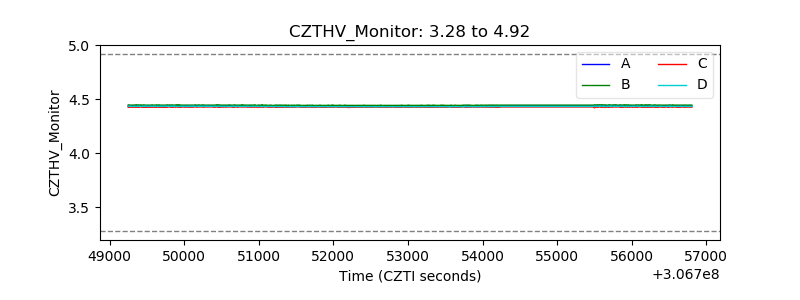 |
| D_VDD |  |
| Temperature 1 | 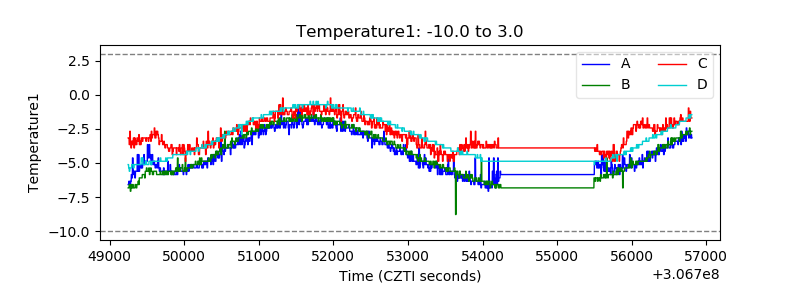 |
| Veto HV Monitor | 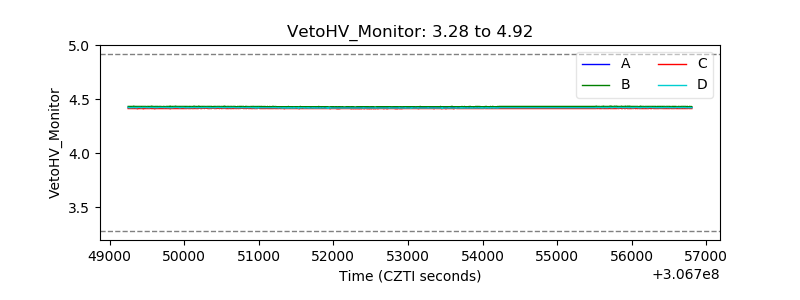 |
| Veto LLD | 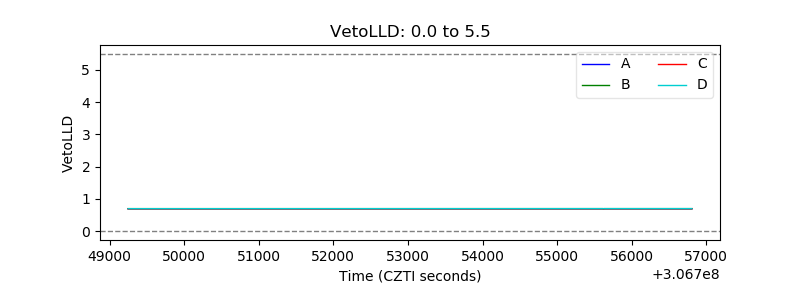 |
| Alpha Counter | 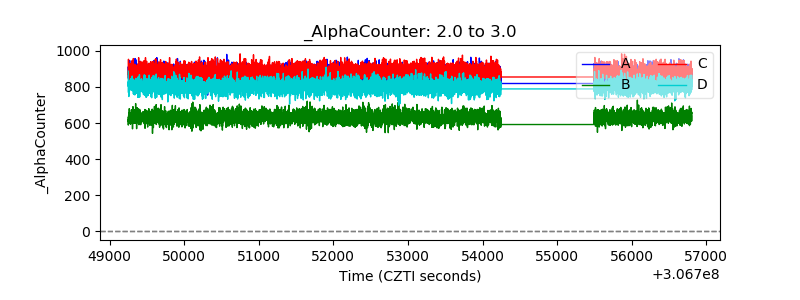 |
| _CPM_Rate | 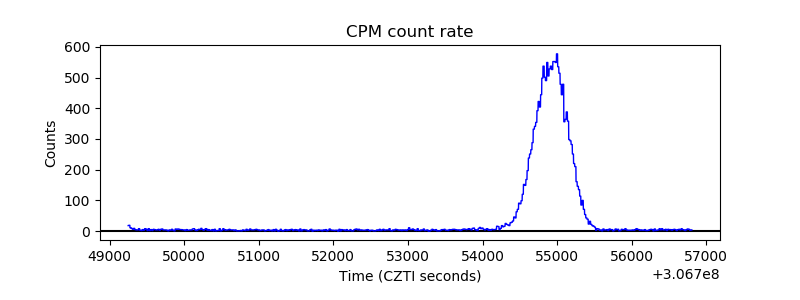 |
| CZT Counter | 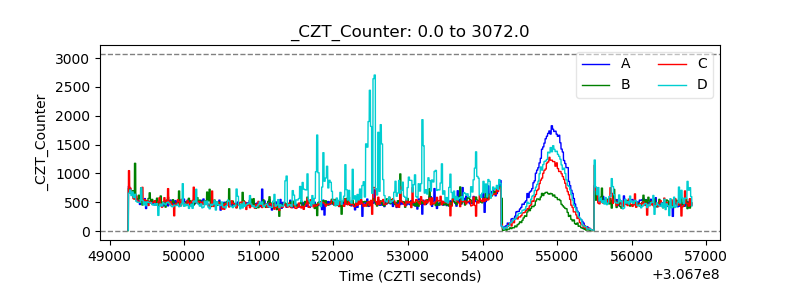 |
| +2.5 Volts monitor |  |
| +5 Volts monitor |  |
| _ROLL_ROT | 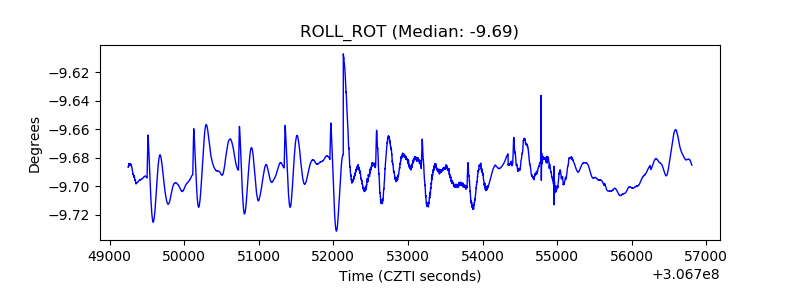 |
| _Roll_DEC | 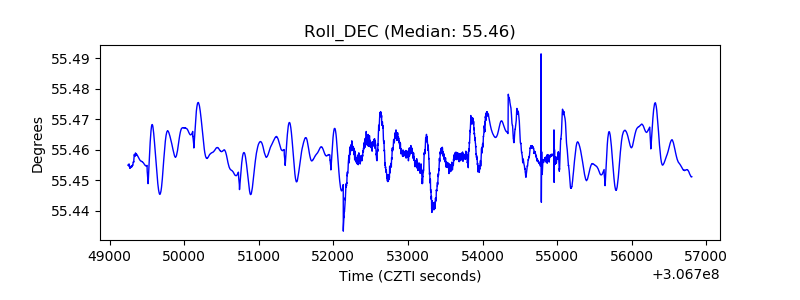 |
| _Roll_RA |  |
| Veto Counter | 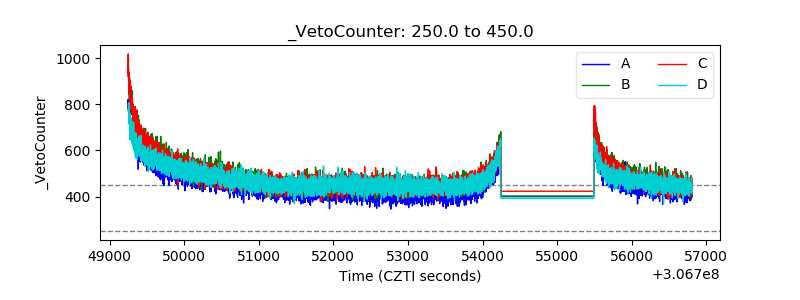 |