| Param | Original file | Final file |
|---|---|---|
| Filename | modeM0/AS1A05_144T02_9000003176_21526cztM0_level2.evt | modeM0/AS1A05_144T02_9000003176_21526cztM0_level2_quad_clean.evt |
| Size (bytes) | 507,876,480 | 103,147,200 |
| Size | 484.3 MB | 98.4 MB |
| Events in quadrant A | 3,201,848 | 672,323 |
| Events in quadrant B | 3,445,459 | 677,196 |
| Events in quadrant C | 3,927,497 | 658,642 |
| Events in quadrant D | 4,351,693 | 649,100 |
| Mode M9 | |||
|---|---|---|---|
| Quadrant | BADHDUFLAG | Total packets | Discarded packets |
| A | 0 | 9 | 0 |
| B | 0 | 9 | 0 |
| C | 0 | 9 | 0 |
| D | 0 | 9 | 0 |
| Mode M0 | |||
|---|---|---|---|
| Quadrant | BADHDUFLAG | Total packets | Discarded packets |
| A | 0 | 13672 | 2 |
| B | 0 | 14375 | 2 |
| C | 0 | 15796 | 2 |
| D | 0 | 17234 | 2 |
| Mode SS | |||
|---|---|---|---|
| Quadrant | BADHDUFLAG | Total packets | Discarded packets |
| A | 0 | 136 | 0 |
| B | 0 | 136 | 0 |
| C | 0 | 136 | 0 |
| D | 0 | 136 | 0 |
| Quadrant | Total seconds | Saturated seconds | Saturation percentage |
|---|---|---|---|
| A | 6695 | 96 | 1.433906% |
| B | 6694 | 124 | 1.852405% |
| C | 6694 | 321 | 4.795339% |
| D | 6695 | 178 | 2.658701% |
Noise dominated data is calculated using 1-second bins in cleaned event files. If a bin has >2000 counts, and if more than 50% of those come from <1% of pixels, then it is considered to be noise-dominated and hence unusable.
| Quadrant | # 1 sec bins | Bins with >0 counts | Bins with >2000 counts | High rate bins dominated by noise | Noise dominated (total time) | Noise dominated (detector-on time) | Marked lightcurve |
|---|---|---|---|---|---|---|---|
| A | 7560 | 6696 | 0 | 0 | 0.00% | 0.00% | 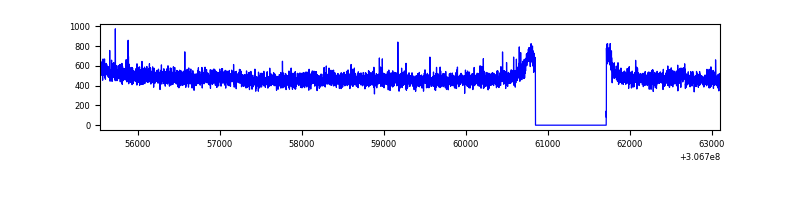 |
| B | 7559 | 6695 | 5 | 5 | 0.07% | 0.07% | 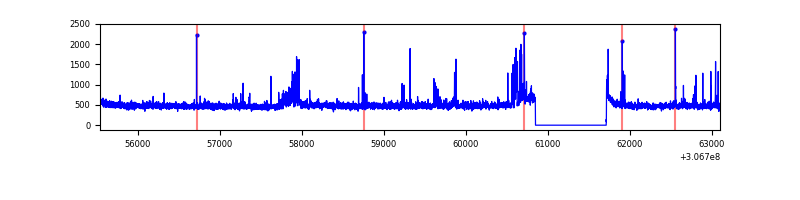 |
| C | 7559 | 6695 | 125 | 125 | 1.65% | 1.87% | 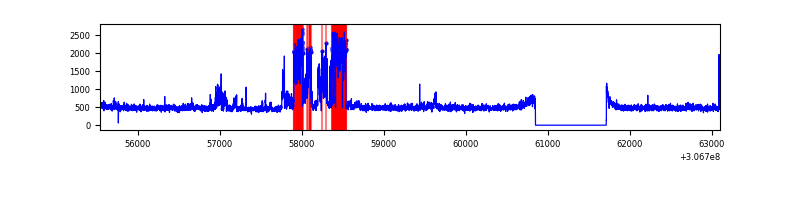 |
| D | 7560 | 6696 | 102 | 102 | 1.35% | 1.52% | 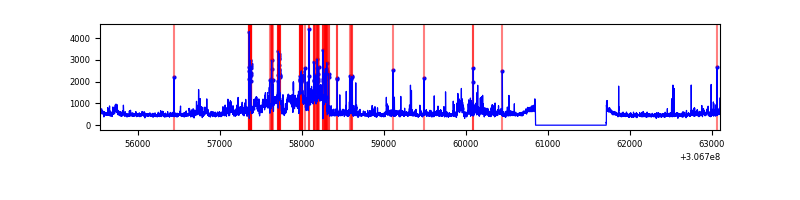 |
Top three noisy pixels from each quadrant. If the there are fewer than three noisy pixels in the level2.evt file, extra rows are filled as -1
| Pixel properties | Quadrant properties | ||||||
|---|---|---|---|---|---|---|---|
| Quadrant | DetID | PixID | Counts | Sigma | Mean | Median | Sigma |
| A | 15 | 48 | 29266 | 172.64 | 823 | 808 | 164.8 |
| A | 13 | 254 | 10791 | 60.56 | 823 | 808 | 164.8 |
| A | 0 | 226 | 7149 | 38.47 | 823 | 808 | 164.8 |
| B | 6 | 36 | 92203 | 594.36 | 811 | 791 | 153.8 |
| B | 0 | 190 | 82699 | 532.56 | 811 | 791 | 153.8 |
| B | 0 | 230 | 30653 | 194.16 | 811 | 791 | 153.8 |
| C | 3 | 233 | 776466 | 4335.61 | 776 | 781 | 178.9 |
| C | 14 | 238 | 125733 | 698.41 | 776 | 781 | 178.9 |
| C | 13 | 61 | 5480 | 26.26 | 776 | 781 | 178.9 |
| D | 1 | 52 | 711755 | 3557.32 | 789 | 770 | 199.9 |
| D | 14 | 35 | 236132 | 1177.6 | 789 | 770 | 199.9 |
| D | 7 | 38 | 158947 | 791.42 | 789 | 770 | 199.9 |
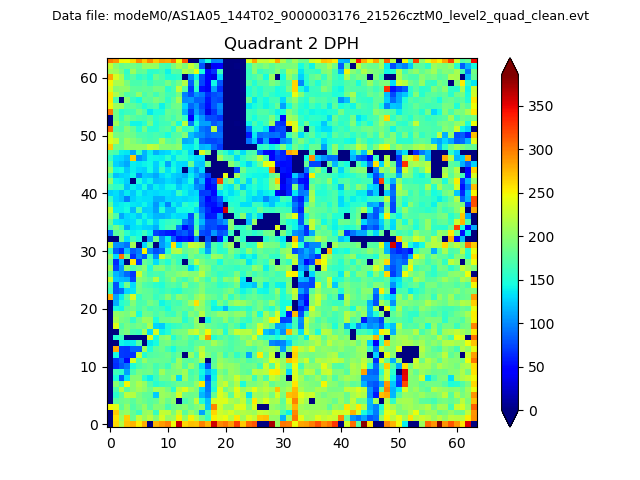
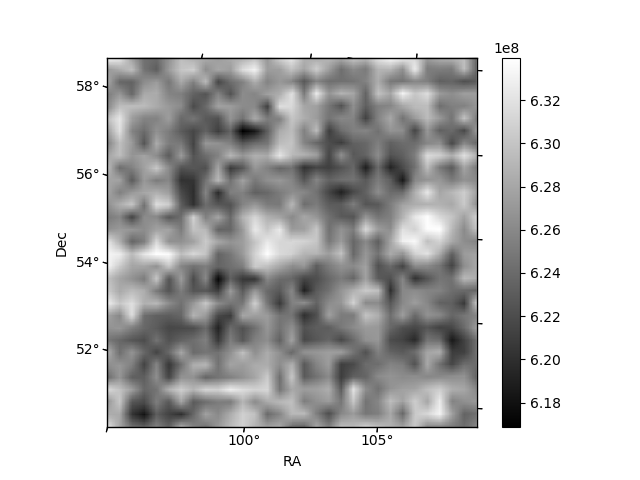
Histogram calculated using DETX and DETY for each event in the final _common_clean file
| Quadrant A | 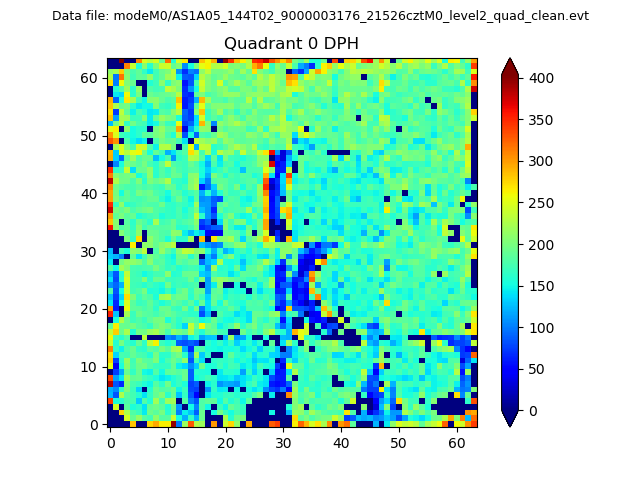 |
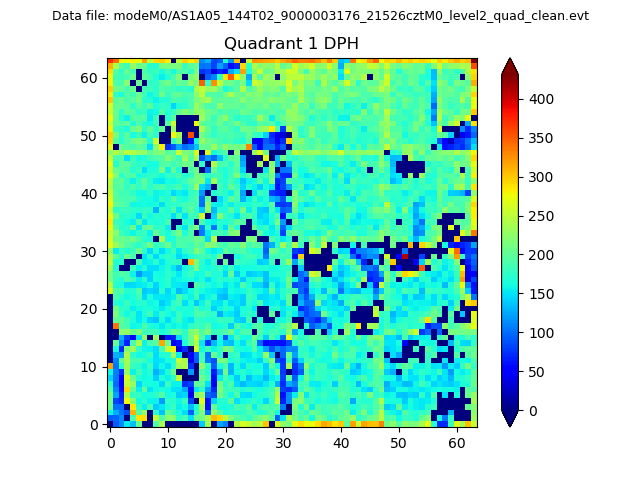 |
Quadrant B |
|---|---|---|---|
| Quadrant D | 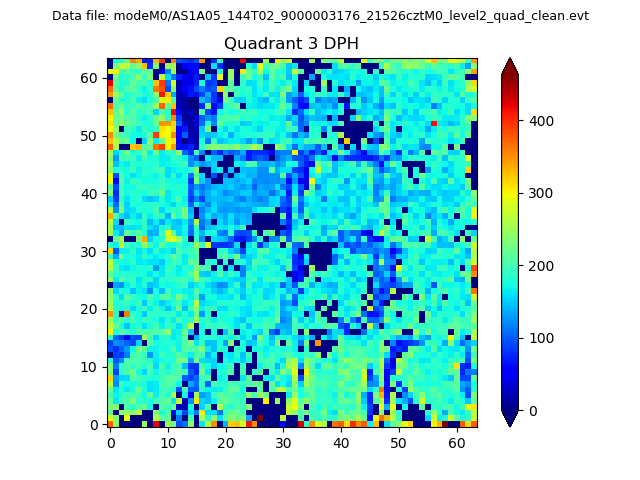 |
 |
Quadrant C |
| Plot type | Count rate plots | Images |
|---|---|---|
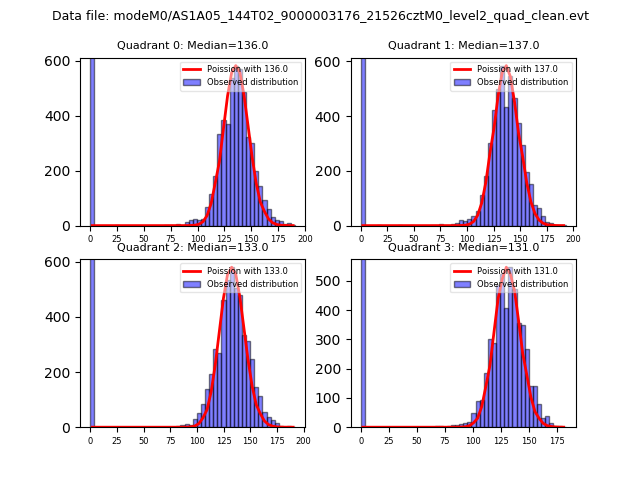
| Comparison with Poisson distribution Blue bars denote a histogram of data divided into 1 sec bins. Red curve is a Poisson curve with rate = median count rate of data. |
 |
 |
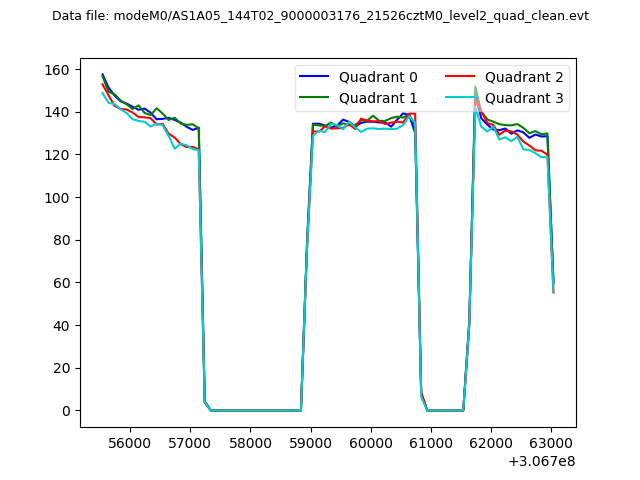
| Quadrant-wise count rates Data is divided into 100 sec bins |
 |
|
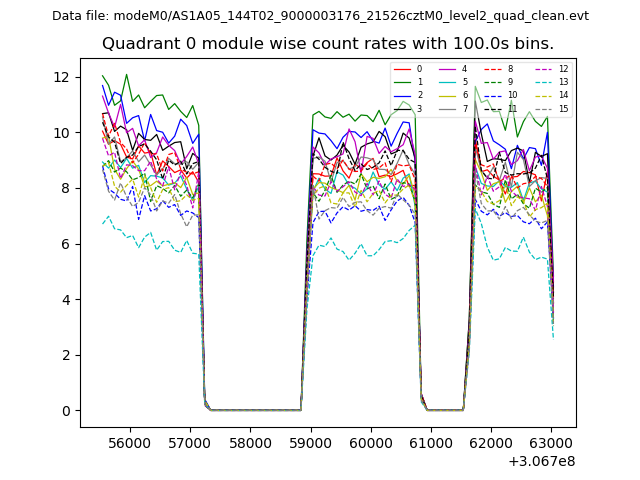
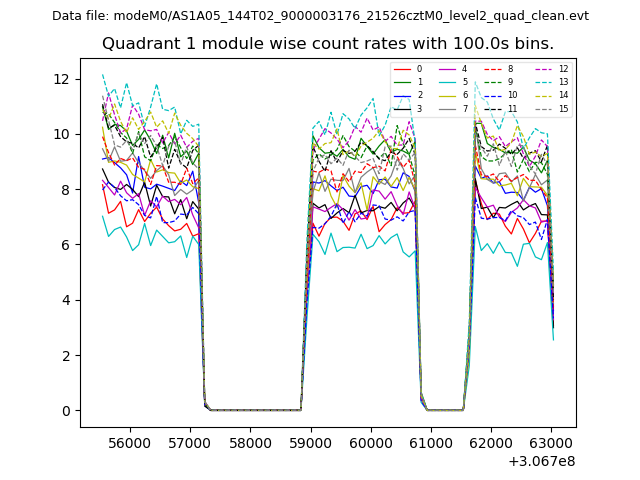
| Module-wise count rates for Quadrant A Data is divided into 100 sec bins |
 |
 |
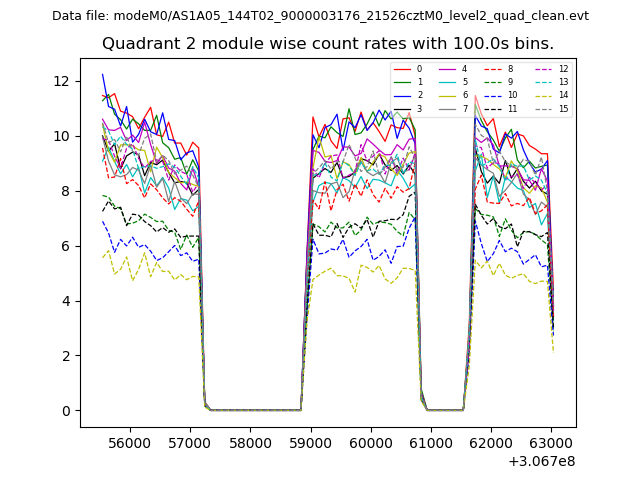
| Module-wise count rates for Quadrant B Data is divided into 100 sec bins |
 |
 |
| Module-wise count rates for Quadrant C Data is divided into 100 sec bins |
 |
 |
| Module-wise count rates for Quadrant D Data is divided into 100 sec bins |
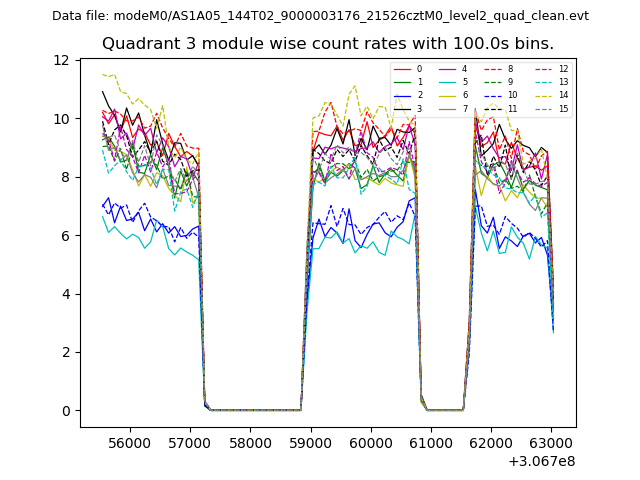 |
 |
| Parameter | Plot |
|---|---|
| CZT HV Monitor | 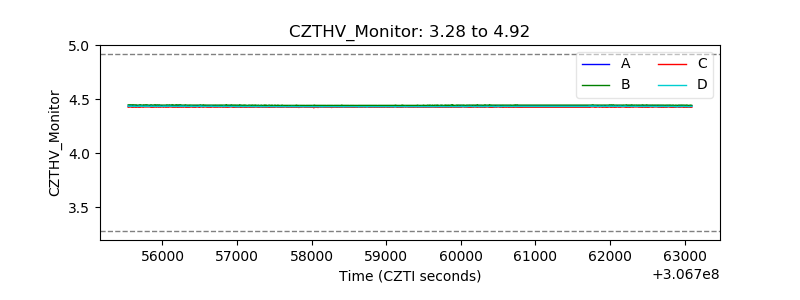 |
| D_VDD | 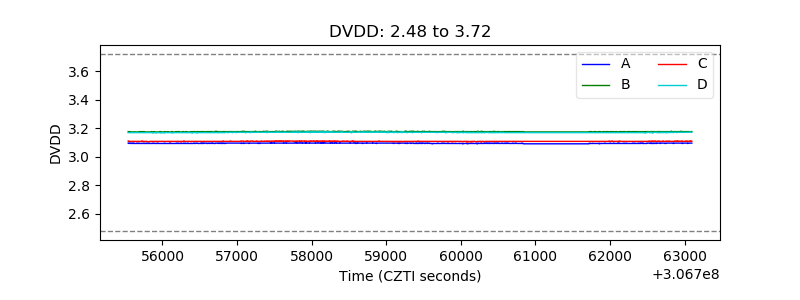 |
| Temperature 1 | 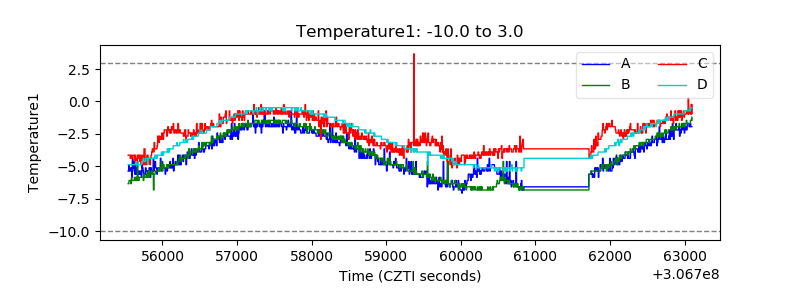 |
| Veto HV Monitor |  |
| Veto LLD | 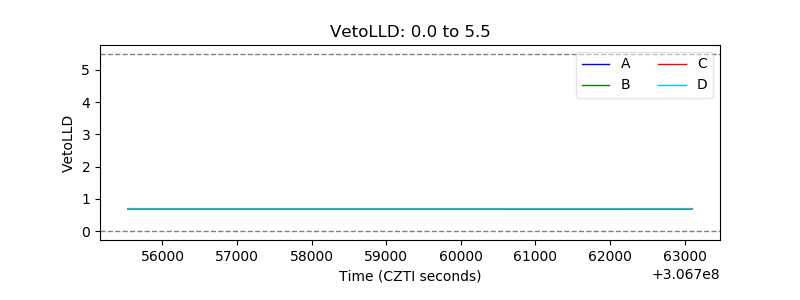 |
| Alpha Counter |  |
| _CPM_Rate | 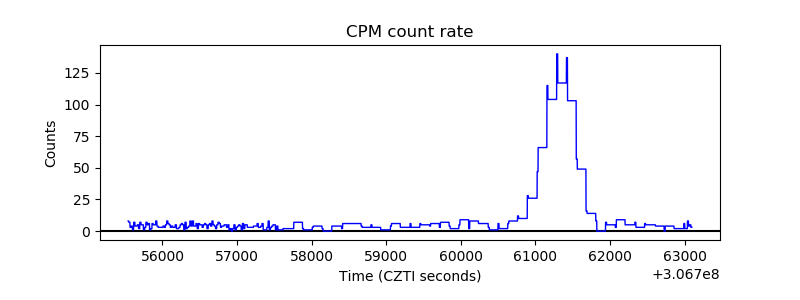 |
| CZT Counter | 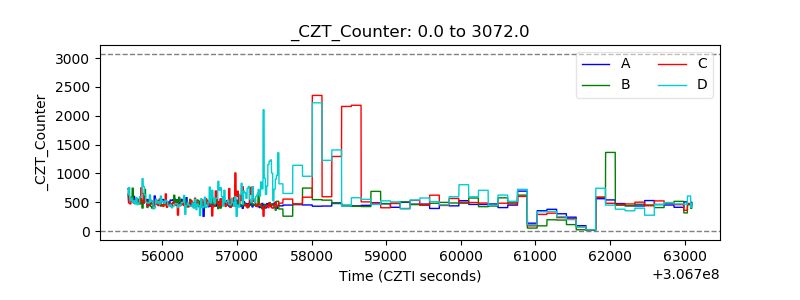 |
| +2.5 Volts monitor |  |
| +5 Volts monitor |  |
| _ROLL_ROT | 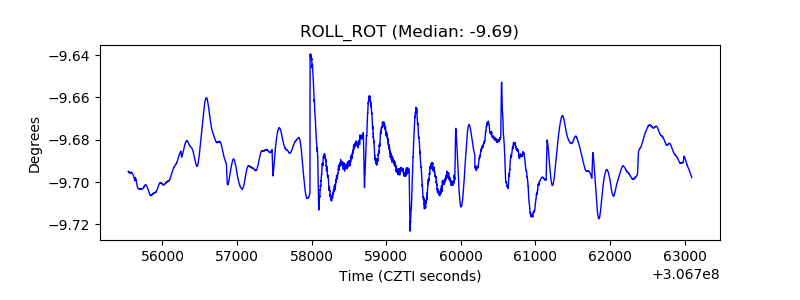 |
| _Roll_DEC | 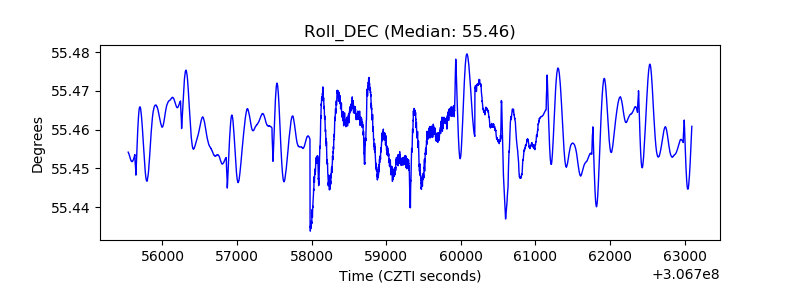 |
| _Roll_RA | 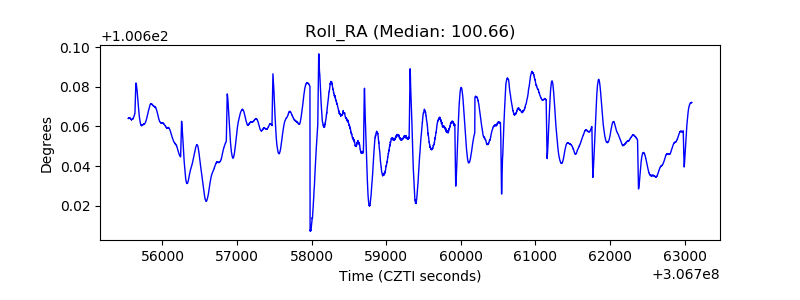 |
| Veto Counter | 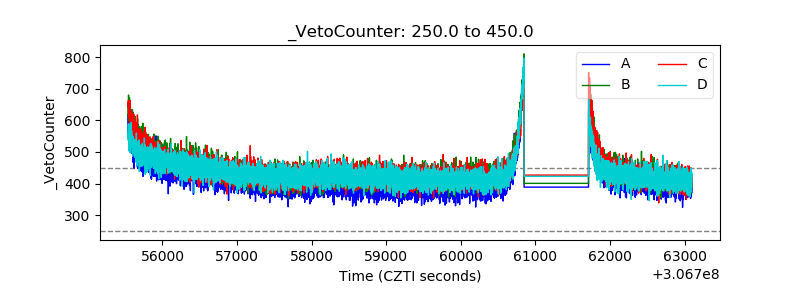 |