| Param | Original file | Final file |
|---|---|---|
| Filename | modeM0/AS1A05_144T02_9000003176_21528cztM0_level2.evt | modeM0/AS1A05_144T02_9000003176_21528cztM0_level2_quad_clean.evt |
| Size (bytes) | 581,970,240 | 100,198,080 |
| Size | 555.0 MB | 95.6 MB |
| Events in quadrant A | 3,677,234 | 629,548 |
| Events in quadrant B | 3,741,465 | 640,016 |
| Events in quadrant C | 5,348,427 | 616,128 |
| Events in quadrant D | 4,331,501 | 608,770 |
| Mode M9 | |||
|---|---|---|---|
| Quadrant | BADHDUFLAG | Total packets | Discarded packets |
| A | 0 | 3 | 0 |
| B | 0 | 4 | 0 |
| C | 0 | 4 | 0 |
| D | 0 | 4 | 0 |
| Mode M0 | |||
|---|---|---|---|
| Quadrant | BADHDUFLAG | Total packets | Discarded packets |
| A | 0 | 15974 | 2 |
| B | 0 | 16076 | 2 |
| C | 0 | 21086 | 2 |
| D | 0 | 18025 | 2 |
| Mode SS | |||
|---|---|---|---|
| Quadrant | BADHDUFLAG | Total packets | Discarded packets |
| A | 0 | 156 | 0 |
| B | 0 | 156 | 0 |
| C | 0 | 156 | 0 |
| D | 0 | 156 | 0 |
| Quadrant | Total seconds | Saturated seconds | Saturation percentage |
|---|---|---|---|
| A | 7764 | 150 | 1.931994% |
| B | 7764 | 178 | 2.292633% |
| C | 7764 | 355 | 4.572385% |
| D | 7764 | 325 | 4.185987% |
Noise dominated data is calculated using 1-second bins in cleaned event files. If a bin has >2000 counts, and if more than 50% of those come from <1% of pixels, then it is considered to be noise-dominated and hence unusable.
| Quadrant | # 1 sec bins | Bins with >0 counts | Bins with >2000 counts | High rate bins dominated by noise | Noise dominated (total time) | Noise dominated (detector-on time) | Marked lightcurve |
|---|---|---|---|---|---|---|---|
| A | 7914 | 7765 | 0 | 0 | 0.00% | 0.00% | 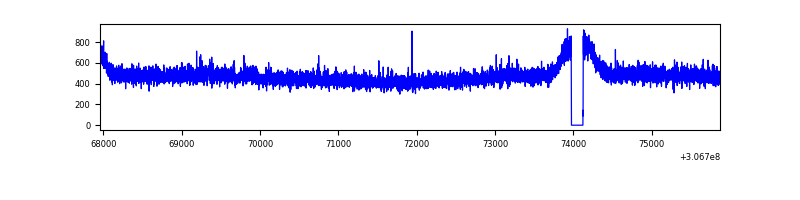 |
| B | 7914 | 7765 | 0 | 0 | 0.00% | 0.00% | 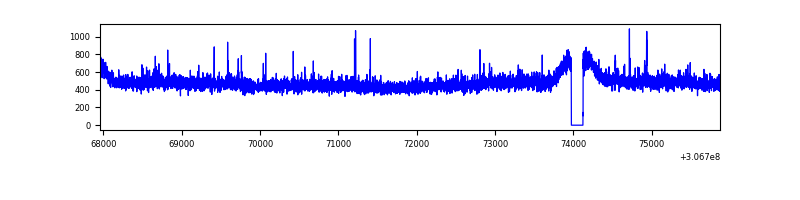 |
| C | 7914 | 7765 | 46 | 46 | 0.58% | 0.59% | 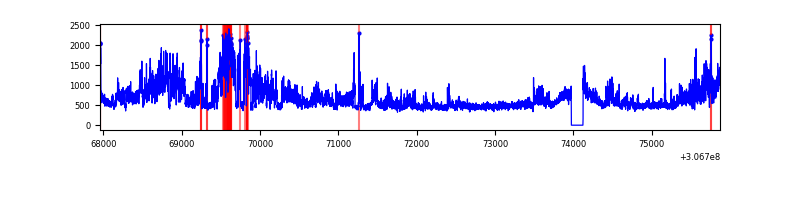 |
| D | 7914 | 7765 | 158 | 158 | 2.00% | 2.03% | 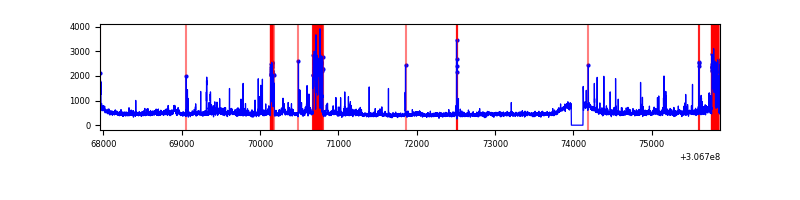 |
Top three noisy pixels from each quadrant. If the there are fewer than three noisy pixels in the level2.evt file, extra rows are filled as -1
| Pixel properties | Quadrant properties | ||||||
|---|---|---|---|---|---|---|---|
| Quadrant | DetID | PixID | Counts | Sigma | Mean | Median | Sigma |
| A | 5 | 203 | 26654 | 135.38 | 945 | 922 | 190.1 |
| A | 13 | 254 | 13229 | 64.75 | 945 | 922 | 190.1 |
| A | 0 | 226 | 8203 | 38.31 | 945 | 922 | 190.1 |
| B | 0 | 230 | 34267 | 185.91 | 936 | 912 | 179.4 |
| B | 12 | 111 | 21939 | 117.2 | 936 | 912 | 179.4 |
| B | 11 | 111 | 19120 | 101.48 | 936 | 912 | 179.4 |
| C | 3 | 233 | 1688132 | 8103.62 | 894 | 898 | 208.2 |
| C | 14 | 238 | 140949 | 672.65 | 894 | 898 | 208.2 |
| C | 10 | 91 | 28238 | 131.31 | 894 | 898 | 208.2 |
| D | 7 | 38 | 483090 | 2128.11 | 905 | 882 | 226.6 |
| D | 14 | 35 | 192678 | 846.44 | 905 | 882 | 226.6 |
| D | 13 | 153 | 62782 | 273.18 | 905 | 882 | 226.6 |
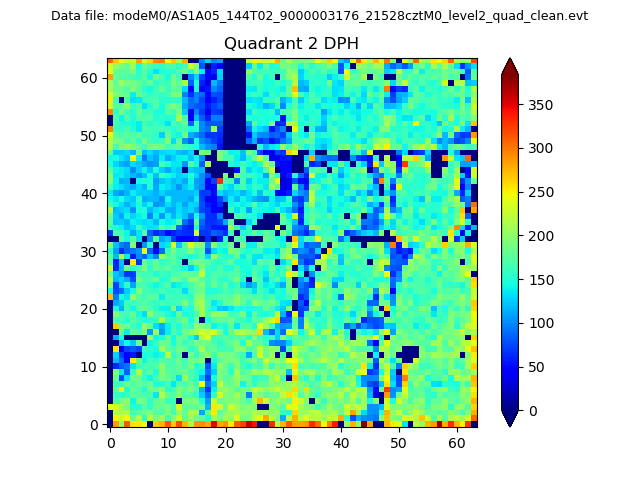
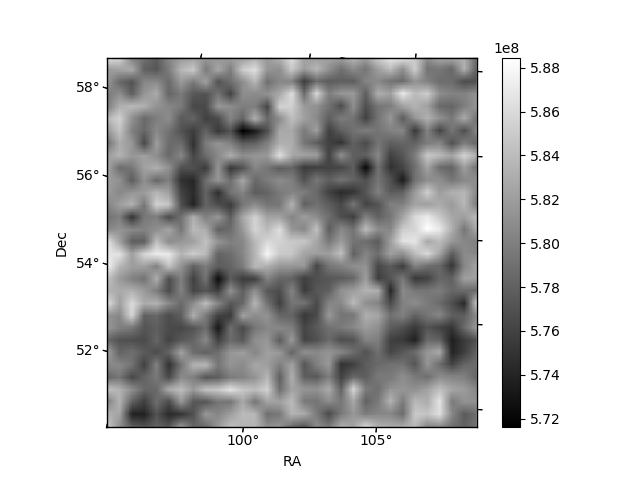
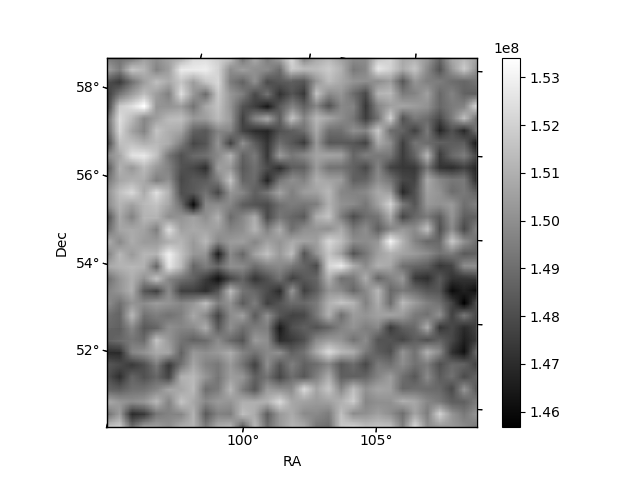
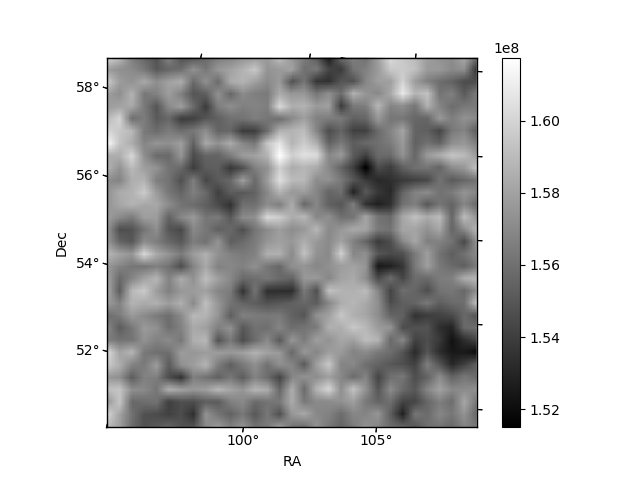
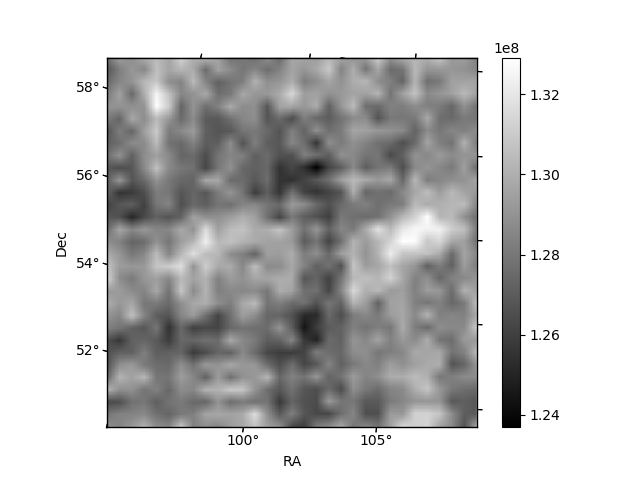
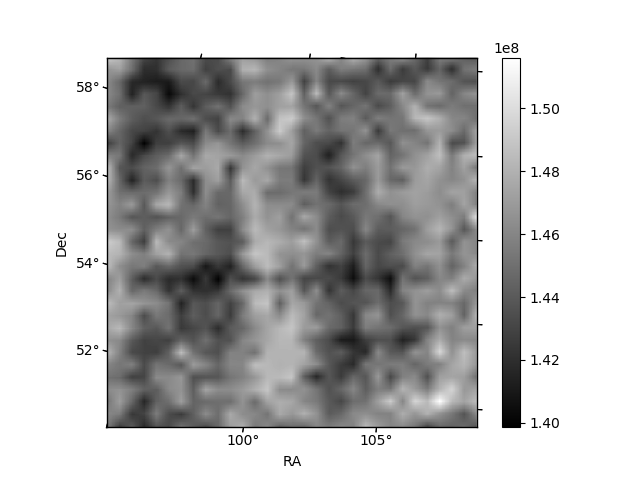
Histogram calculated using DETX and DETY for each event in the final _common_clean file
| Quadrant A | 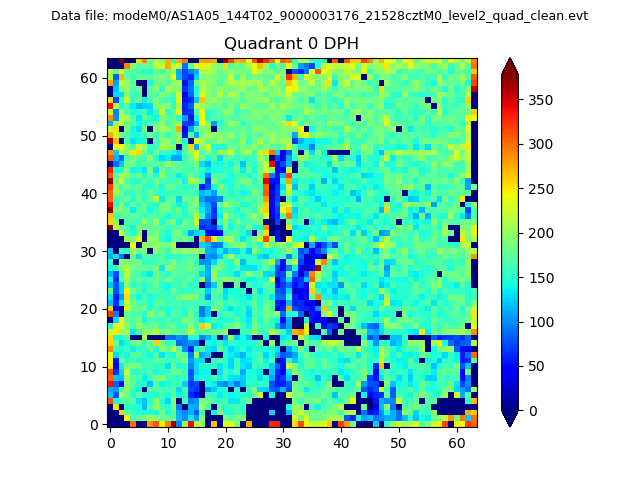 |
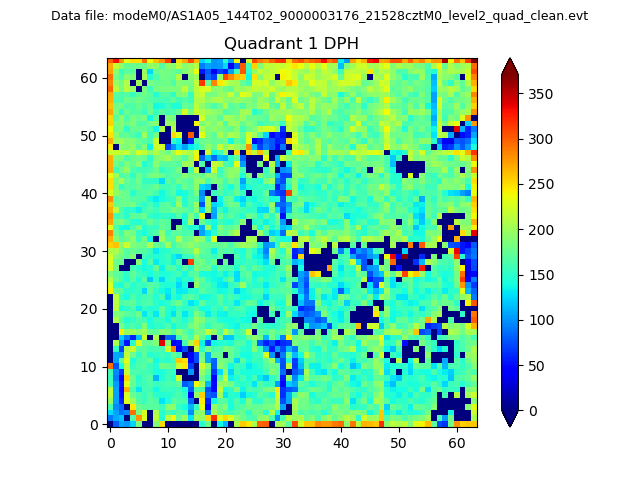 |
Quadrant B |
|---|---|---|---|
| Quadrant D | 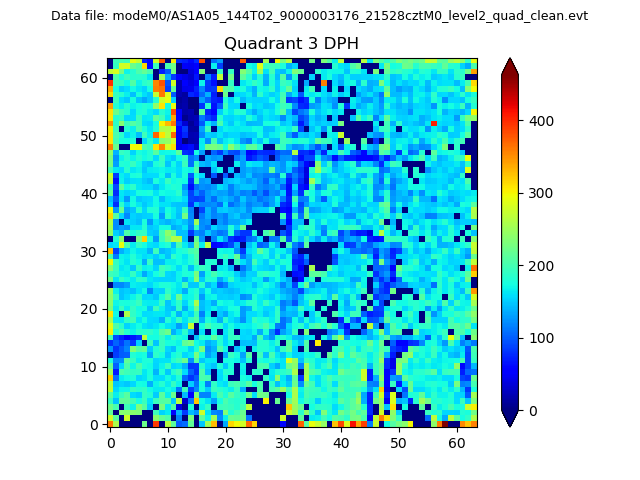 |
 |
Quadrant C |
| Plot type | Count rate plots | Images |
|---|---|---|
| Comparison with Poisson distribution Blue bars denote a histogram of data divided into 1 sec bins. Red curve is a Poisson curve with rate = median count rate of data. |
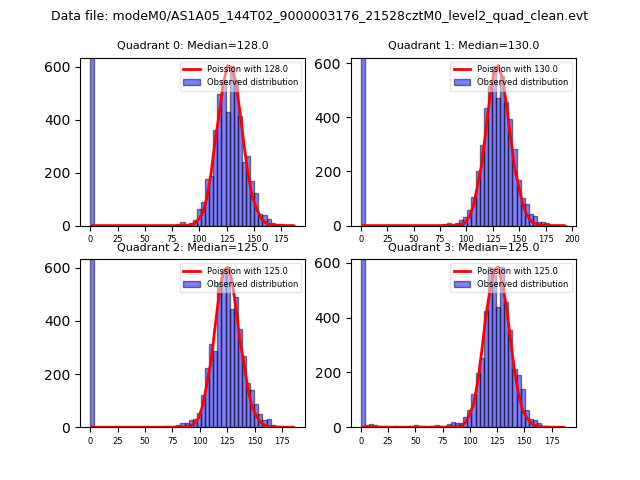 |
 |
| Quadrant-wise count rates Data is divided into 100 sec bins |
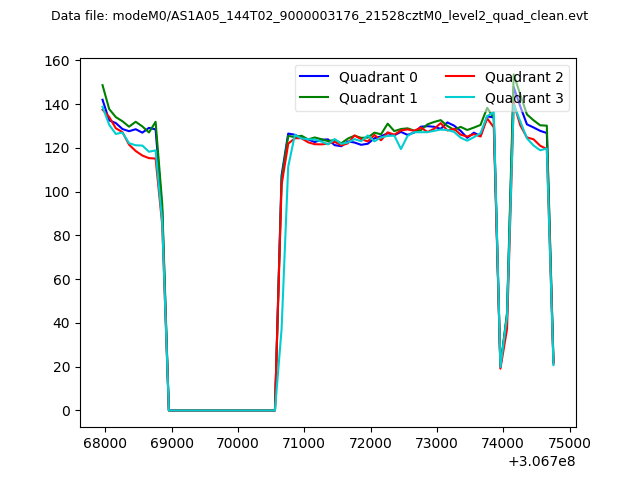 |
|
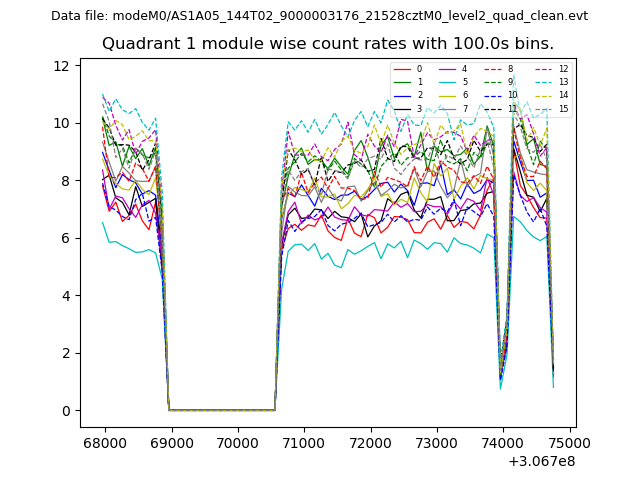
| Module-wise count rates for Quadrant A Data is divided into 100 sec bins |
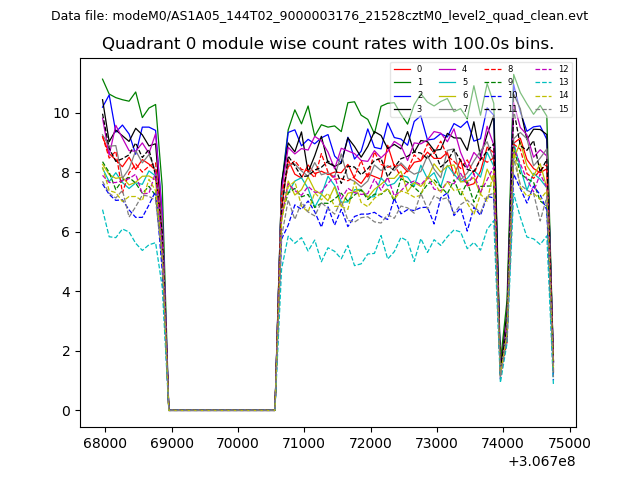 |
 |
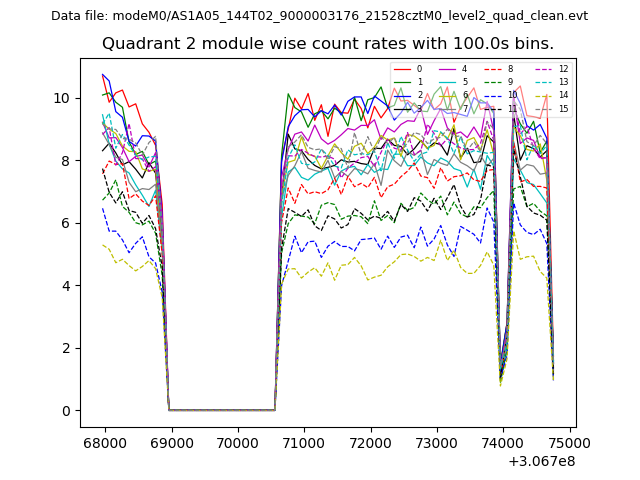
| Module-wise count rates for Quadrant B Data is divided into 100 sec bins |
 |
 |
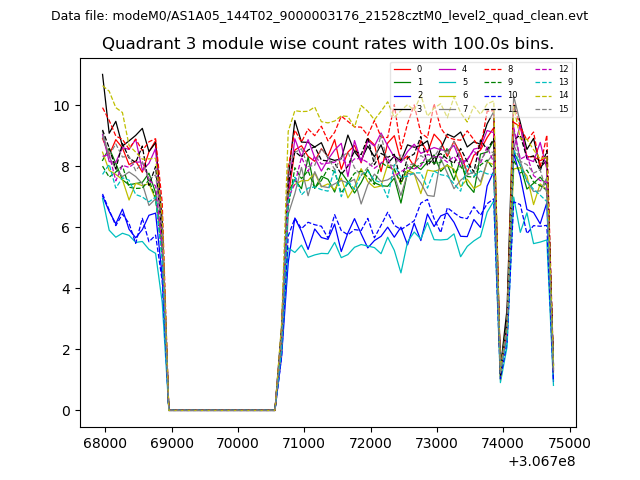
| Module-wise count rates for Quadrant C Data is divided into 100 sec bins |
 |
 |
| Module-wise count rates for Quadrant D Data is divided into 100 sec bins |
 |
 |
| Parameter | Plot |
|---|---|
| CZT HV Monitor | 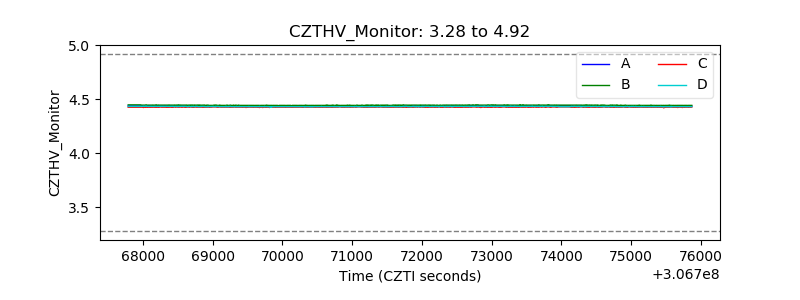 |
| D_VDD |  |
| Temperature 1 |  |
| Veto HV Monitor | 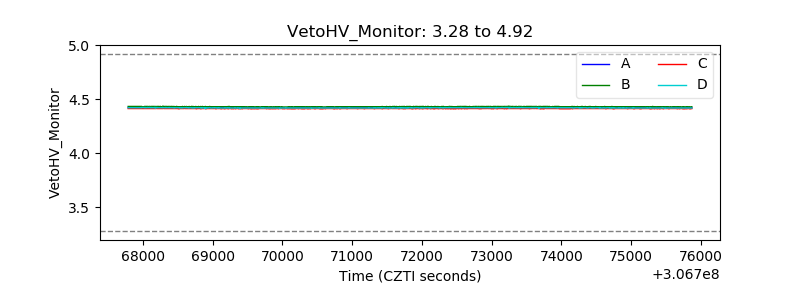 |
| Veto LLD | 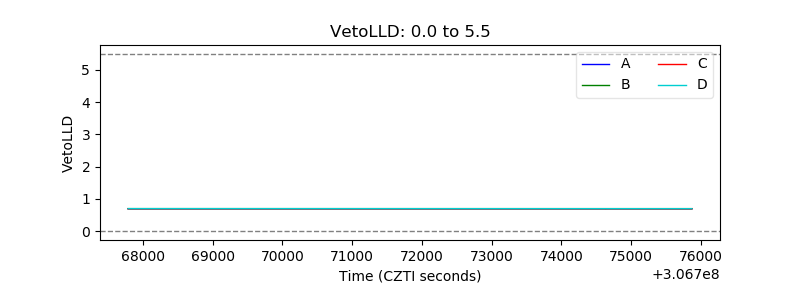 |
| Alpha Counter |  |
| _CPM_Rate | 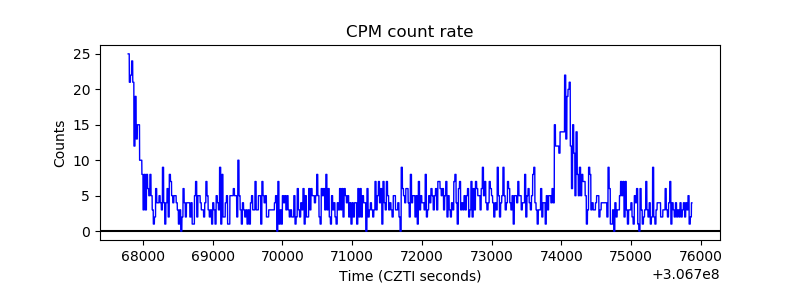 |
| CZT Counter | 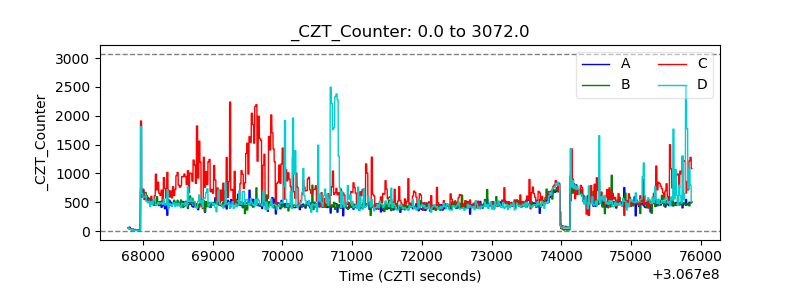 |
| +2.5 Volts monitor |  |
| +5 Volts monitor |  |
| _ROLL_ROT | 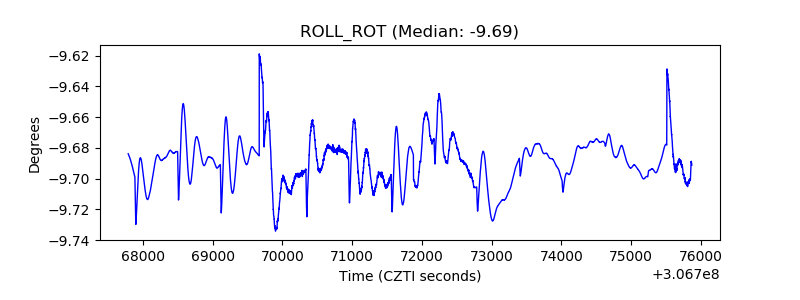 |
| _Roll_DEC | 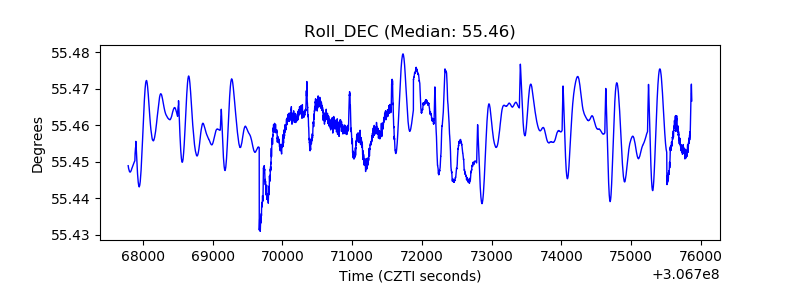 |
| _Roll_RA | 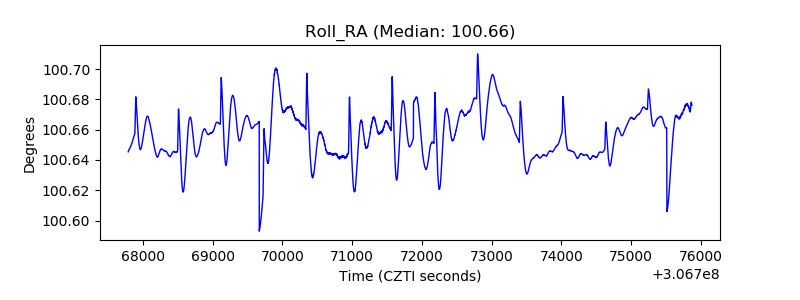 |
| Veto Counter | 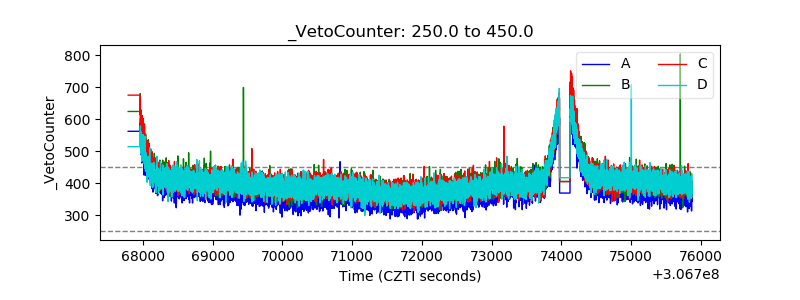 |