| Param | Original file | Final file |
|---|---|---|
| Filename | modeM0/AS1A05_144T02_9000003176_21529cztM0_level2.evt | modeM0/AS1A05_144T02_9000003176_21529cztM0_level2_quad_clean.evt |
| Size (bytes) | 593,519,040 | 81,339,840 |
| Size | 566.0 MB | 77.6 MB |
| Events in quadrant A | 3,296,835 | 495,445 |
| Events in quadrant B | 3,452,409 | 499,413 |
| Events in quadrant C | 5,386,221 | 489,840 |
| Events in quadrant D | 5,356,205 | 482,170 |
| Mode M9 | |||
|---|---|---|---|
| Quadrant | BADHDUFLAG | Total packets | Discarded packets |
| A | 0 | 3 | 0 |
| B | 0 | 3 | 0 |
| C | 0 | 3 | 0 |
| D | 0 | 3 | 0 |
| Mode M0 | |||
|---|---|---|---|
| Quadrant | BADHDUFLAG | Total packets | Discarded packets |
| A | 0 | 14495 | 1 |
| B | 0 | 14798 | 1 |
| C | 0 | 20723 | 4 |
| D | 0 | 20683 | 1 |
| Mode SS | |||
|---|---|---|---|
| Quadrant | BADHDUFLAG | Total packets | Discarded packets |
| A | 0 | 146 | 0 |
| B | 0 | 146 | 0 |
| C | 0 | 146 | 0 |
| D | 0 | 146 | 0 |
| Quadrant | Total seconds | Saturated seconds | Saturation percentage |
|---|---|---|---|
| A | 7121 | 51 | 0.716192% |
| B | 7121 | 74 | 1.039180% |
| C | 7120 | 458 | 6.432584% |
| D | 7120 | 763 | 10.716292% |
Noise dominated data is calculated using 1-second bins in cleaned event files. If a bin has >2000 counts, and if more than 50% of those come from <1% of pixels, then it is considered to be noise-dominated and hence unusable.
| Quadrant | # 1 sec bins | Bins with >0 counts | Bins with >2000 counts | High rate bins dominated by noise | Noise dominated (total time) | Noise dominated (detector-on time) | Marked lightcurve |
|---|---|---|---|---|---|---|---|
| A | 7451 | 7122 | 0 | 0 | 0.00% | 0.00% | 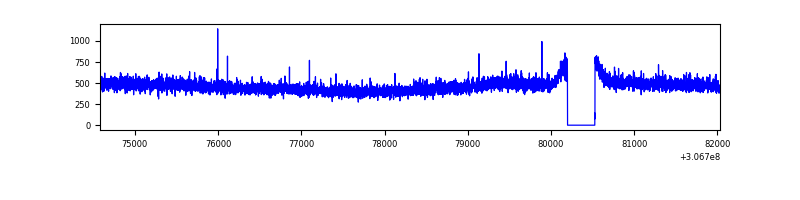 |
| B | 7451 | 7122 | 3 | 3 | 0.04% | 0.04% | 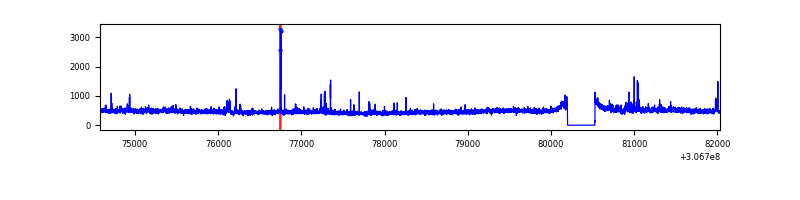 |
| C | 7450 | 7121 | 155 | 155 | 2.08% | 2.18% | 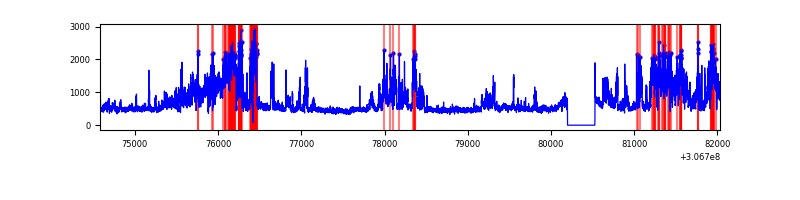 |
| D | 7450 | 7121 | 605 | 605 | 8.12% | 8.50% | 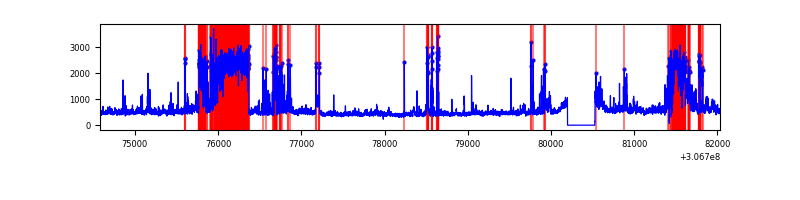 |
Top three noisy pixels from each quadrant. If the there are fewer than three noisy pixels in the level2.evt file, extra rows are filled as -1
| Pixel properties | Quadrant properties | ||||||
|---|---|---|---|---|---|---|---|
| Quadrant | DetID | PixID | Counts | Sigma | Mean | Median | Sigma |
| A | 13 | 254 | 12118 | 65.26 | 854 | 835 | 172.9 |
| A | 0 | 226 | 7463 | 38.34 | 854 | 835 | 172.9 |
| A | 3 | 137 | 7134 | 36.44 | 854 | 835 | 172.9 |
| B | 0 | 190 | 52731 | 324.17 | 845 | 824 | 160.1 |
| B | 0 | 230 | 34780 | 212.07 | 845 | 824 | 160.1 |
| B | 3 | 64 | 24694 | 149.08 | 845 | 824 | 160.1 |
| C | 3 | 233 | 2003074 | 10694.97 | 806 | 811 | 187.2 |
| C | 14 | 238 | 126483 | 671.27 | 806 | 811 | 187.2 |
| C | 10 | 91 | 95833 | 507.55 | 806 | 811 | 187.2 |
| D | 7 | 38 | 1517811 | 7880.67 | 790 | 769 | 192.5 |
| D | 1 | 52 | 293887 | 1522.68 | 790 | 769 | 192.5 |
| D | 14 | 35 | 293726 | 1521.84 | 790 | 769 | 192.5 |
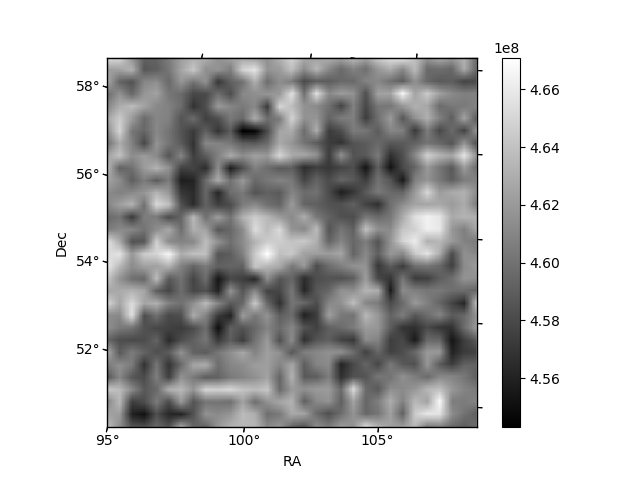
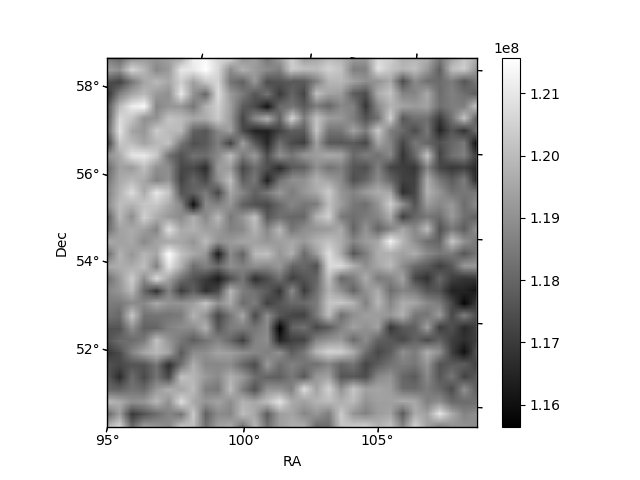
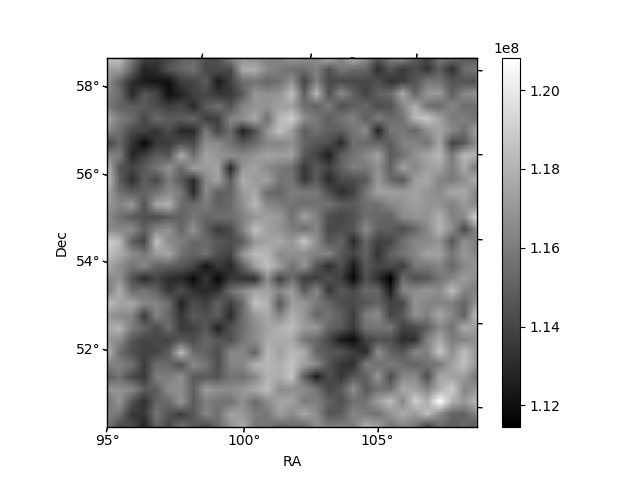
Histogram calculated using DETX and DETY for each event in the final _common_clean file
| Quadrant A | 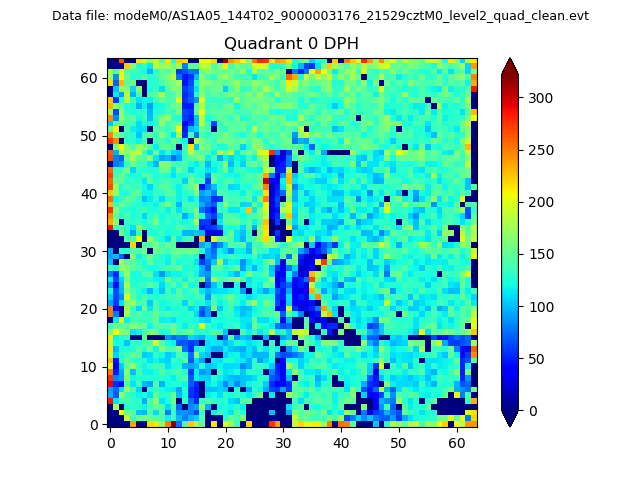 |
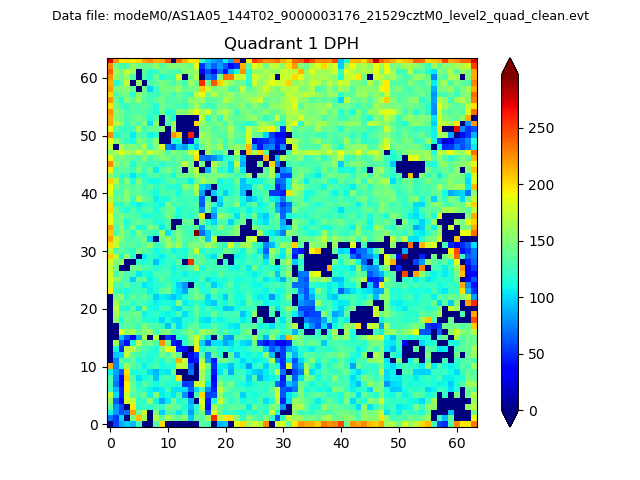 |
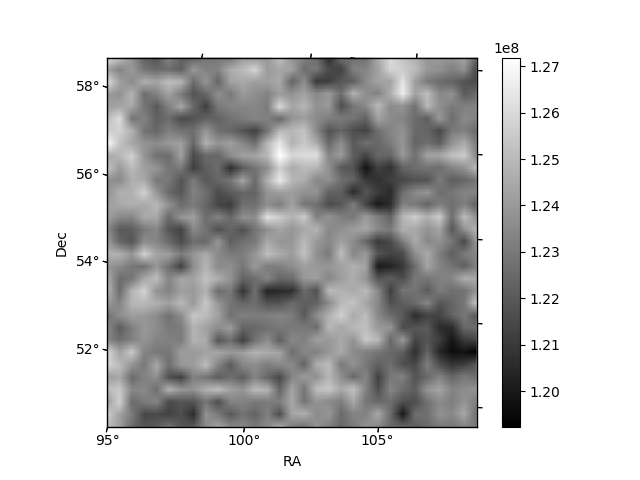
Quadrant B |
|---|---|---|---|
| Quadrant D | 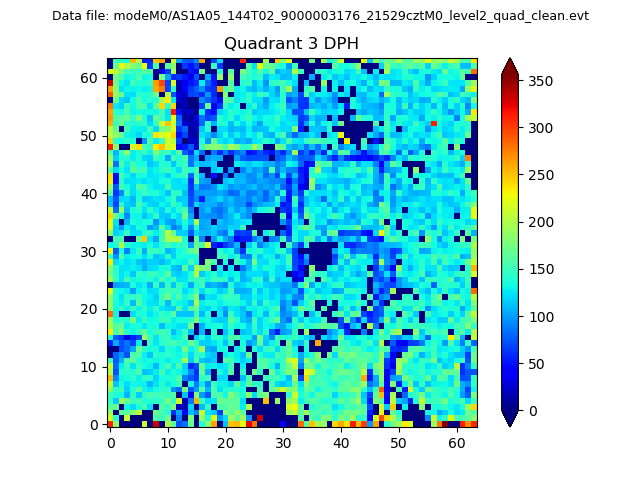 |
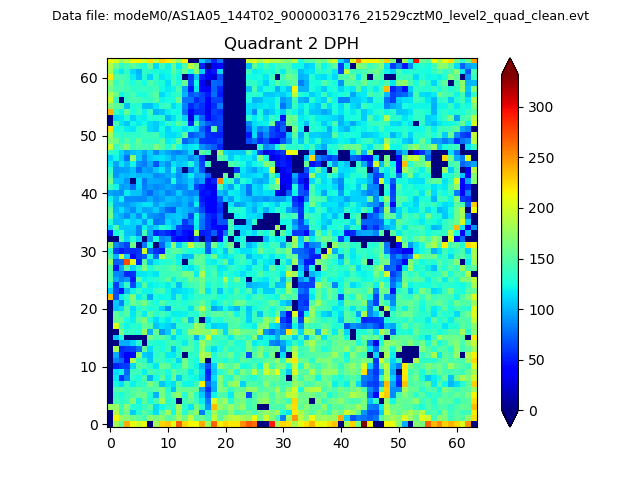 |
Quadrant C |
| Plot type | Count rate plots | Images |
|---|---|---|
| Comparison with Poisson distribution Blue bars denote a histogram of data divided into 1 sec bins. Red curve is a Poisson curve with rate = median count rate of data. |
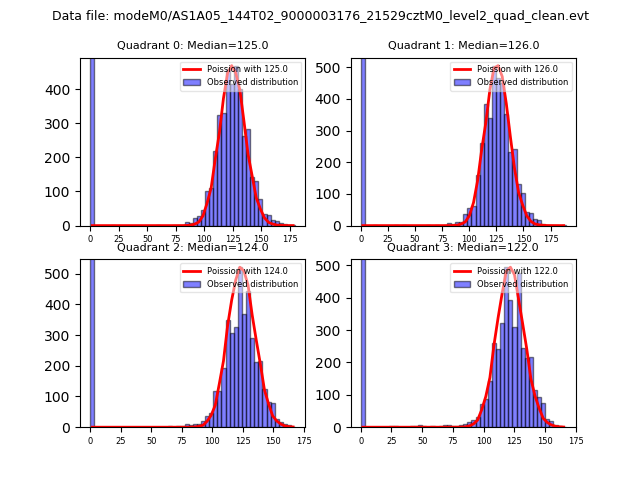 |
 |
| Quadrant-wise count rates Data is divided into 100 sec bins |
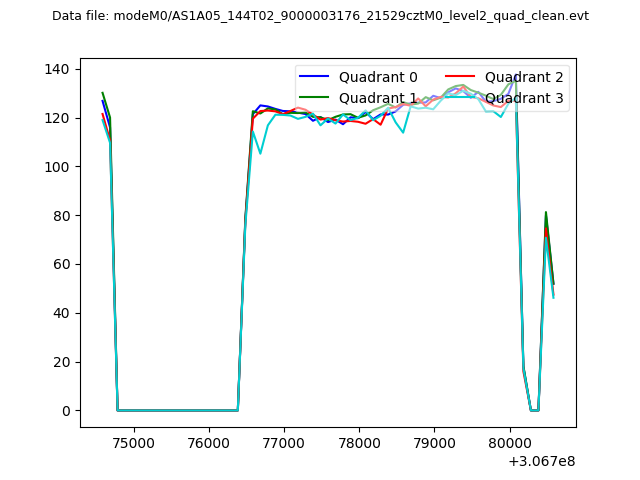 |
|
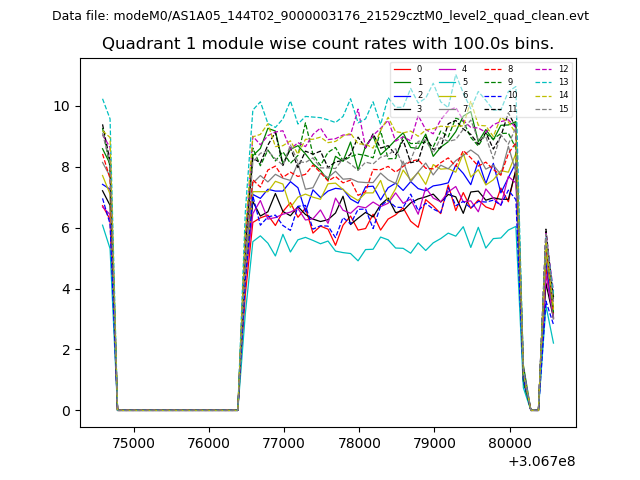
| Module-wise count rates for Quadrant A Data is divided into 100 sec bins |
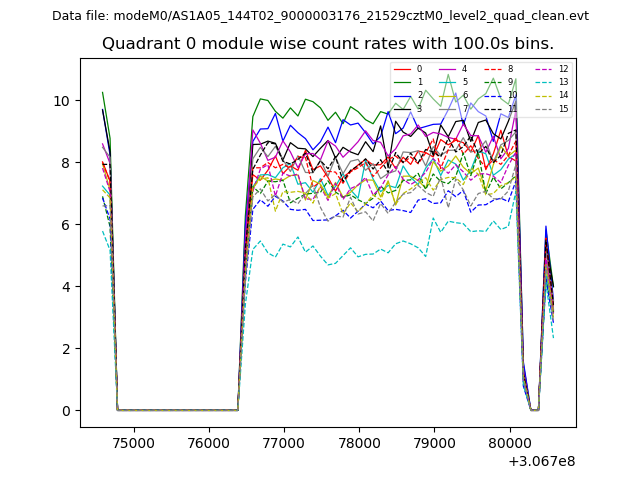 |
 |
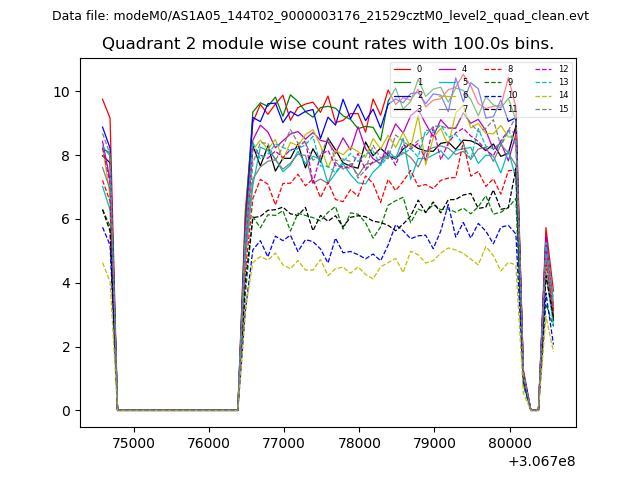
| Module-wise count rates for Quadrant B Data is divided into 100 sec bins |
 |
 |
| Module-wise count rates for Quadrant C Data is divided into 100 sec bins |
 |
 |
| Module-wise count rates for Quadrant D Data is divided into 100 sec bins |
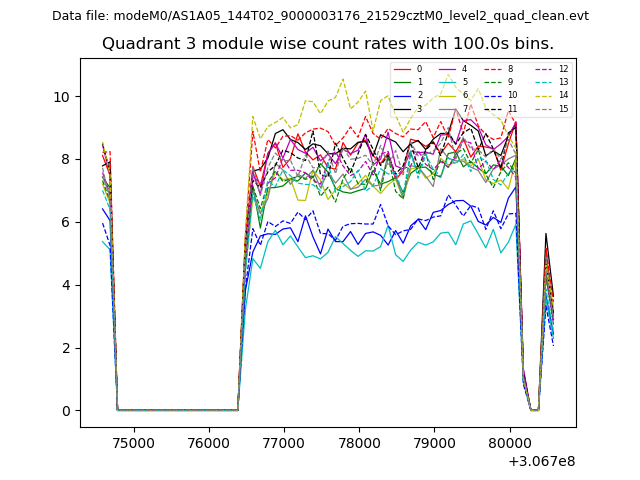 |
 |
| Parameter | Plot |
|---|---|
| CZT HV Monitor | 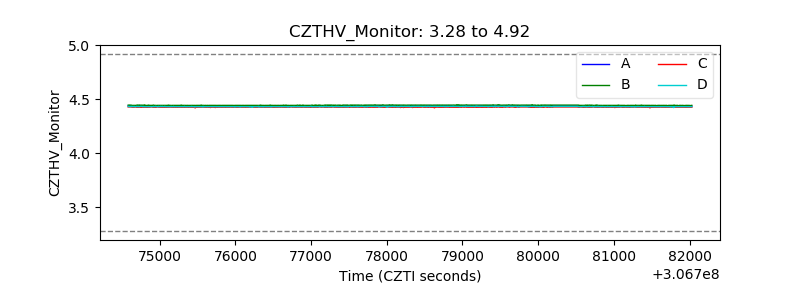 |
| D_VDD | 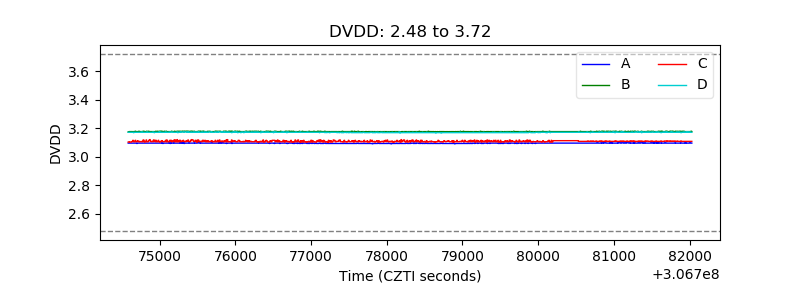 |
| Temperature 1 |  |
| Veto HV Monitor | 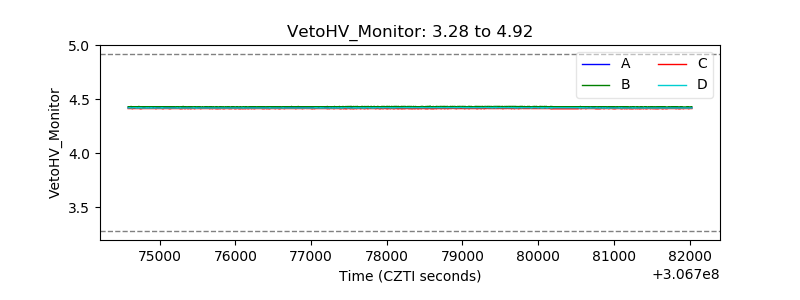 |
| Veto LLD | 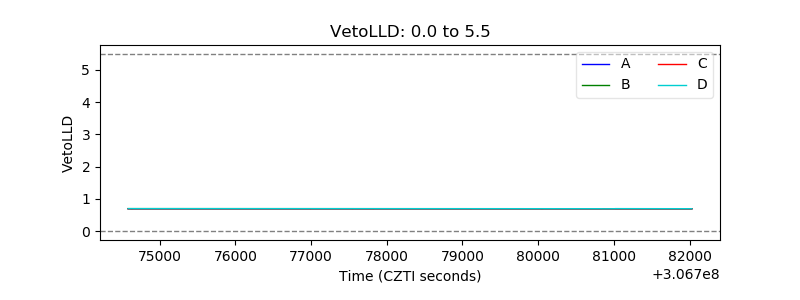 |
| Alpha Counter | 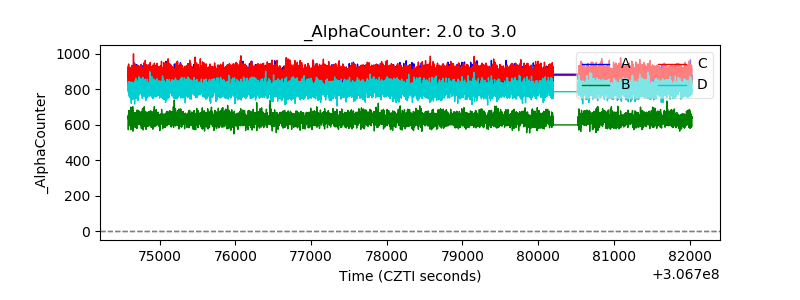 |
| _CPM_Rate | 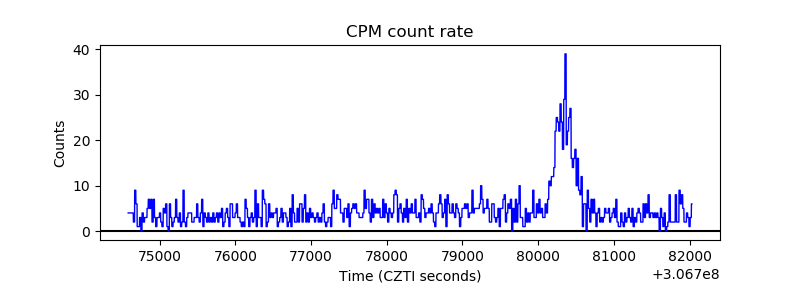 |
| CZT Counter |  |
| +2.5 Volts monitor |  |
| +5 Volts monitor |  |
| _ROLL_ROT | 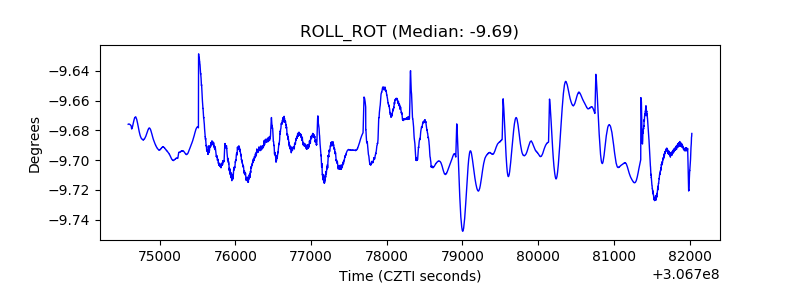 |
| _Roll_DEC |  |
| _Roll_RA | 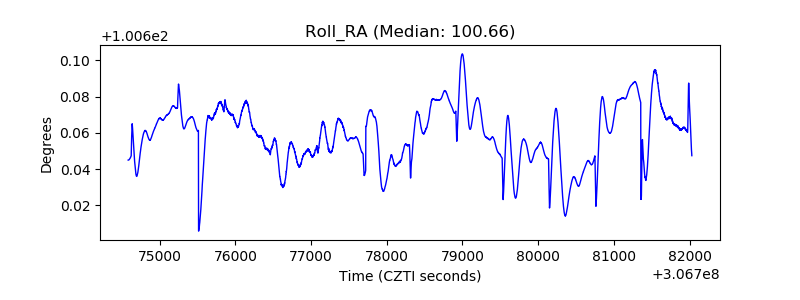 |
| Veto Counter | 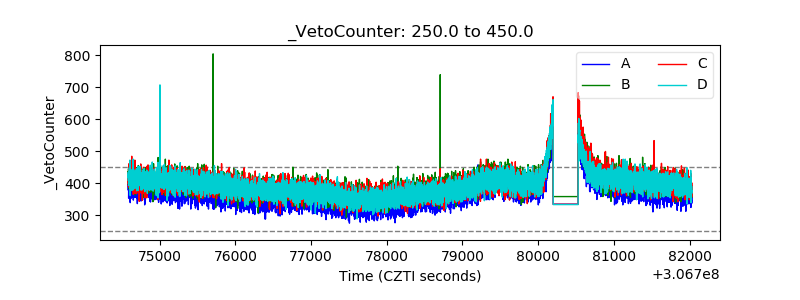 |