| Param | Original file | Final file |
|---|---|---|
| Filename | modeM0/AS1A05_144T02_9000003176_21532cztM0_level2.evt | modeM0/AS1A05_144T02_9000003176_21532cztM0_level2_quad_clean.evt |
| Size (bytes) | 1,543,242,240 | 254,373,120 |
| Size | 1.4 GB | 242.6 MB |
| Events in quadrant A | 8,394,807 | 1,634,391 |
| Events in quadrant B | 8,815,996 | 1,653,259 |
| Events in quadrant C | 10,142,124 | 1,621,189 |
| Events in quadrant D | 18,143,790 | 1,528,033 |
| Mode M9 | |||
|---|---|---|---|
| Quadrant | BADHDUFLAG | Total packets | Discarded packets |
| A | 0 | 20 | 0 |
| B | 0 | 20 | 0 |
| C | 0 | 20 | 0 |
| D | 0 | 20 | 0 |
| Mode M0 | |||
|---|---|---|---|
| Quadrant | BADHDUFLAG | Total packets | Discarded packets |
| A | 0 | 37353 | 5 |
| B | 0 | 38352 | 4 |
| C | 0 | 42153 | 4 |
| D | 0 | 66616 | 4 |
| Mode SS | |||
|---|---|---|---|
| Quadrant | BADHDUFLAG | Total packets | Discarded packets |
| A | 0 | 376 | 0 |
| B | 0 | 376 | 0 |
| C | 0 | 376 | 0 |
| D | 0 | 376 | 0 |
| Quadrant | Total seconds | Saturated seconds | Saturation percentage |
|---|---|---|---|
| A | 18380 | 93 | 0.505985% |
| B | 18381 | 124 | 0.674610% |
| C | 18381 | 584 | 3.177194% |
| D | 18381 | 2464 | 13.405147% |
Noise dominated data is calculated using 1-second bins in cleaned event files. If a bin has >2000 counts, and if more than 50% of those come from <1% of pixels, then it is considered to be noise-dominated and hence unusable.
| Quadrant | # 1 sec bins | Bins with >0 counts | Bins with >2000 counts | High rate bins dominated by noise | Noise dominated (total time) | Noise dominated (detector-on time) | Marked lightcurve |
|---|---|---|---|---|---|---|---|
| A | 20425 | 18383 | 0 | 0 | 0.00% | 0.00% | 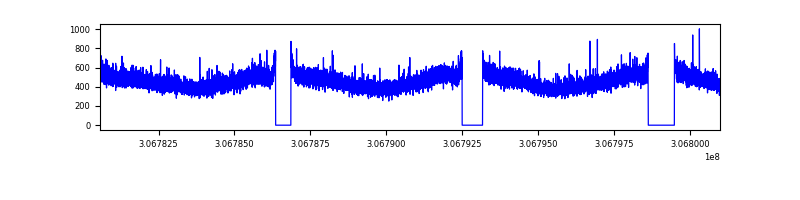 |
| B | 20426 | 18384 | 6 | 6 | 0.03% | 0.03% | 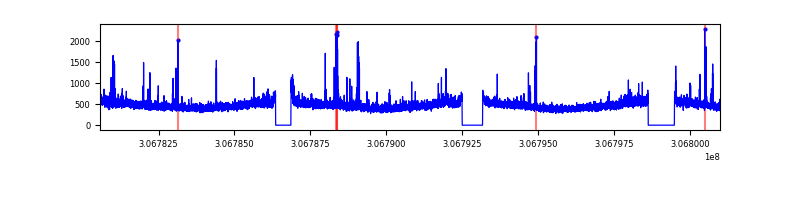 |
| C | 20426 | 18384 | 240 | 240 | 1.17% | 1.31% | 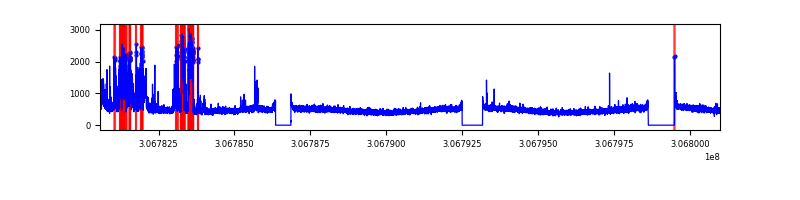 |
| D | 20426 | 18384 | 1619 | 1619 | 7.93% | 8.81% | 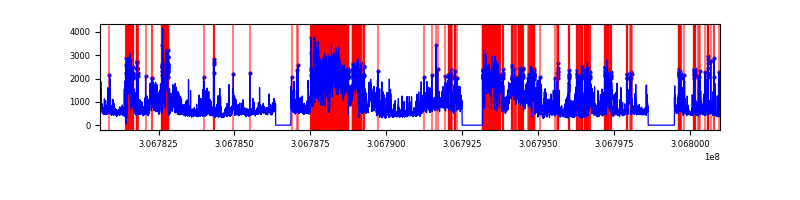 |
Top three noisy pixels from each quadrant. If the there are fewer than three noisy pixels in the level2.evt file, extra rows are filled as -1
| Pixel properties | Quadrant properties | ||||||
|---|---|---|---|---|---|---|---|
| Quadrant | DetID | PixID | Counts | Sigma | Mean | Median | Sigma |
| A | 13 | 254 | 29934 | 63.91 | 2174 | 2128 | 435.1 |
| A | 0 | 226 | 18772 | 38.26 | 2174 | 2128 | 435.1 |
| A | 3 | 137 | 18426 | 37.46 | 2174 | 2128 | 435.1 |
| B | 0 | 230 | 138872 | 335.91 | 2168 | 2110 | 407.1 |
| B | 0 | 190 | 78158 | 186.78 | 2168 | 2110 | 407.1 |
| B | 12 | 111 | 50367 | 118.52 | 2168 | 2110 | 407.1 |
| C | 3 | 233 | 1582464 | 3260.23 | 2086 | 2096 | 484.7 |
| C | 14 | 238 | 327352 | 670.99 | 2086 | 2096 | 484.7 |
| C | 10 | 91 | 96378 | 194.5 | 2086 | 2096 | 484.7 |
| D | 1 | 52 | 7195221 | 13620.42 | 1999 | 1960 | 528.1 |
| D | 7 | 38 | 2038403 | 3856.0 | 1999 | 1960 | 528.1 |
| D | 14 | 35 | 781111 | 1475.32 | 1999 | 1960 | 528.1 |
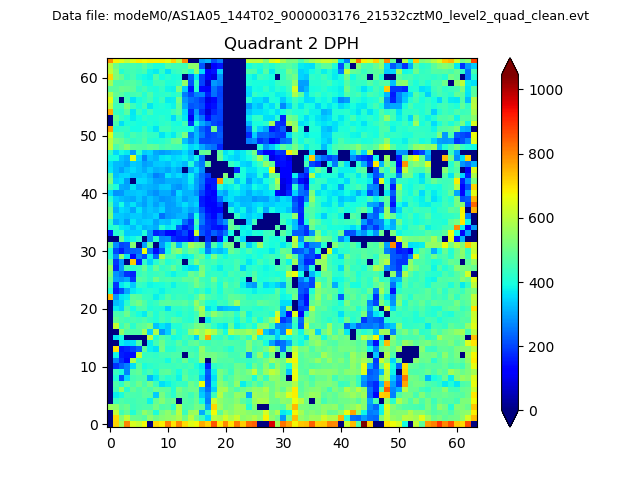
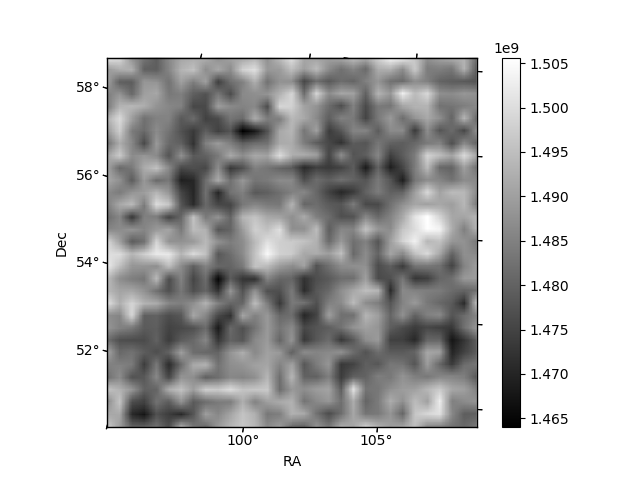
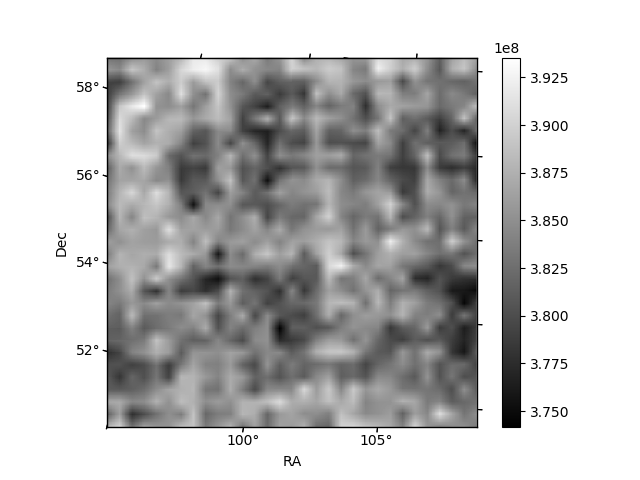
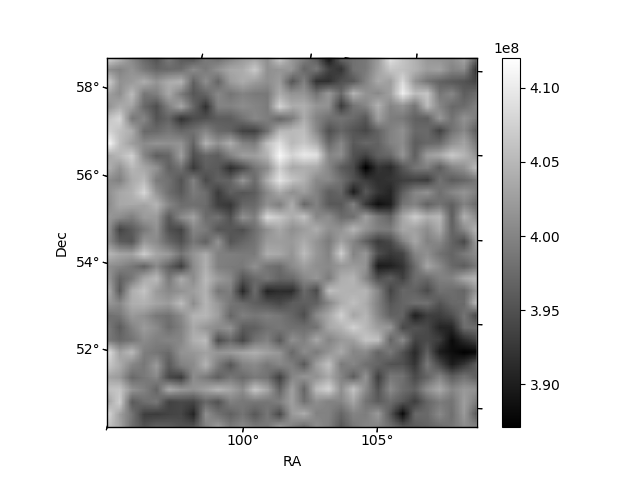
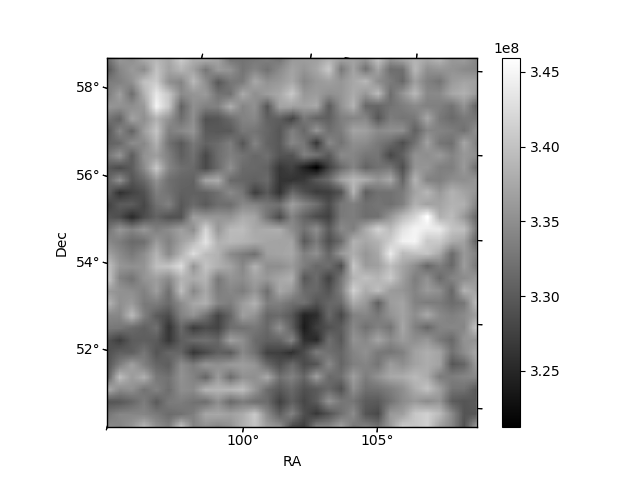
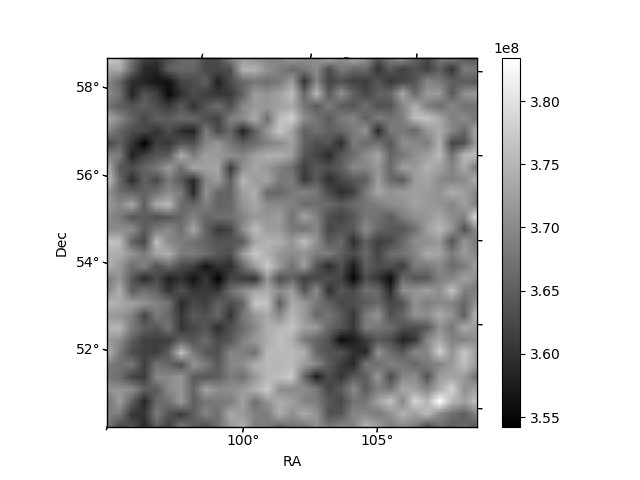
Histogram calculated using DETX and DETY for each event in the final _common_clean file
| Quadrant A | 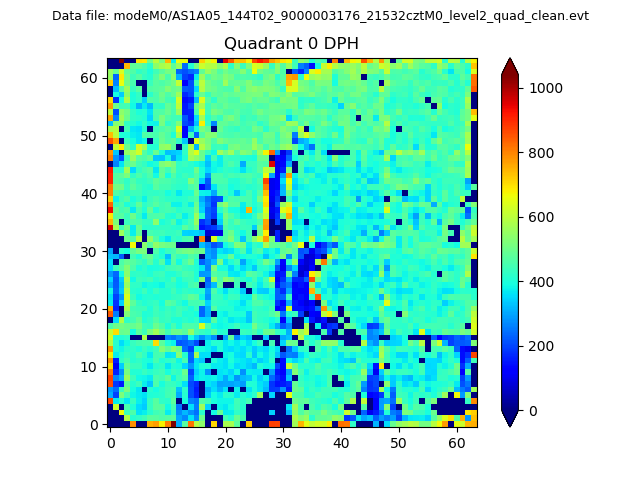 |
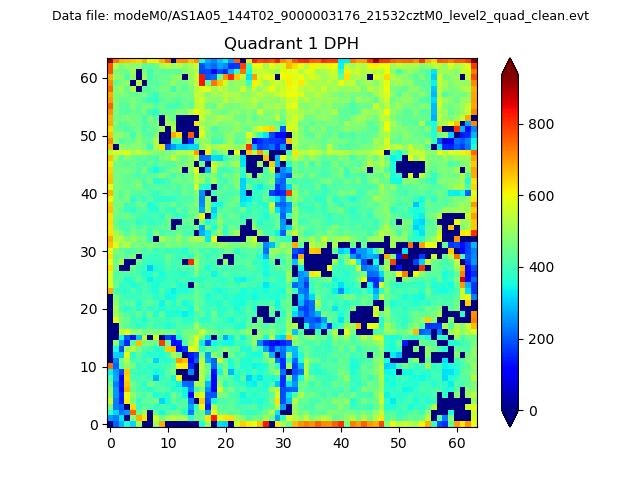 |
Quadrant B |
|---|---|---|---|
| Quadrant D | 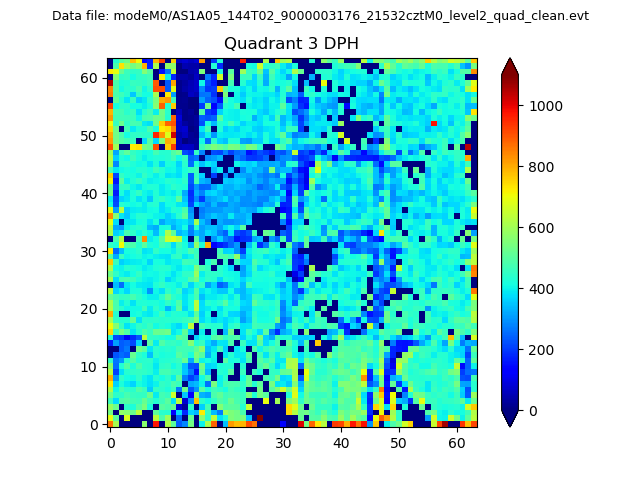 |
 |
Quadrant C |
| Plot type | Count rate plots | Images |
|---|---|---|
| Comparison with Poisson distribution Blue bars denote a histogram of data divided into 1 sec bins. Red curve is a Poisson curve with rate = median count rate of data. |
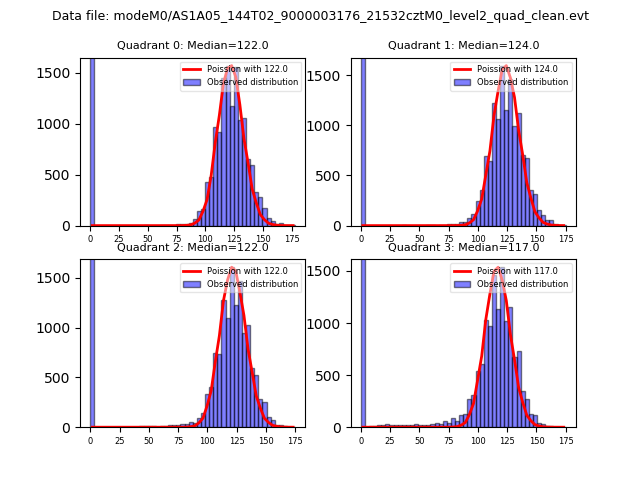 |
 |
| Quadrant-wise count rates Data is divided into 100 sec bins |
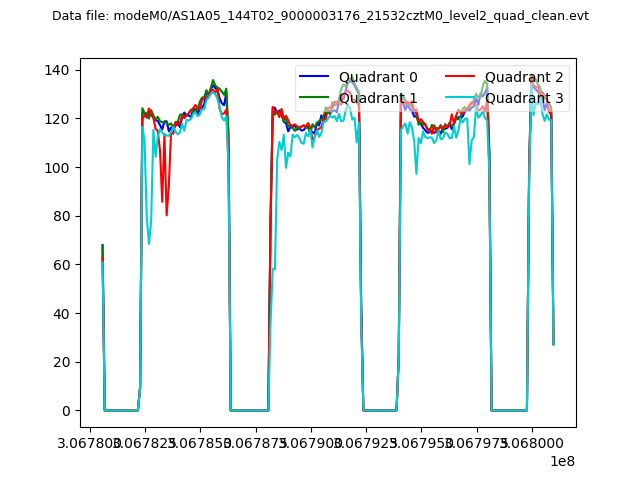 |
|
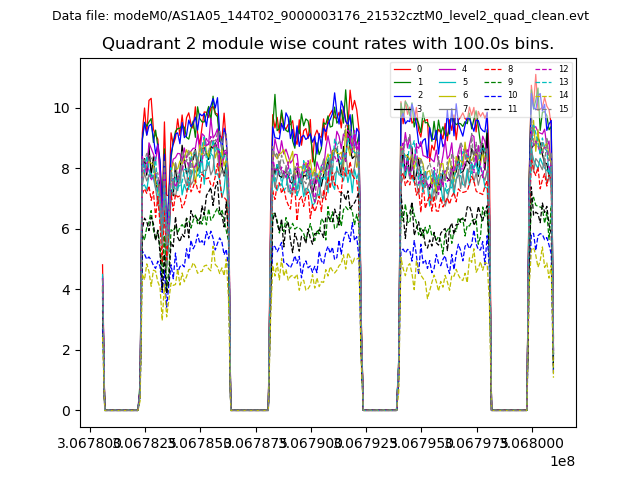
| Module-wise count rates for Quadrant A Data is divided into 100 sec bins |
 |
 |
| Module-wise count rates for Quadrant B Data is divided into 100 sec bins |
 |
 |
| Module-wise count rates for Quadrant C Data is divided into 100 sec bins |
 |
 |
| Module-wise count rates for Quadrant D Data is divided into 100 sec bins |
 |
 |
| Parameter | Plot |
|---|---|
| CZT HV Monitor |  |
| D_VDD | 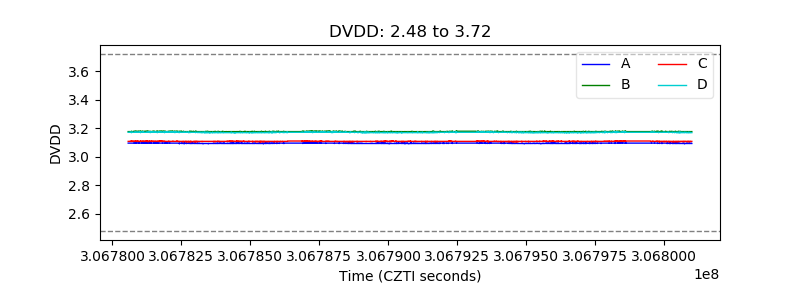 |
| Temperature 1 | 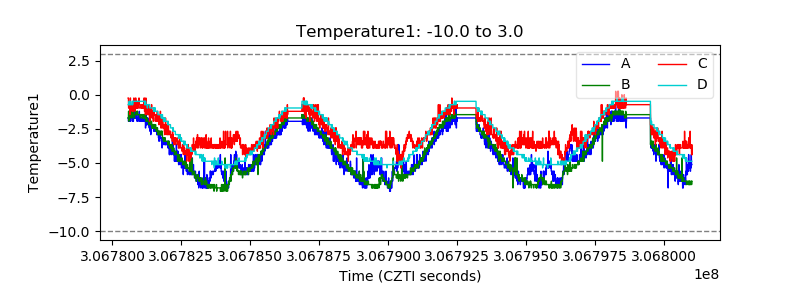 |
| Veto HV Monitor | 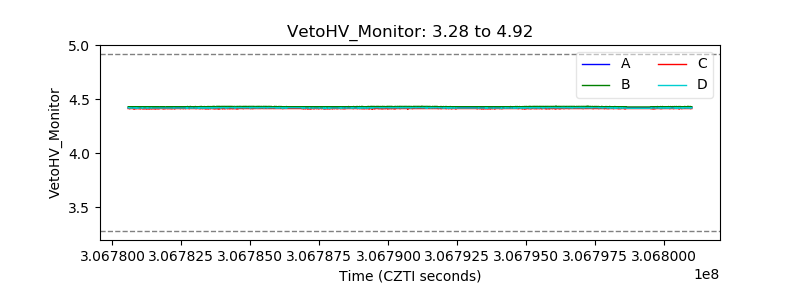 |
| Veto LLD |  |
| Alpha Counter | 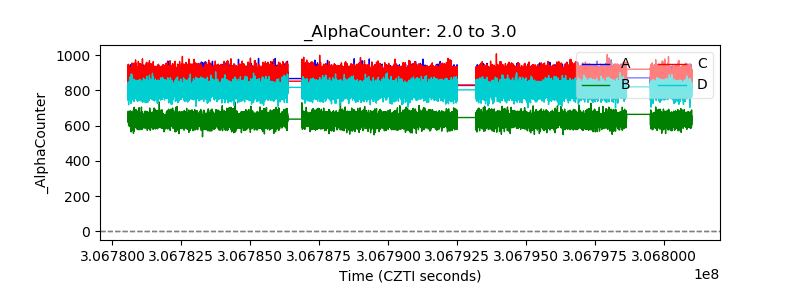 |
| _CPM_Rate | 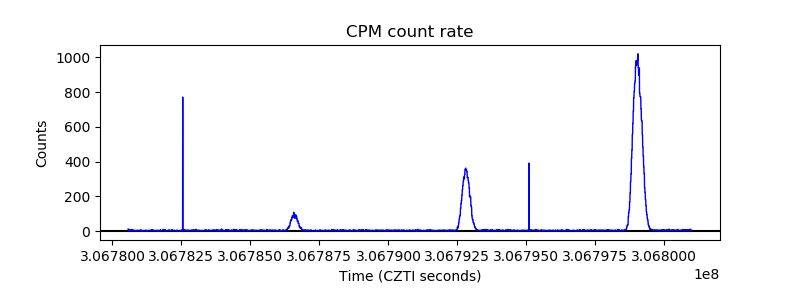 |
| CZT Counter | 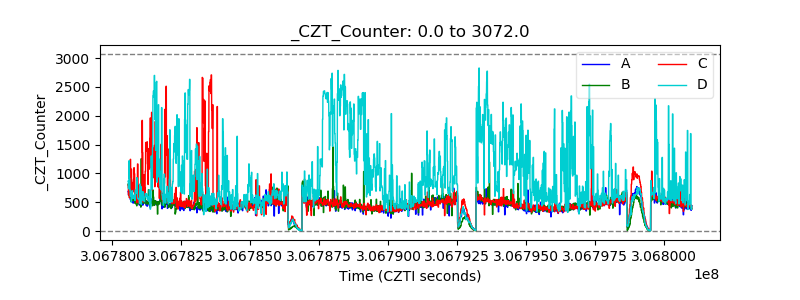 |
| +2.5 Volts monitor |  |
| +5 Volts monitor |  |
| _ROLL_ROT | 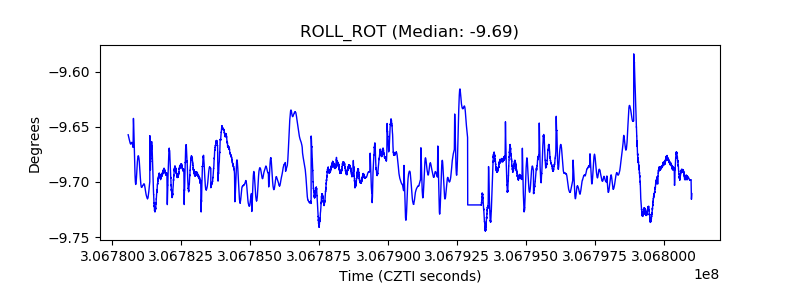 |
| _Roll_DEC | 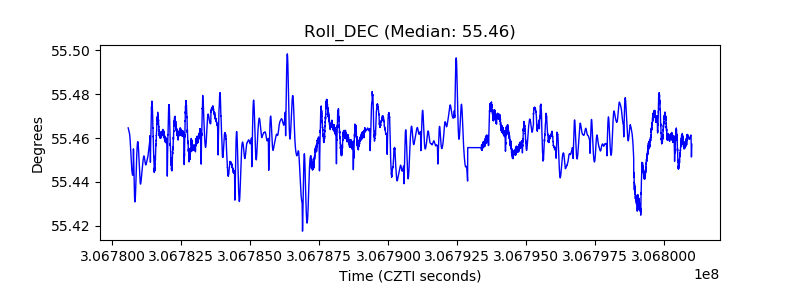 |
| _Roll_RA | 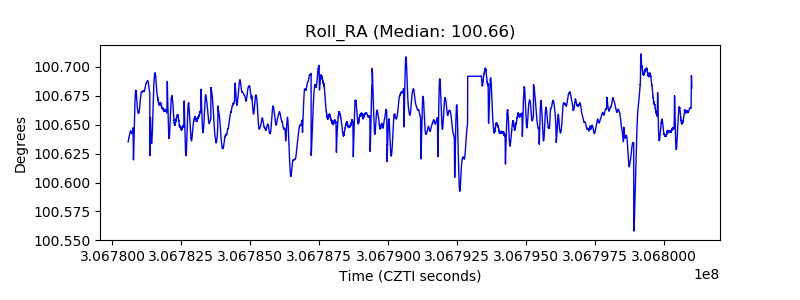 |
| Veto Counter | 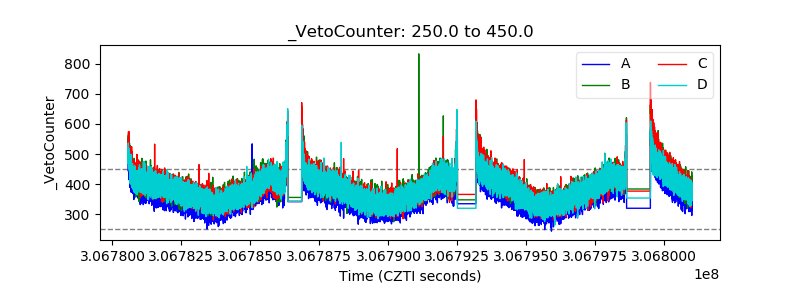 |