| Param | Original file | Final file |
|---|---|---|
| Filename | modeM0/AS1A05_144T02_9000003176_21533cztM0_level2.evt | modeM0/AS1A05_144T02_9000003176_21533cztM0_level2_quad_clean.evt |
| Size (bytes) | 496,975,680 | 105,589,440 |
| Size | 474.0 MB | 100.7 MB |
| Events in quadrant A | 3,110,580 | 685,044 |
| Events in quadrant B | 3,289,828 | 699,952 |
| Events in quadrant C | 3,215,402 | 691,009 |
| Events in quadrant D | 4,980,293 | 654,654 |
| Mode M9 | |||
|---|---|---|---|
| Quadrant | BADHDUFLAG | Total packets | Discarded packets |
| A | 0 | 20 | 0 |
| B | 0 | 20 | 0 |
| C | 0 | 20 | 0 |
| D | 0 | 20 | 0 |
| Mode M0 | |||
|---|---|---|---|
| Quadrant | BADHDUFLAG | Total packets | Discarded packets |
| A | 0 | 13770 | 3 |
| B | 0 | 14249 | 2 |
| C | 0 | 14016 | 2 |
| D | 0 | 19548 | 2 |
| Mode SS | |||
|---|---|---|---|
| Quadrant | BADHDUFLAG | Total packets | Discarded packets |
| A | 0 | 136 | 0 |
| B | 0 | 136 | 0 |
| C | 0 | 136 | 0 |
| D | 0 | 136 | 0 |
| Quadrant | Total seconds | Saturated seconds | Saturation percentage |
|---|---|---|---|
| A | 6707 | 27 | 0.402564% |
| B | 6708 | 43 | 0.641026% |
| C | 6708 | 82 | 1.222421% |
| D | 6708 | 279 | 4.159213% |
Noise dominated data is calculated using 1-second bins in cleaned event files. If a bin has >2000 counts, and if more than 50% of those come from <1% of pixels, then it is considered to be noise-dominated and hence unusable.
| Quadrant | # 1 sec bins | Bins with >0 counts | Bins with >2000 counts | High rate bins dominated by noise | Noise dominated (total time) | Noise dominated (detector-on time) | Marked lightcurve |
|---|---|---|---|---|---|---|---|
| A | 8607 | 6709 | 0 | 0 | 0.00% | 0.00% | 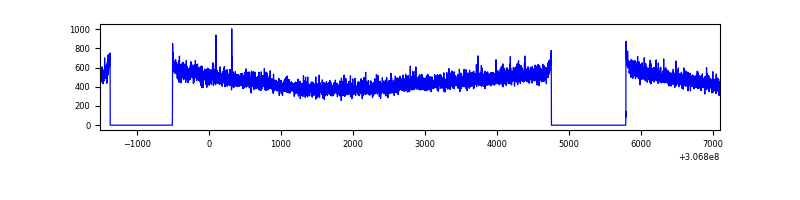 |
| B | 8608 | 6710 | 8 | 8 | 0.09% | 0.12% | 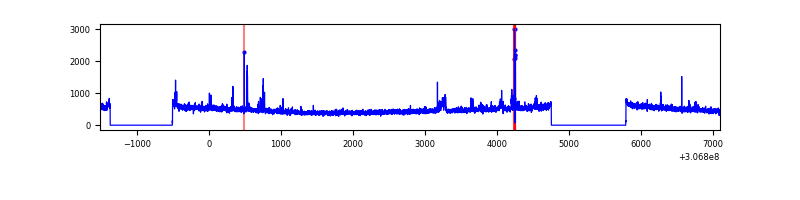 |
| C | 8608 | 6710 | 2 | 2 | 0.02% | 0.03% | 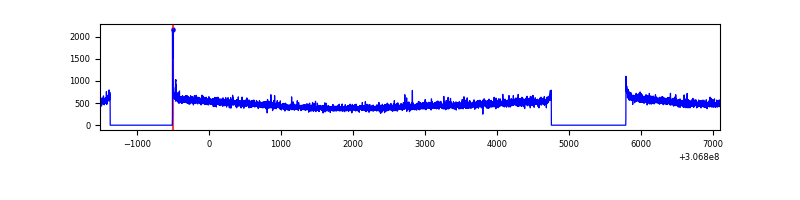 |
| D | 8608 | 6710 | 172 | 172 | 2.00% | 2.56% | 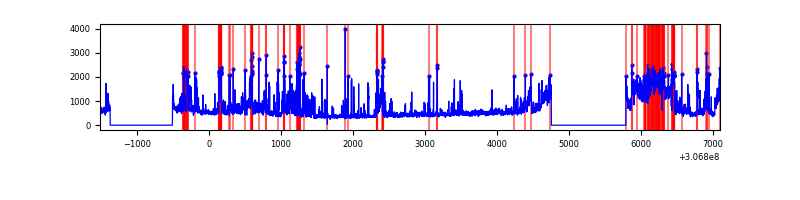 |
Top three noisy pixels from each quadrant. If the there are fewer than three noisy pixels in the level2.evt file, extra rows are filled as -1
| Pixel properties | Quadrant properties | ||||||
|---|---|---|---|---|---|---|---|
| Quadrant | DetID | PixID | Counts | Sigma | Mean | Median | Sigma |
| A | 13 | 254 | 10244 | 58.43 | 806 | 788 | 161.8 |
| A | 3 | 137 | 6935 | 37.98 | 806 | 788 | 161.8 |
| A | 0 | 226 | 6829 | 37.33 | 806 | 788 | 161.8 |
| B | 0 | 230 | 58288 | 373.92 | 807 | 786 | 153.8 |
| B | 0 | 229 | 37135 | 236.37 | 807 | 786 | 153.8 |
| B | 0 | 190 | 22832 | 143.36 | 807 | 786 | 153.8 |
| C | 14 | 238 | 124381 | 676.2 | 783 | 787 | 182.8 |
| C | 3 | 233 | 29314 | 156.08 | 783 | 787 | 182.8 |
| C | 4 | 175 | 7968 | 39.29 | 783 | 787 | 182.8 |
| D | 1 | 52 | 1316287 | 7009.37 | 780 | 758 | 187.7 |
| D | 7 | 223 | 276726 | 1470.41 | 780 | 758 | 187.7 |
| D | 14 | 35 | 229878 | 1220.79 | 780 | 758 | 187.7 |
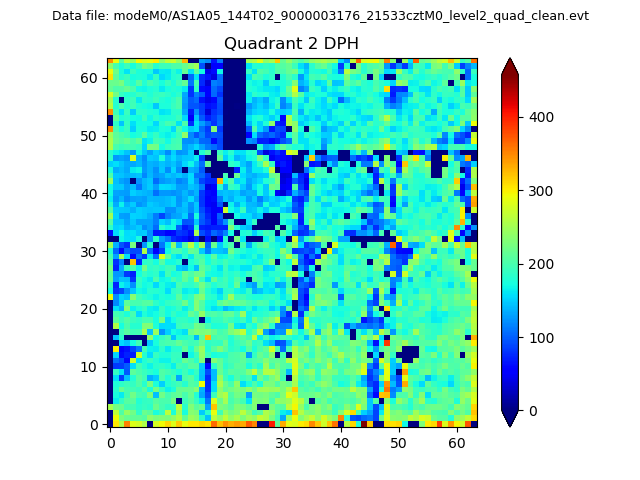
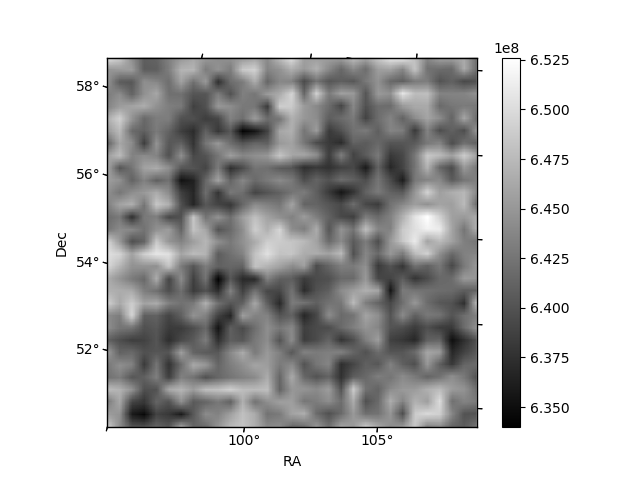
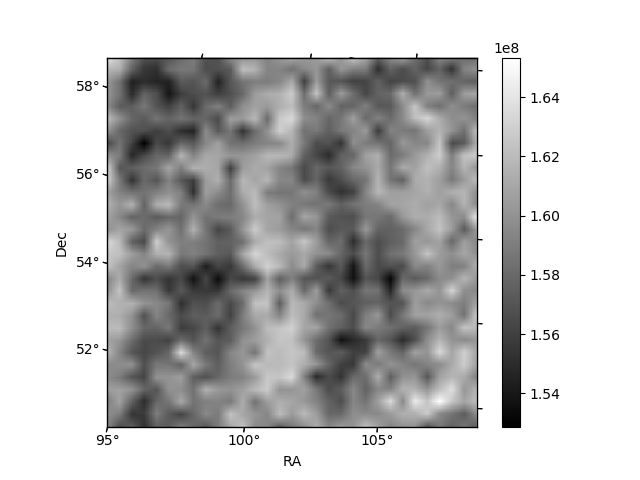
Histogram calculated using DETX and DETY for each event in the final _common_clean file
| Quadrant A | 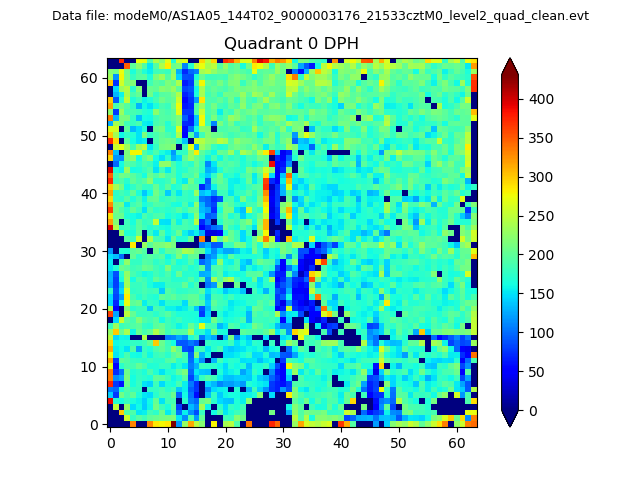 |
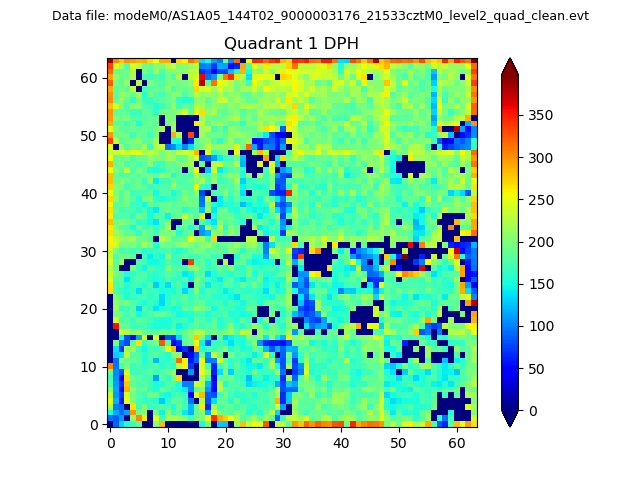 |
Quadrant B |
|---|---|---|---|
| Quadrant D | 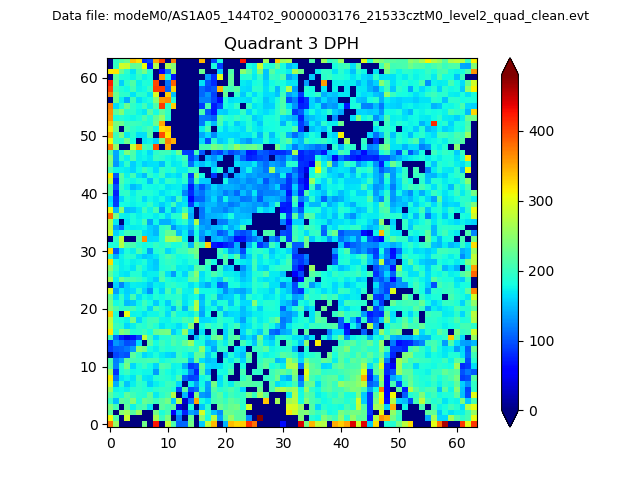 |
 |
Quadrant C |
| Plot type | Count rate plots | Images |
|---|---|---|
| Comparison with Poisson distribution Blue bars denote a histogram of data divided into 1 sec bins. Red curve is a Poisson curve with rate = median count rate of data. |
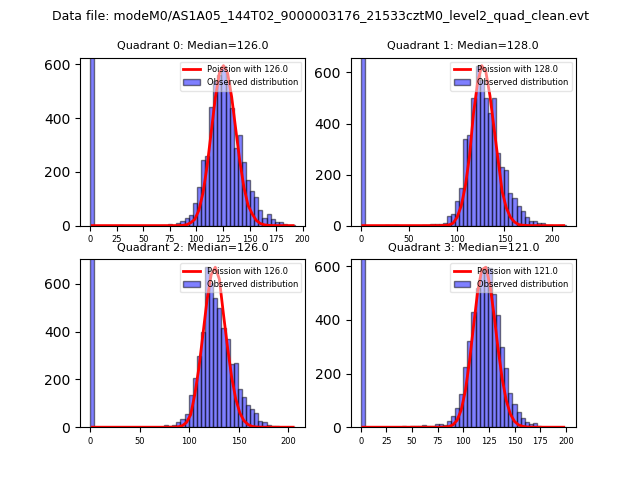 |
 |
| Quadrant-wise count rates Data is divided into 100 sec bins |
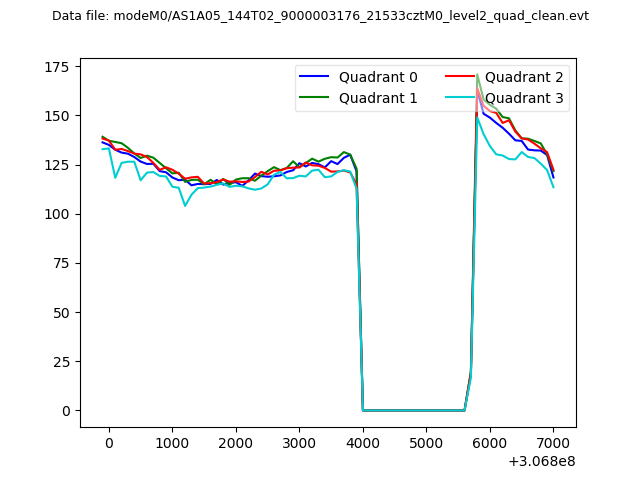 |
|
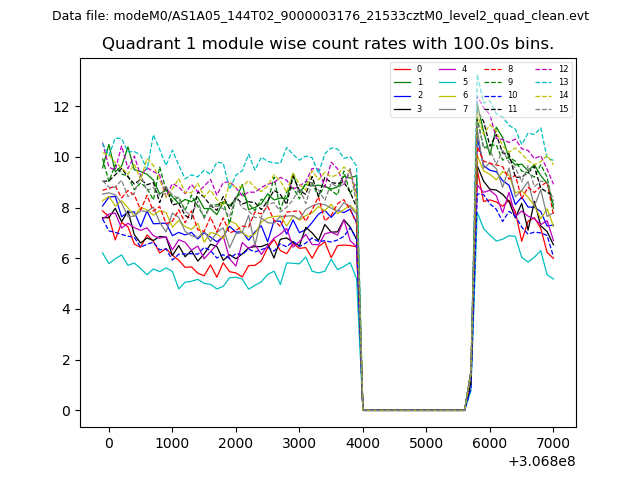
| Module-wise count rates for Quadrant A Data is divided into 100 sec bins |
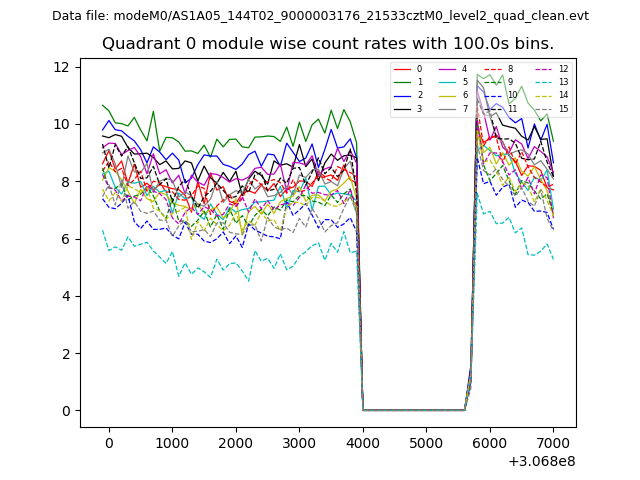 |
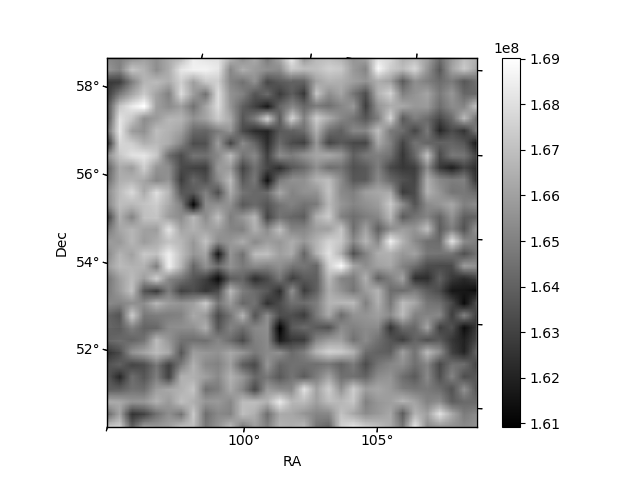 |
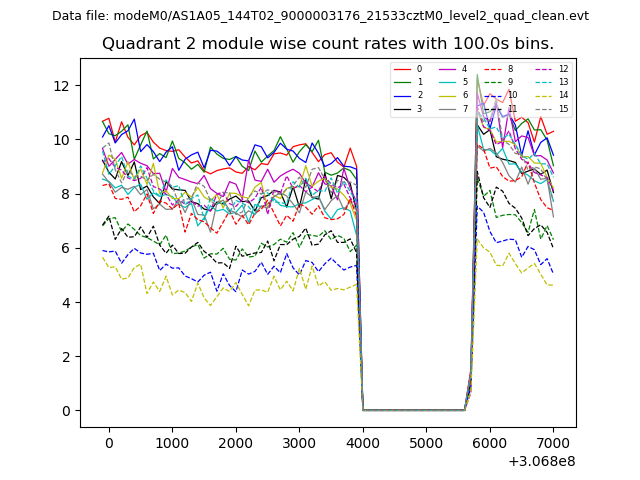
| Module-wise count rates for Quadrant B Data is divided into 100 sec bins |
 |
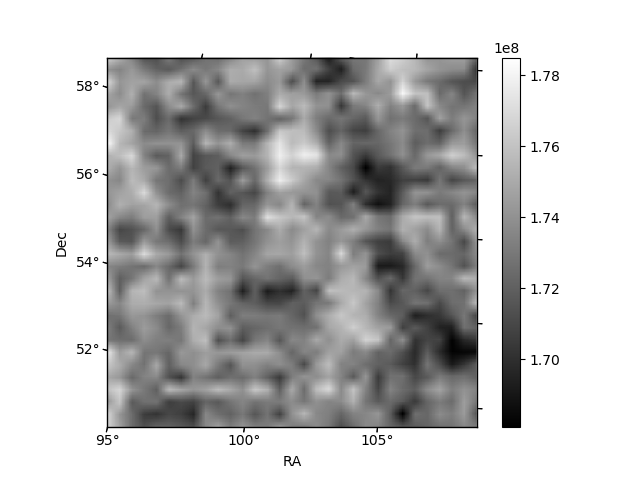 |
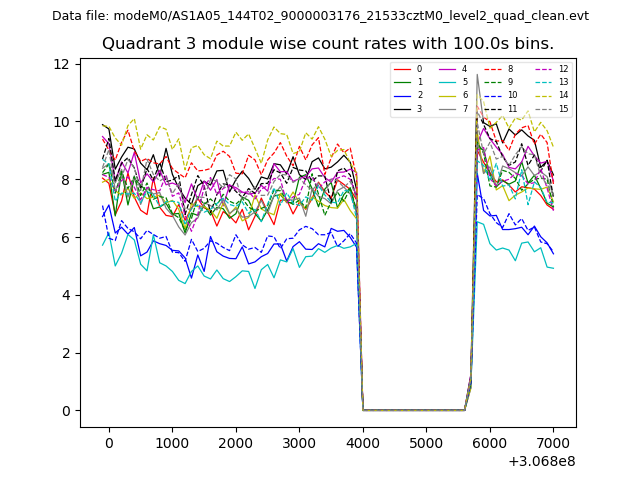
| Module-wise count rates for Quadrant C Data is divided into 100 sec bins |
 |
 |
| Module-wise count rates for Quadrant D Data is divided into 100 sec bins |
 |
 |
| Parameter | Plot |
|---|---|
| CZT HV Monitor | 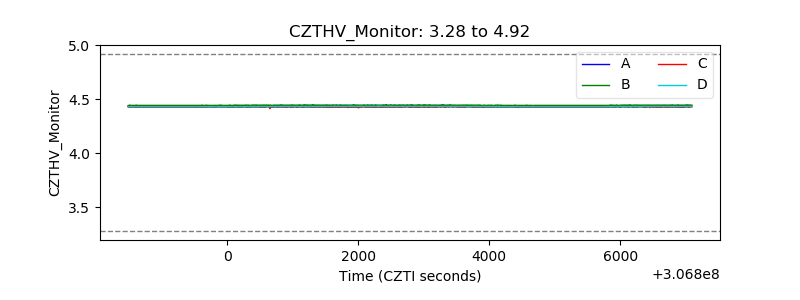 |
| D_VDD | 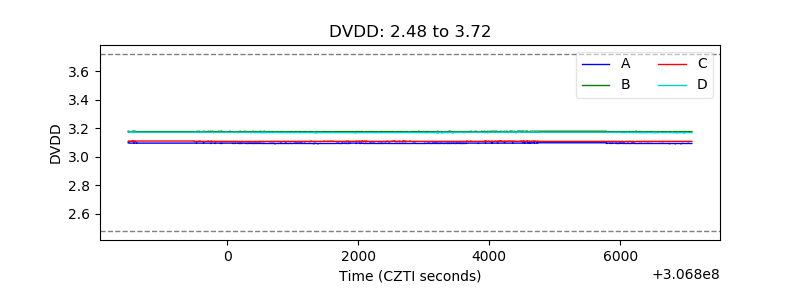 |
| Temperature 1 |  |
| Veto HV Monitor | 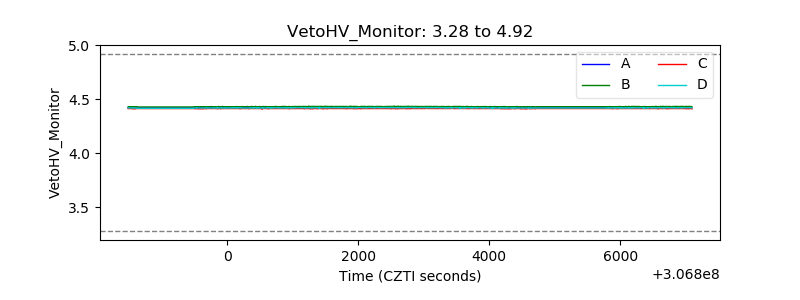 |
| Veto LLD | 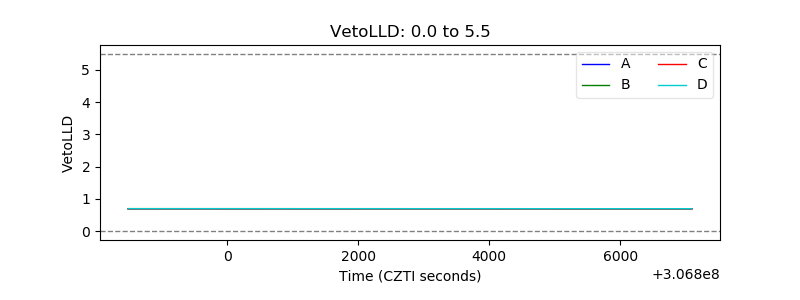 |
| Alpha Counter | 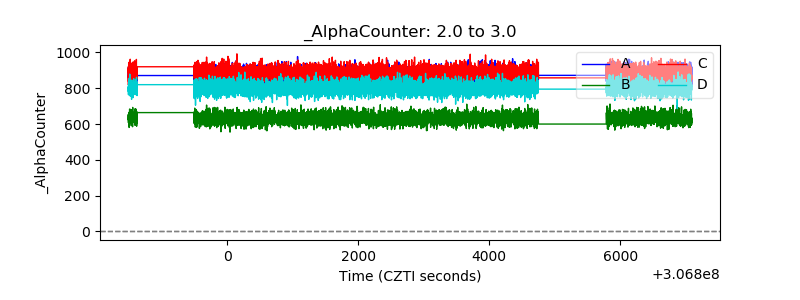 |
| _CPM_Rate | 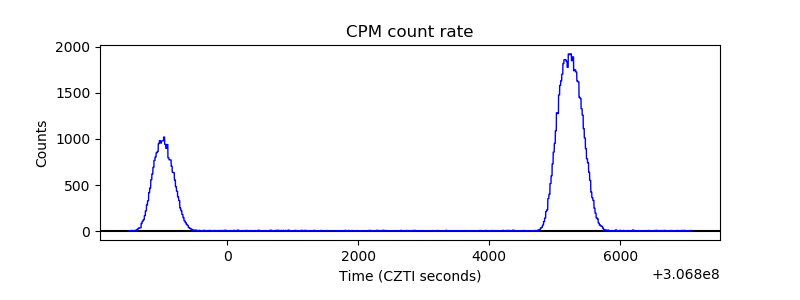 |
| CZT Counter | 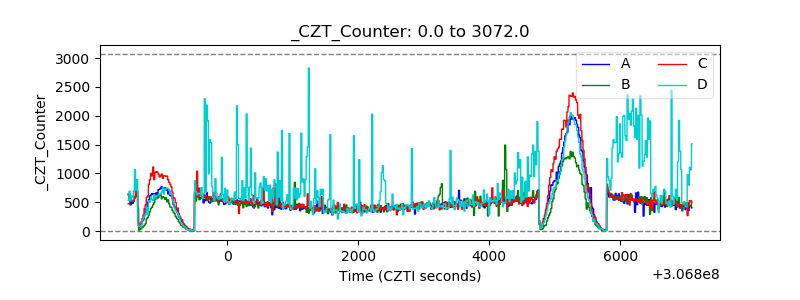 |
| +2.5 Volts monitor |  |
| +5 Volts monitor |  |
| _ROLL_ROT | 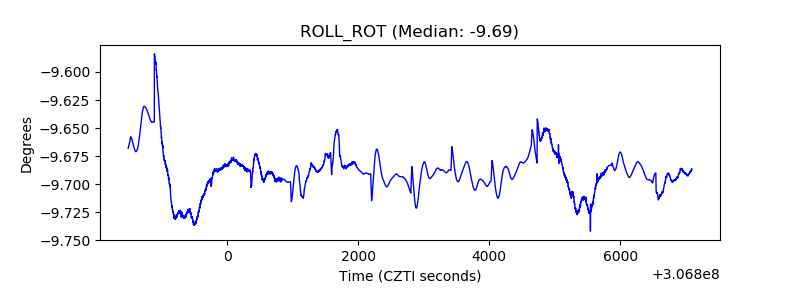 |
| _Roll_DEC | 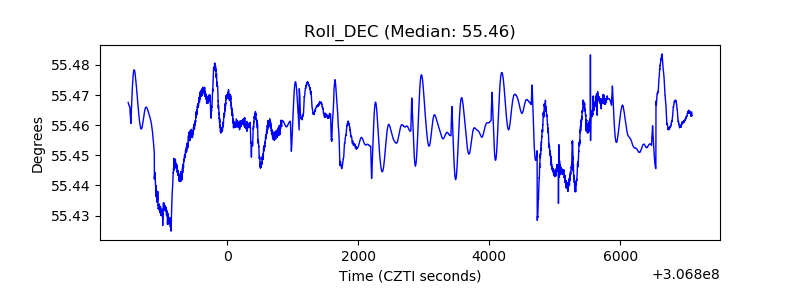 |
| _Roll_RA | 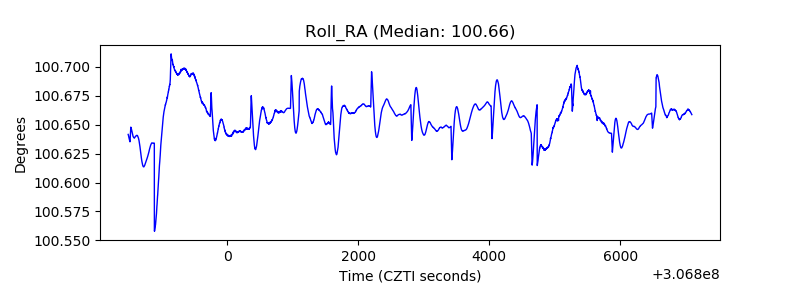 |
| Veto Counter |  |