| Param | Original file | Final file |
|---|---|---|
| Filename | modeM0/AS1A05_144T02_9000003176_21535cztM0_level2.evt | modeM0/AS1A05_144T02_9000003176_21535cztM0_level2_quad_clean.evt |
| Size (bytes) | 290,957,760 | 77,238,720 |
| Size | 277.5 MB | 73.7 MB |
| Events in quadrant A | 1,778,298 | 515,211 |
| Events in quadrant B | 1,861,719 | 528,979 |
| Events in quadrant C | 1,951,896 | 519,397 |
| Events in quadrant D | 2,945,451 | 492,031 |
| Mode M9 | |||
|---|---|---|---|
| Quadrant | BADHDUFLAG | Total packets | Discarded packets |
| A | 0 | 9 | 0 |
| B | 0 | 10 | 0 |
| C | 0 | 10 | 0 |
| D | 0 | 10 | 0 |
| Mode M0 | |||
|---|---|---|---|
| Quadrant | BADHDUFLAG | Total packets | Discarded packets |
| A | 0 | 8185 | 1 |
| B | 0 | 8339 | 1 |
| C | 0 | 8599 | 1 |
| D | 0 | 11715 | 1 |
| Mode SS | |||
|---|---|---|---|
| Quadrant | BADHDUFLAG | Total packets | Discarded packets |
| A | 0 | 80 | 0 |
| B | 0 | 80 | 0 |
| C | 0 | 80 | 0 |
| D | 0 | 80 | 0 |
| Quadrant | Total seconds | Saturated seconds | Saturation percentage |
|---|---|---|---|
| A | 4020 | 1 | 0.024876% |
| B | 4020 | 6 | 0.149254% |
| C | 4020 | 18 | 0.447761% |
| D | 4020 | 107 | 2.661692% |
Noise dominated data is calculated using 1-second bins in cleaned event files. If a bin has >2000 counts, and if more than 50% of those come from <1% of pixels, then it is considered to be noise-dominated and hence unusable.
| Quadrant | # 1 sec bins | Bins with >0 counts | Bins with >2000 counts | High rate bins dominated by noise | Noise dominated (total time) | Noise dominated (detector-on time) | Marked lightcurve |
|---|---|---|---|---|---|---|---|
| A | 4020 | 4020 | 0 | 0 | 0.00% | 0.00% | 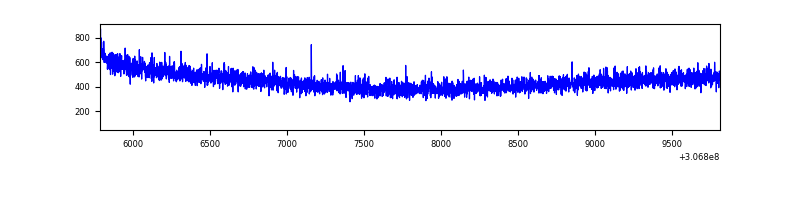 |
| B | 4020 | 4020 | 0 | 0 | 0.00% | 0.00% | 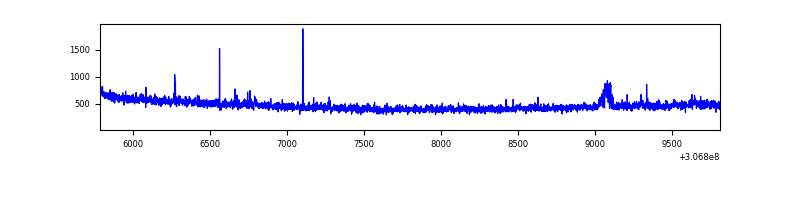 |
| C | 4020 | 4020 | 0 | 0 | 0.00% | 0.00% | 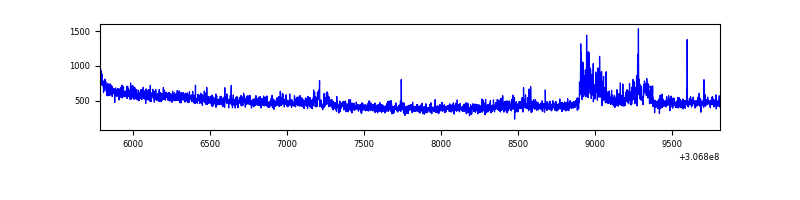 |
| D | 4020 | 4020 | 86 | 86 | 2.14% | 2.14% | 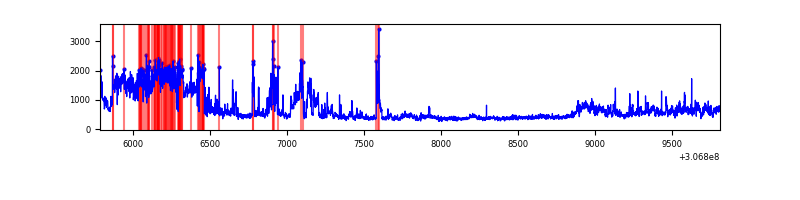 |
Top three noisy pixels from each quadrant. If the there are fewer than three noisy pixels in the level2.evt file, extra rows are filled as -1
| Pixel properties | Quadrant properties | ||||||
|---|---|---|---|---|---|---|---|
| Quadrant | DetID | PixID | Counts | Sigma | Mean | Median | Sigma |
| A | 13 | 254 | 5496 | 54.63 | 461 | 452 | 92.3 |
| A | 0 | 226 | 3877 | 37.09 | 461 | 452 | 92.3 |
| A | 3 | 137 | 3772 | 35.96 | 461 | 452 | 92.3 |
| B | 0 | 230 | 26293 | 291.52 | 464 | 451 | 88.6 |
| B | 12 | 111 | 10414 | 112.39 | 464 | 451 | 88.6 |
| B | 11 | 111 | 9136 | 97.97 | 464 | 451 | 88.6 |
| C | 3 | 233 | 130230 | 1246.52 | 448 | 452 | 104.1 |
| C | 14 | 238 | 70702 | 674.75 | 448 | 452 | 104.1 |
| C | 13 | 61 | 3102 | 25.45 | 448 | 452 | 104.1 |
| D | 1 | 52 | 1026470 | 9497.86 | 444 | 430 | 108.0 |
| D | 14 | 35 | 131454 | 1212.86 | 444 | 430 | 108.0 |
| D | 7 | 38 | 35861 | 327.98 | 444 | 430 | 108.0 |
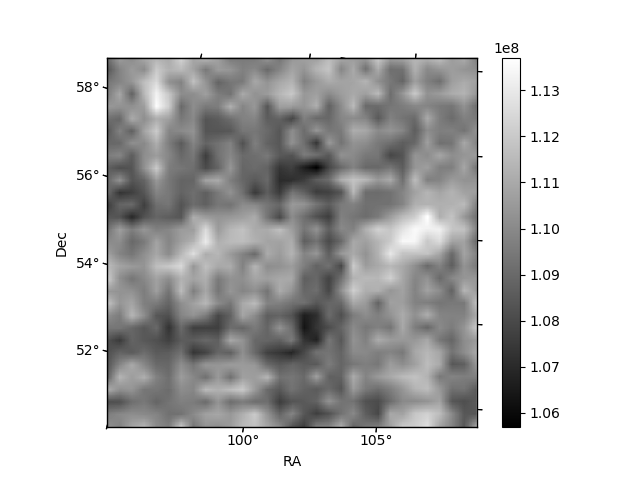
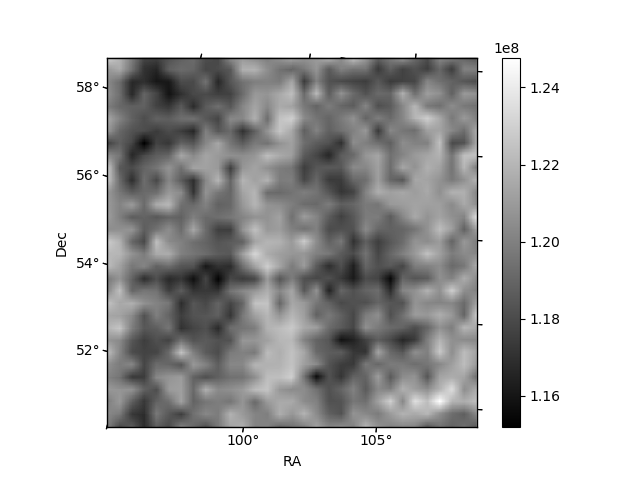
Histogram calculated using DETX and DETY for each event in the final _common_clean file
| Quadrant A | 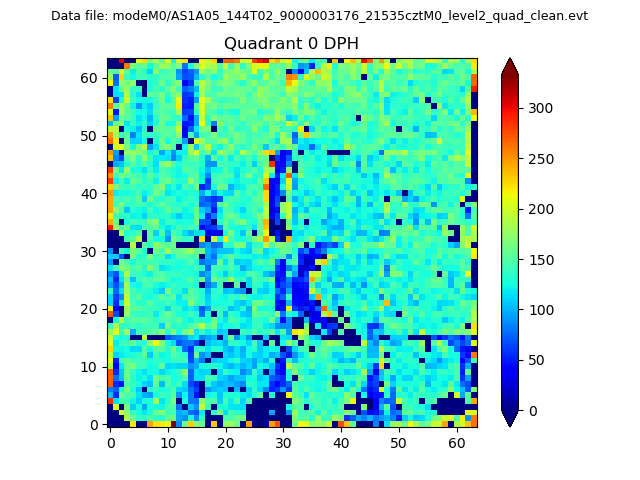 |
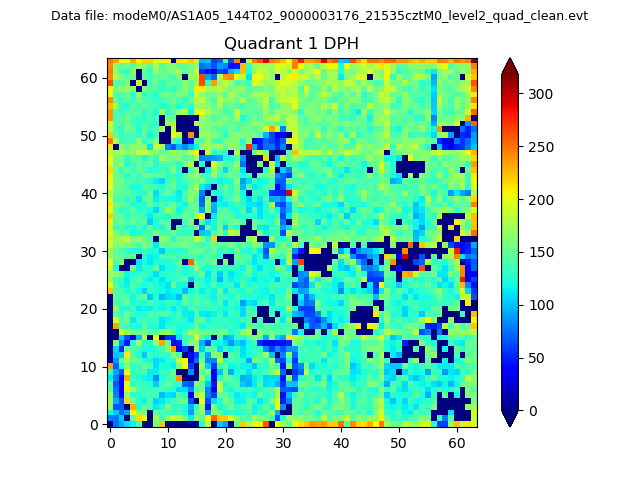 |
Quadrant B |
|---|---|---|---|
| Quadrant D | 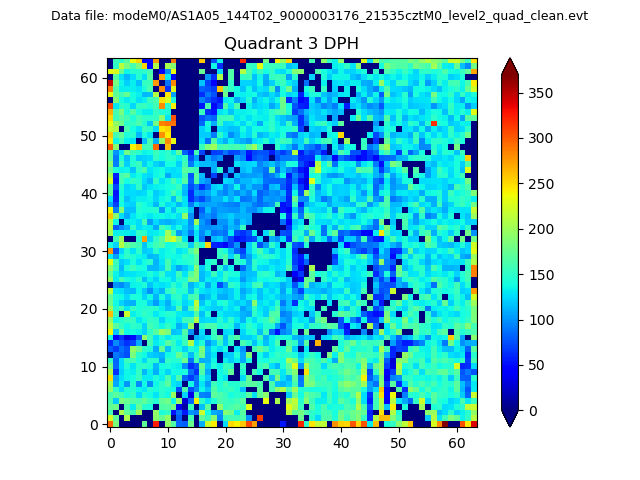 |
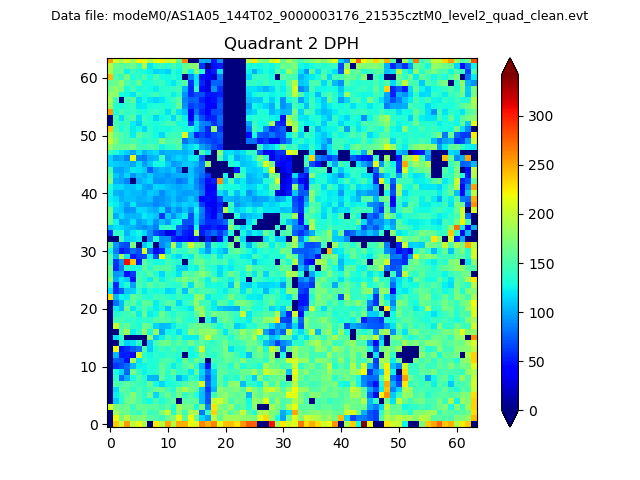 |
Quadrant C |
| Plot type | Count rate plots | Images |
|---|---|---|
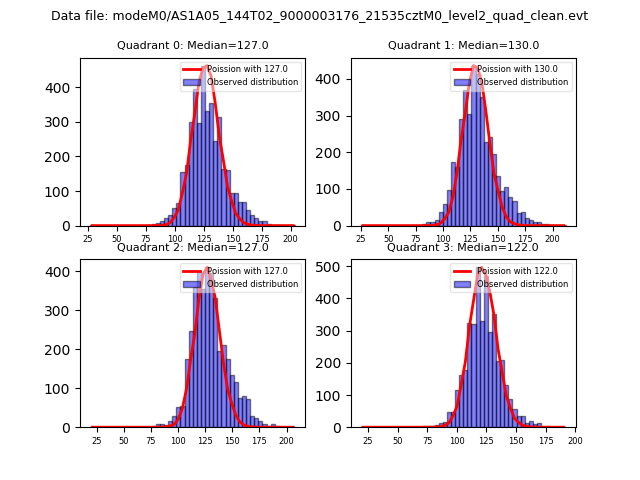
| Comparison with Poisson distribution Blue bars denote a histogram of data divided into 1 sec bins. Red curve is a Poisson curve with rate = median count rate of data. |
 |
 |
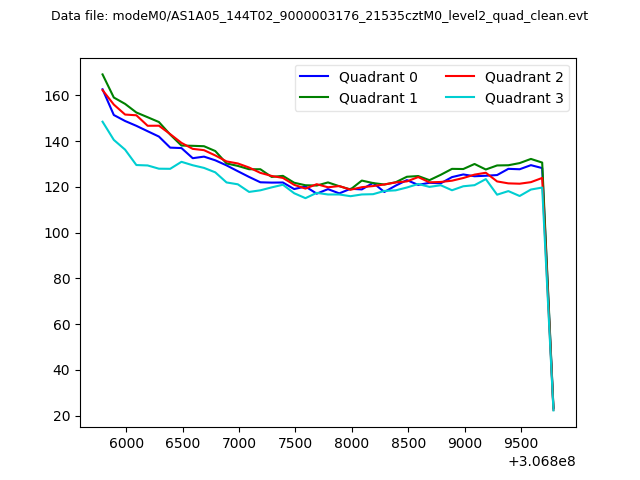
| Quadrant-wise count rates Data is divided into 100 sec bins |
 |
|
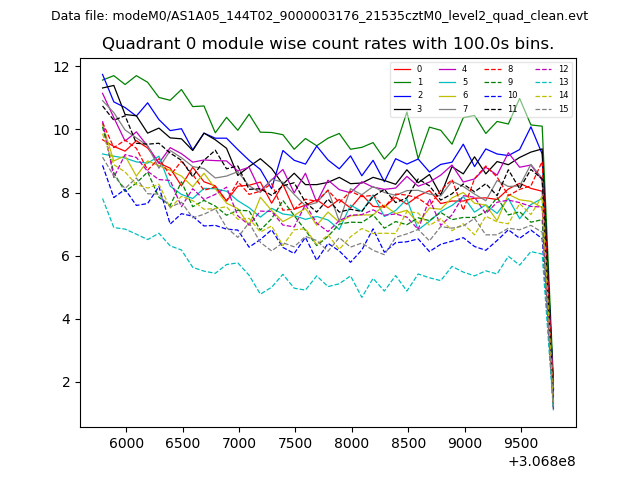
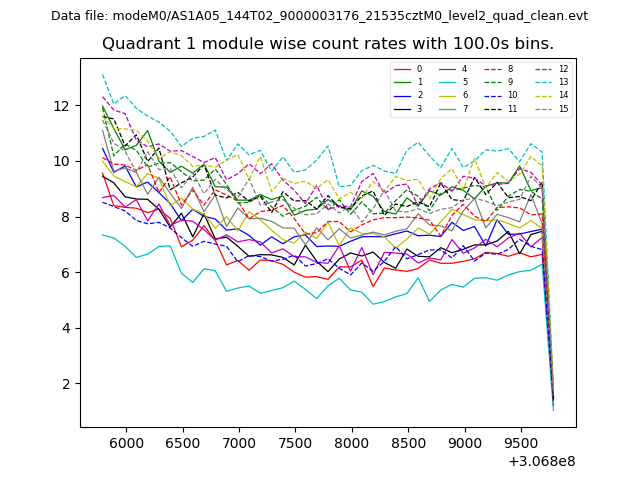
| Module-wise count rates for Quadrant A Data is divided into 100 sec bins |
 |
 |
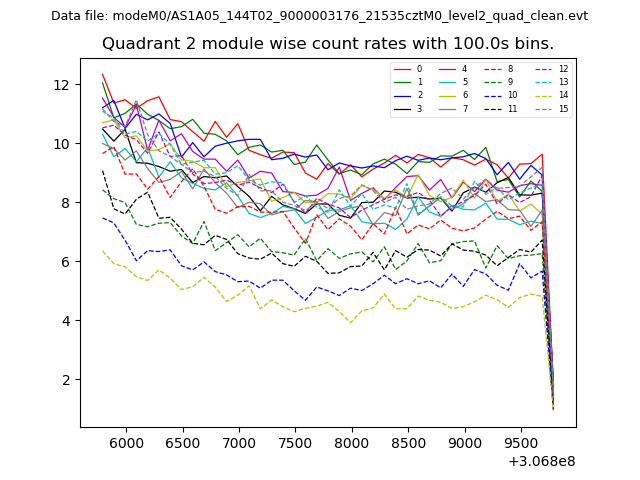
| Module-wise count rates for Quadrant B Data is divided into 100 sec bins |
 |
 |
| Module-wise count rates for Quadrant C Data is divided into 100 sec bins |
 |
 |
| Module-wise count rates for Quadrant D Data is divided into 100 sec bins |
 |
 |
| Parameter | Plot |
|---|---|
| CZT HV Monitor | 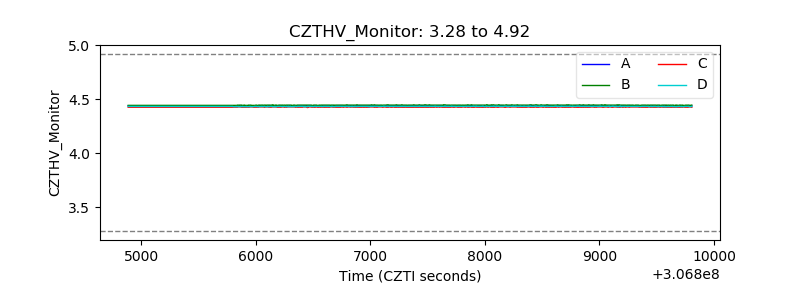 |
| D_VDD | 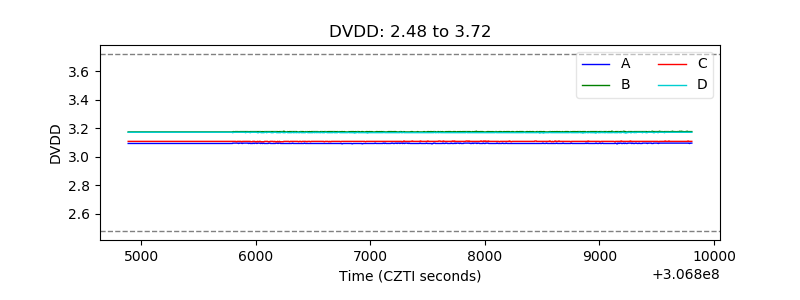 |
| Temperature 1 | 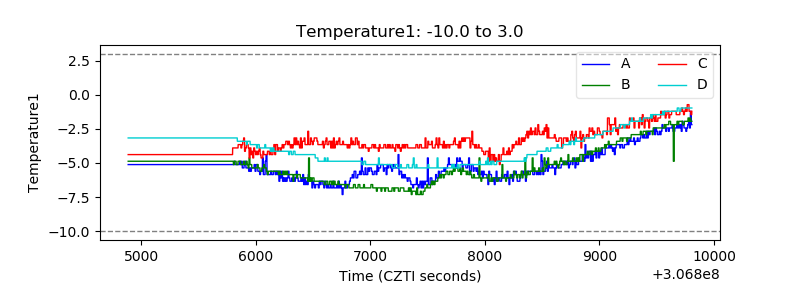 |
| Veto HV Monitor | 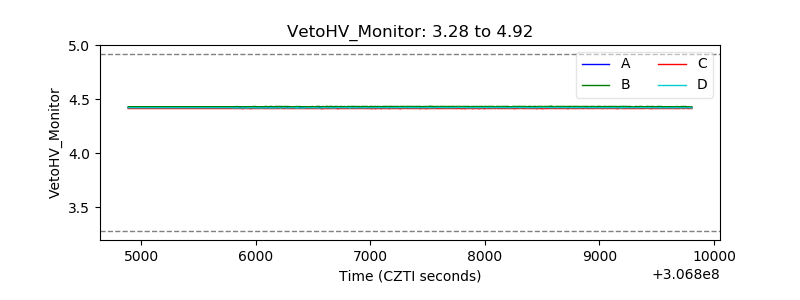 |
| Veto LLD | 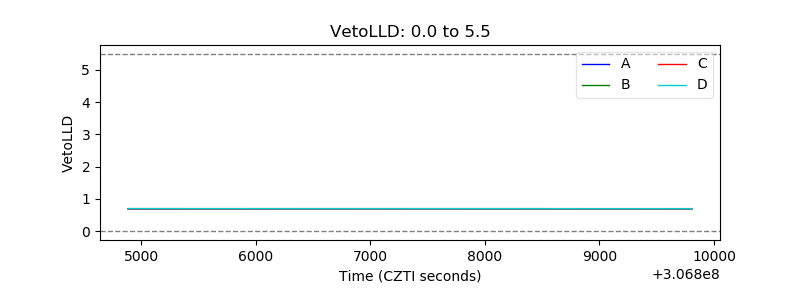 |
| Alpha Counter | 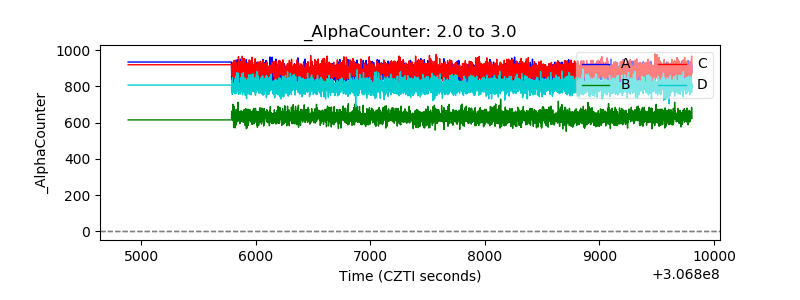 |
| _CPM_Rate | 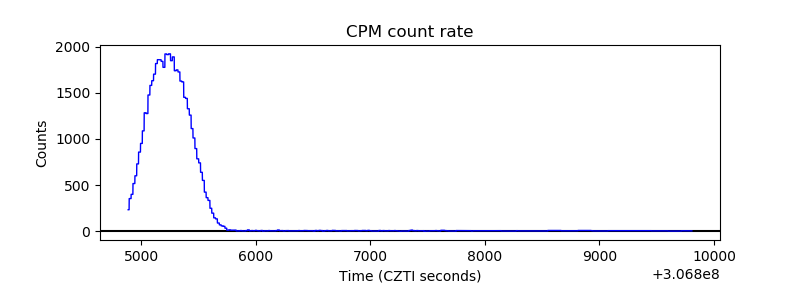 |
| CZT Counter | 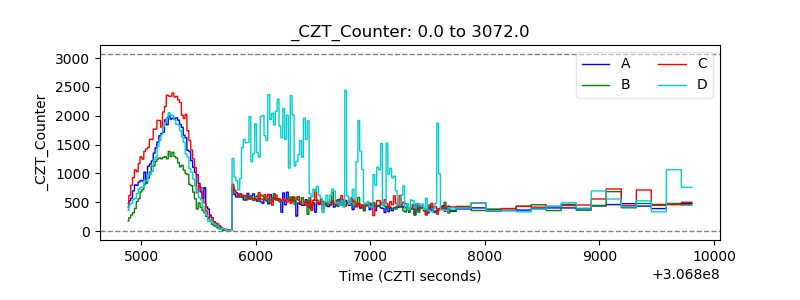 |
| +2.5 Volts monitor |  |
| +5 Volts monitor |  |
| _ROLL_ROT | 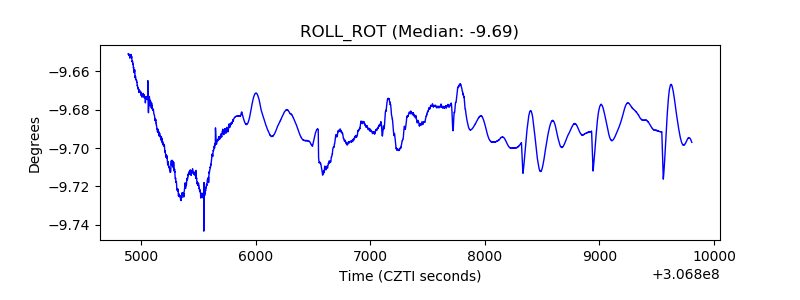 |
| _Roll_DEC | 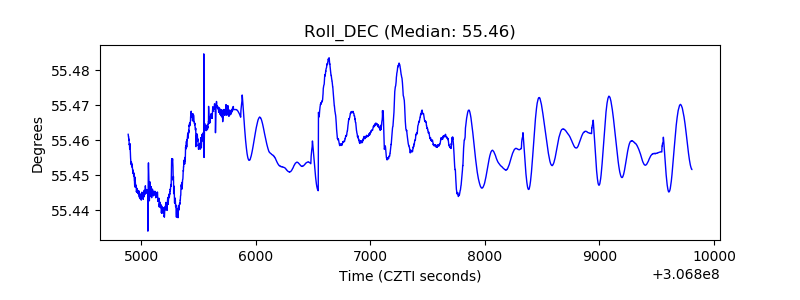 |
| _Roll_RA | 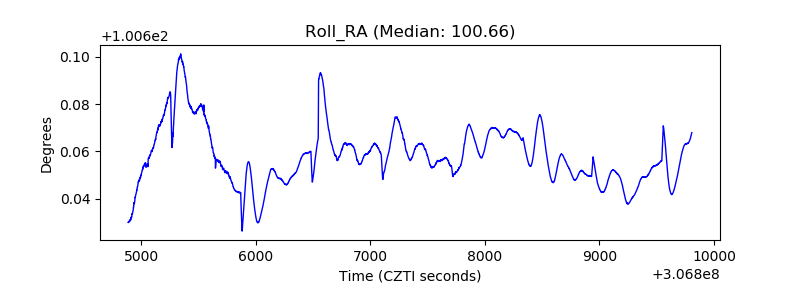 |
| Veto Counter | 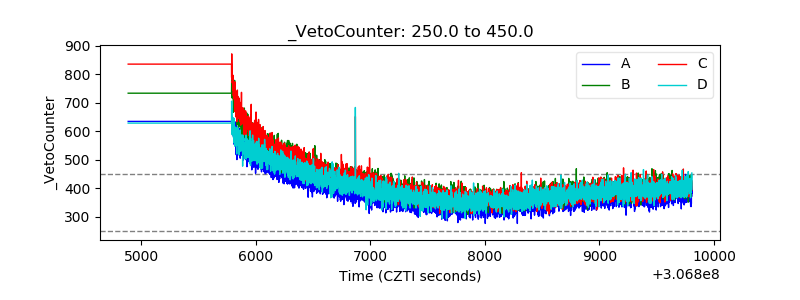 |