| Param | Original file | Final file |
|---|---|---|
| Filename | modeM0/AS1A05_166T01_9000003192cztM0_level2.fits | modeM0/AS1A05_166T01_9000003192cztM0_level2_quad_clean.evt |
| Size (bytes) | 604,186,560 | 514,964,160 |
| Size | 576.2 MB | 491.1 MB |
| Events in quadrant A | 3,785,703 | 3,029,567 |
| Events in quadrant B | 3,595,062 | 3,016,054 |
| Events in quadrant C | 3,693,060 | 2,936,020 |
| Events in quadrant D | 3,177,926 | 2,567,068 |
| Mode M0 | |||
|---|---|---|---|
| Quadrant | BADHDUFLAG | Total packets | Discarded packets |
| A | 0 | 123060 | 0 |
| B | 0 | 128592 | 0 |
| C | 0 | 129599 | 0 |
| D | 0 | 164553 | 0 |
| Mode M9 | |||
|---|---|---|---|
| Quadrant | BADHDUFLAG | Total packets | Discarded packets |
| A | 0 | 116 | 0 |
| B | 0 | 116 | 0 |
| C | 0 | 116 | 0 |
| D | 0 | 116 | 0 |
| Mode SS | |||
|---|---|---|---|
| Quadrant | BADHDUFLAG | Total packets | Discarded packets |
| A | 0 | 1202 | 0 |
| B | 0 | 1198 | 0 |
| C | 0 | 1204 | 0 |
| D | 0 | 1200 | 0 |
| Quadrant | Total seconds | Saturated seconds | Saturation percentage |
|---|---|---|---|
| A | 59013 | 482 | 0.816769% |
| B | 59028 | 694 | 1.175713% |
| C | 58860 | 1012 | 1.719334% |
| D | 58988 | 2417 | 4.097444% |
Noise dominated data is calculated using 1-second bins in cleaned event files. If a bin has >2000 counts, and if more than 50% of those come from <1% of pixels, then it is considered to be noise-dominated and hence unusable.
| Quadrant | # 1 sec bins | Bins with >0 counts | Bins with >2000 counts | High rate bins dominated by noise | Noise dominated (total time) | Noise dominated (detector-on time) | Marked lightcurve |
|---|---|---|---|---|---|---|---|
| A | 73279 | 59475 | 0 | 0 | 0.00% | 0.00% |  |
| B | 73278 | 59506 | 0 | 0 | 0.00% | 0.00% | 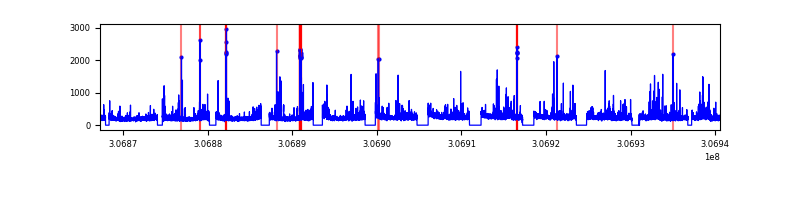 |
| C | 73279 | 59392 | 0 | 0 | 0.00% | 0.00% | 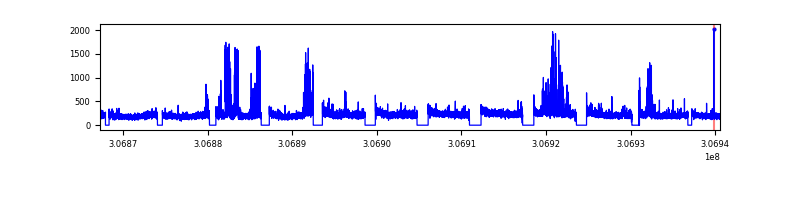 |
| D | 73279 | 59428 | 0 | 0 | 0.00% | 0.00% |  |
Top three noisy pixels from each quadrant. If the there are fewer than three noisy pixels in the level2.evt file, extra rows are filled as -1
| Pixel properties | Quadrant properties | ||||||
|---|---|---|---|---|---|---|---|
| Quadrant | DetID | PixID | Counts | Sigma | Mean | Median | Sigma |
| A | 0 | 29 | 3678 | 11.48 | 985 | 932 | 239.1 |
| A | 7 | 110 | 2982 | 8.57 | 985 | 932 | 239.1 |
| A | 0 | 30 | 2844 | 7.99 | 985 | 932 | 239.1 |
| B | 2 | 9 | 2838 | 10.41 | 954 | 917 | 184.5 |
| B | 5 | 128 | 2363 | 7.84 | 954 | 917 | 184.5 |
| B | 2 | 8 | 2343 | 7.73 | 954 | 917 | 184.5 |
| C | 3 | 126 | 2549 | 6.62 | 975 | 919 | 246.2 |
| C | 7 | 111 | 2489 | 6.38 | 975 | 919 | 246.2 |
| C | 2 | 191 | 2475 | 6.32 | 975 | 919 | 246.2 |
| D | 10 | 189 | 2261 | 5.97 | 909 | 833 | 239.1 |
| D | 6 | 231 | 2252 | 5.93 | 909 | 833 | 239.1 |
| D | 3 | 14 | 2248 | 5.92 | 909 | 833 | 239.1 |
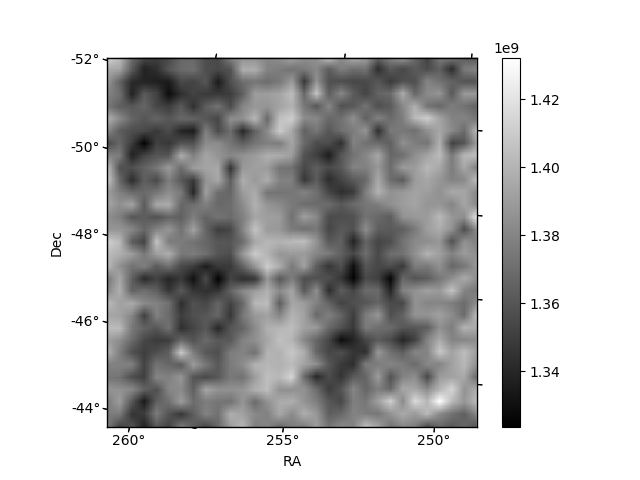
Histogram calculated using DETX and DETY for each event in the final _common_clean file
| Quadrant A | 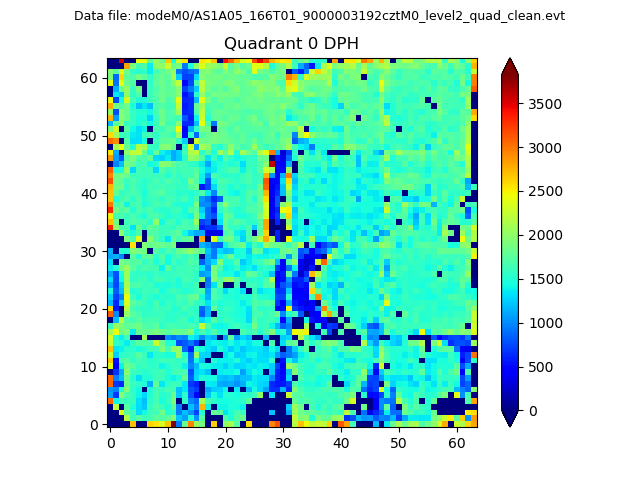 |
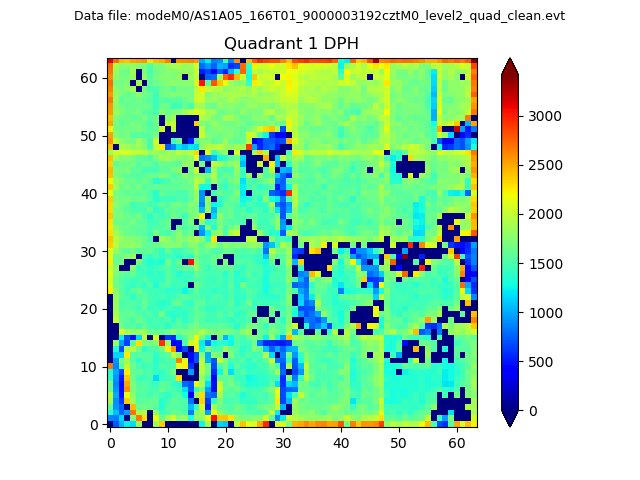 |
Quadrant B |
|---|---|---|---|
| Quadrant D |  |
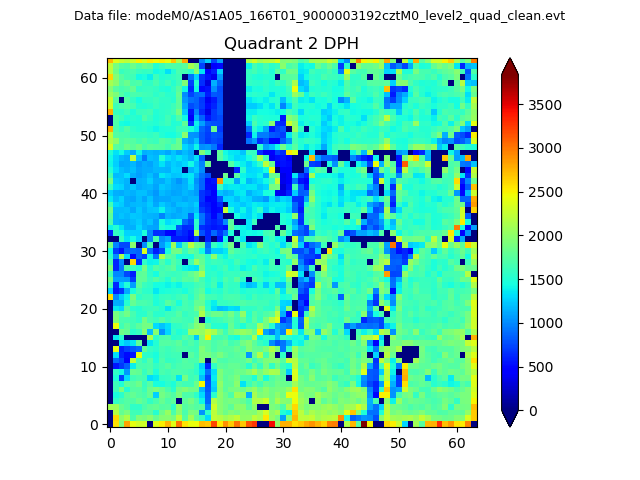 |
Quadrant C |
| Plot type | Count rate plots | Images |
|---|---|---|
| Comparison with Poisson distribution Blue bars denote a histogram of data divided into 1 sec bins. Red curve is a Poisson curve with rate = median count rate of data. |
 |
 |
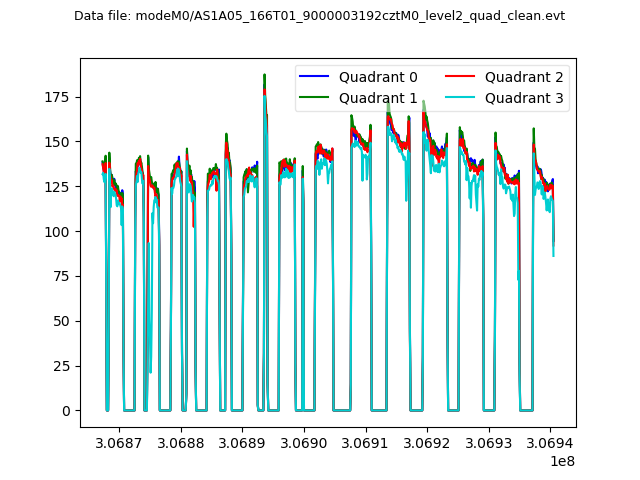
| Quadrant-wise count rates Data is divided into 100 sec bins |
 |
|
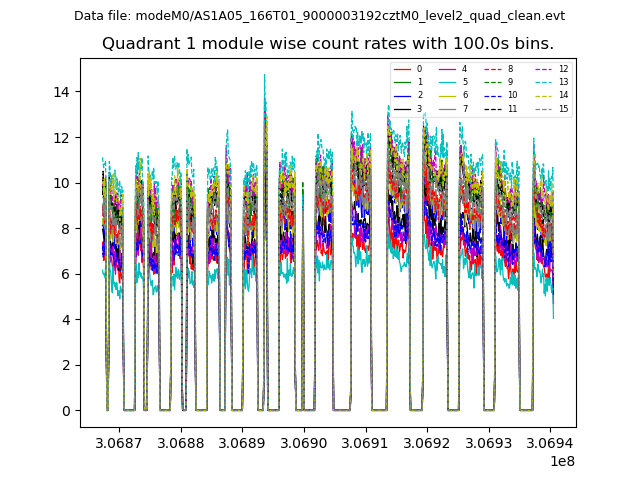
| Module-wise count rates for Quadrant A Data is divided into 100 sec bins |
 |
 |
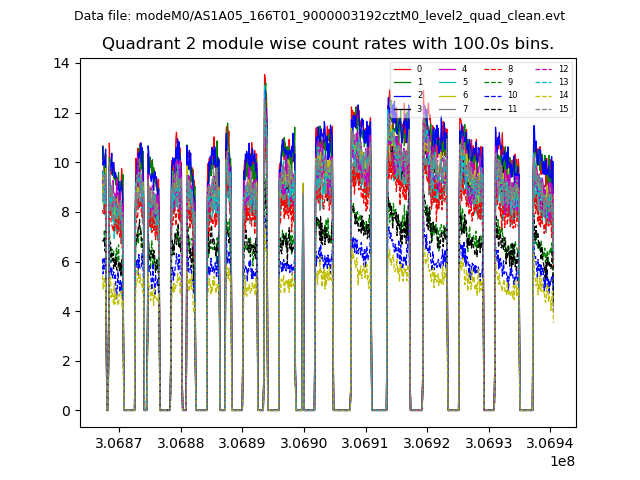
| Module-wise count rates for Quadrant B Data is divided into 100 sec bins |
 |
 |
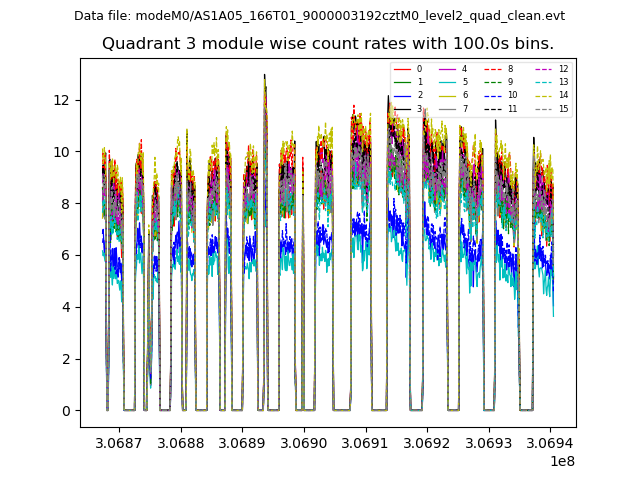
| Module-wise count rates for Quadrant C Data is divided into 100 sec bins |
 |
 |
| Module-wise count rates for Quadrant D Data is divided into 100 sec bins |
 |
 |
| Parameter | Plot |
|---|---|
| CZT HV Monitor |  |
| D_VDD | 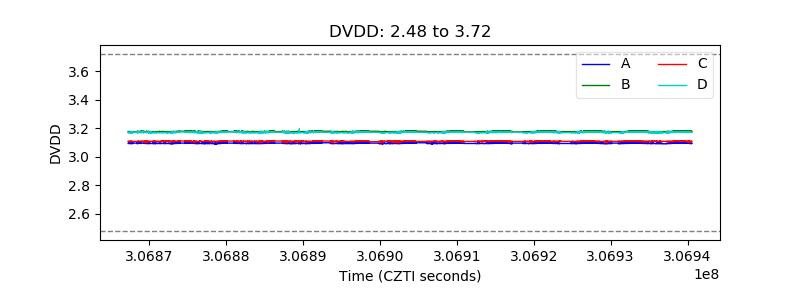 |
| Temperature 1 |  |
| Veto HV Monitor | 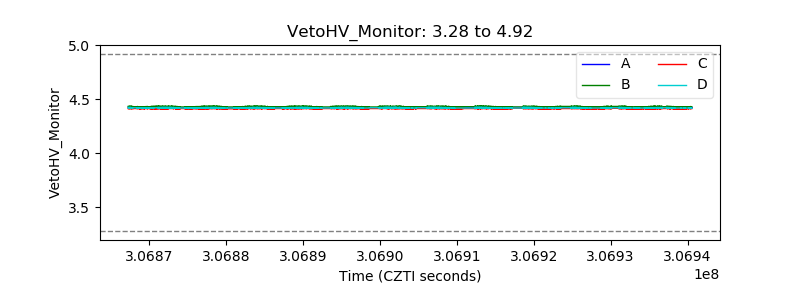 |
| Veto LLD |  |
| Alpha Counter |  |
| _CPM_Rate |  |
| CZT Counter |  |
| +2.5 Volts monitor |  |
| +5 Volts monitor |  |
| _ROLL_ROT |  |
| _Roll_DEC |  |
| _Roll_RA |  |
| Veto Counter | 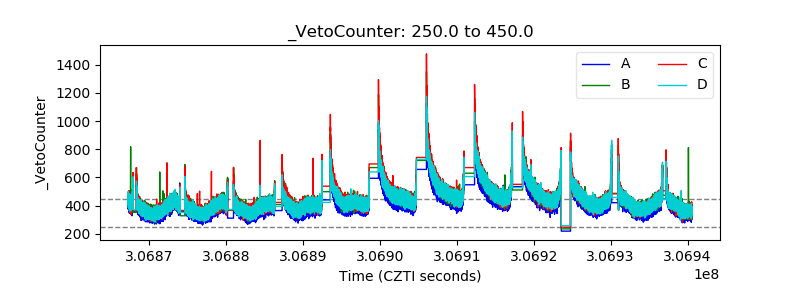 |