| Param | Original file | Final file |
|---|---|---|
| Filename | modeM0/AS1A05_166T01_9000003192_21546cztM0_level2.evt | modeM0/AS1A05_166T01_9000003192_21546cztM0_level2_quad_clean.evt |
| Size (bytes) | 869,218,560 | 169,090,560 |
| Size | 829.0 MB | 161.3 MB |
| Events in quadrant A | 5,613,271 | 1,097,496 |
| Events in quadrant B | 5,880,885 | 1,111,314 |
| Events in quadrant C | 5,950,331 | 1,076,401 |
| Events in quadrant D | 8,050,720 | 989,078 |
| Mode M0 | |||
|---|---|---|---|
| Quadrant | BADHDUFLAG | Total packets | Discarded packets |
| A | 0 | 24917 | 2 |
| B | 0 | 25444 | 2 |
| C | 0 | 25796 | 2 |
| D | 0 | 32291 | 2 |
| Mode M9 | |||
|---|---|---|---|
| Quadrant | BADHDUFLAG | Total packets | Discarded packets |
| A | 0 | 13 | 0 |
| B | 0 | 13 | 0 |
| C | 0 | 13 | 0 |
| D | 0 | 13 | 0 |
| Mode SS | |||
|---|---|---|---|
| Quadrant | BADHDUFLAG | Total packets | Discarded packets |
| A | 0 | 250 | 0 |
| B | 0 | 250 | 0 |
| C | 0 | 250 | 0 |
| D | 0 | 250 | 0 |
| Quadrant | Total seconds | Saturated seconds | Saturation percentage |
|---|---|---|---|
| A | 12243 | 36 | 0.294046% |
| B | 12244 | 65 | 0.530872% |
| C | 12243 | 153 | 1.249694% |
| D | 12243 | 760 | 6.207629% |
Noise dominated data is calculated using 1-second bins in cleaned event files. If a bin has >2000 counts, and if more than 50% of those come from <1% of pixels, then it is considered to be noise-dominated and hence unusable.
| Quadrant | # 1 sec bins | Bins with >0 counts | Bins with >2000 counts | High rate bins dominated by noise | Noise dominated (total time) | Noise dominated (detector-on time) | Marked lightcurve |
|---|---|---|---|---|---|---|---|
| A | 13603 | 12245 | 3 | 3 | 0.02% | 0.02% | 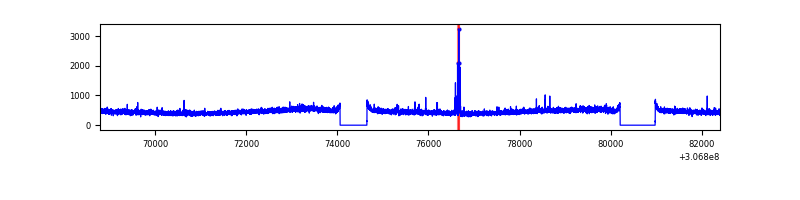 |
| B | 13604 | 12246 | 19 | 19 | 0.14% | 0.16% | 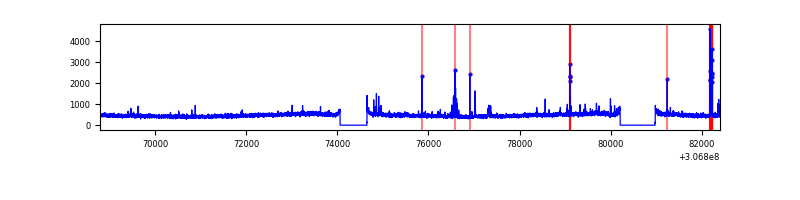 |
| C | 13603 | 12245 | 72 | 72 | 0.53% | 0.59% | 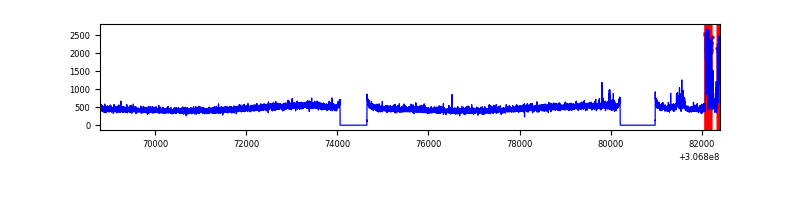 |
| D | 13603 | 12245 | 706 | 706 | 5.19% | 5.77% | 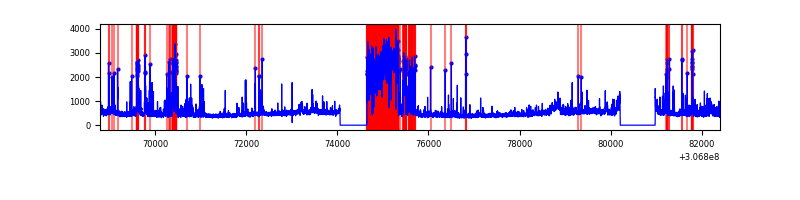 |
Top three noisy pixels from each quadrant. If the there are fewer than three noisy pixels in the level2.evt file, extra rows are filled as -1
| Pixel properties | Quadrant properties | ||||||
|---|---|---|---|---|---|---|---|
| Quadrant | DetID | PixID | Counts | Sigma | Mean | Median | Sigma |
| A | 12 | 96 | 58097 | 195.28 | 1439 | 1406 | 290.3 |
| A | 13 | 254 | 19369 | 61.88 | 1439 | 1406 | 290.3 |
| A | 0 | 226 | 12480 | 38.15 | 1439 | 1406 | 290.3 |
| B | 0 | 230 | 89965 | 325.75 | 1442 | 1408 | 271.9 |
| B | 4 | 190 | 56168 | 201.43 | 1442 | 1408 | 271.9 |
| B | 3 | 64 | 44908 | 160.01 | 1442 | 1408 | 271.9 |
| C | 3 | 233 | 356071 | 1101.64 | 1376 | 1380 | 322.0 |
| C | 14 | 238 | 216544 | 668.28 | 1376 | 1380 | 322.0 |
| C | 0 | 239 | 14955 | 42.16 | 1376 | 1380 | 322.0 |
| D | 7 | 38 | 1697387 | 5276.04 | 1342 | 1305 | 321.5 |
| D | 1 | 52 | 541114 | 1679.2 | 1342 | 1305 | 321.5 |
| D | 14 | 35 | 244985 | 758.02 | 1342 | 1305 | 321.5 |
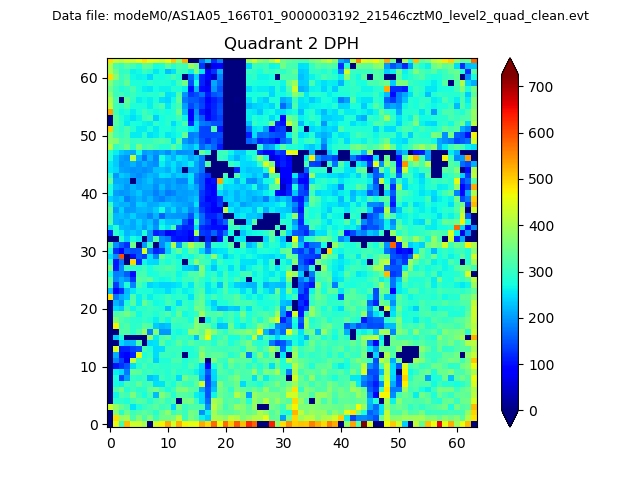
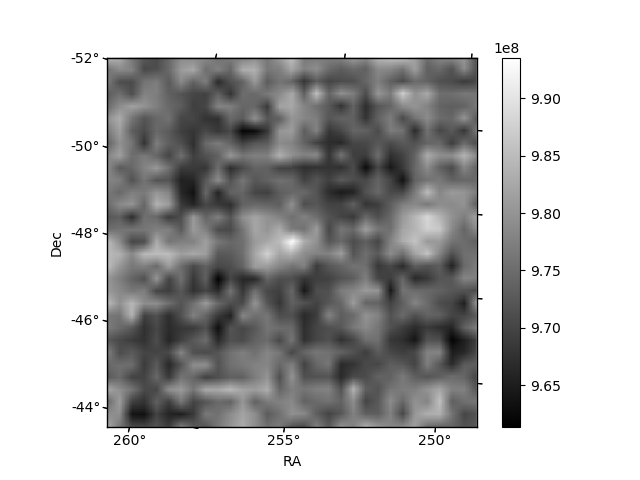
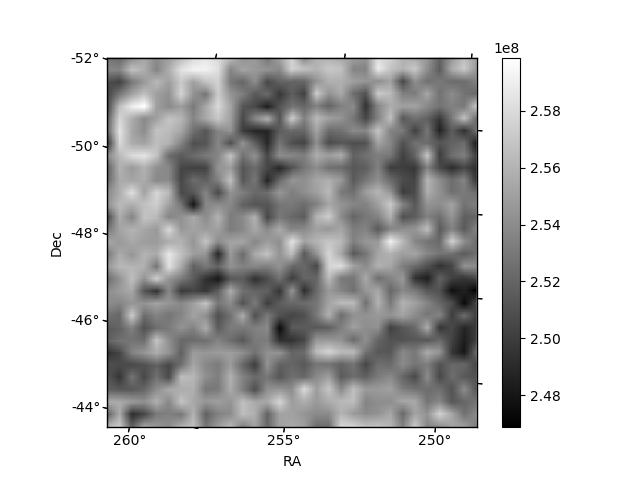
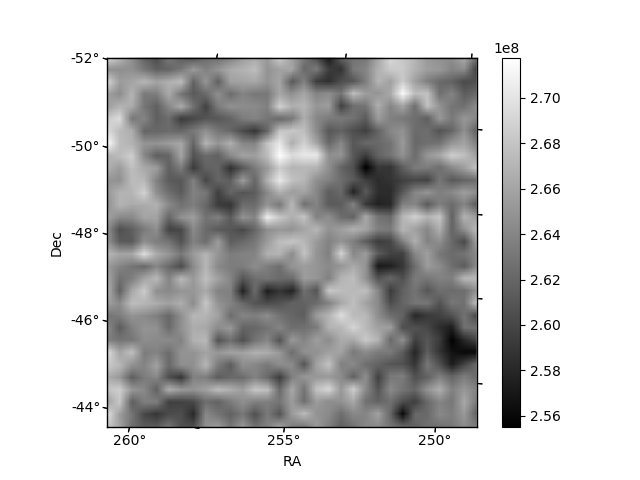
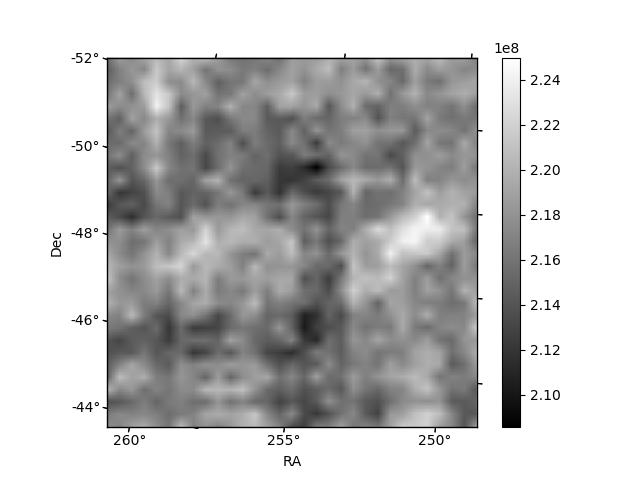
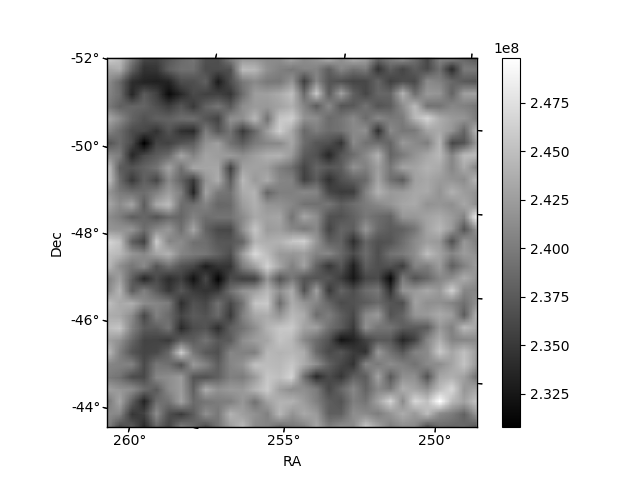
Histogram calculated using DETX and DETY for each event in the final _common_clean file
| Quadrant A | 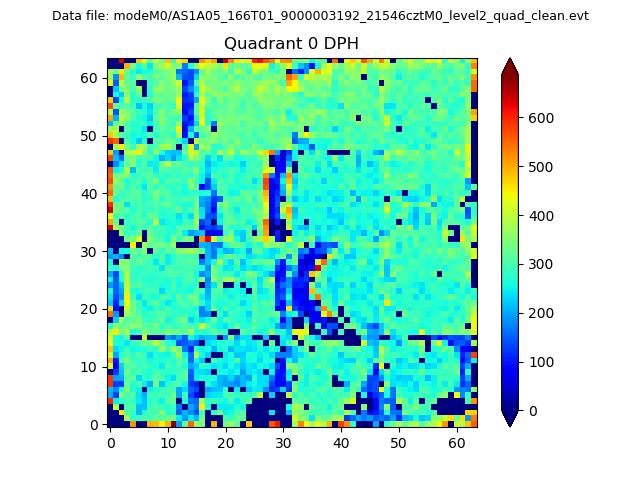 |
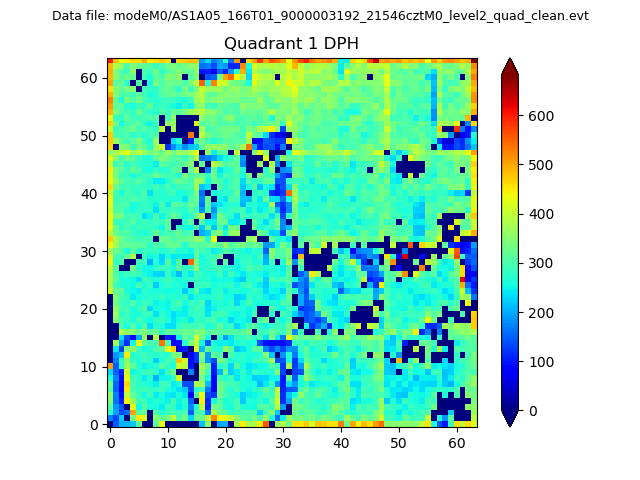 |
Quadrant B |
|---|---|---|---|
| Quadrant D | 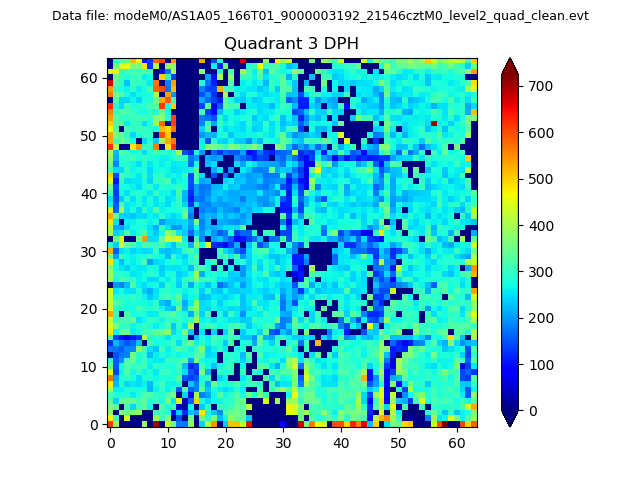 |
 |
Quadrant C |
| Plot type | Count rate plots | Images |
|---|---|---|
| Comparison with Poisson distribution Blue bars denote a histogram of data divided into 1 sec bins. Red curve is a Poisson curve with rate = median count rate of data. |
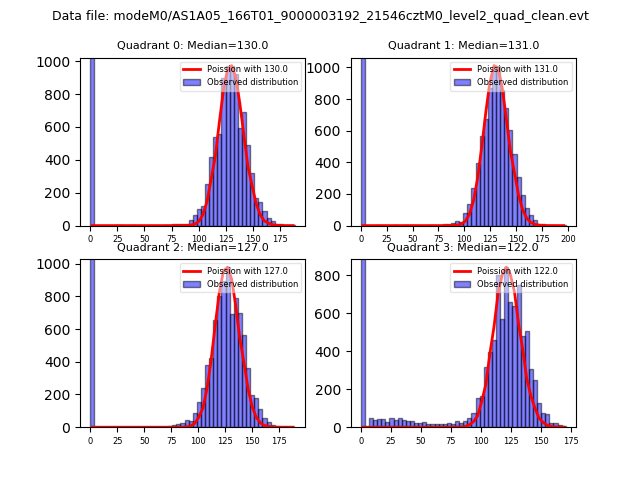 |
 |
| Quadrant-wise count rates Data is divided into 100 sec bins |
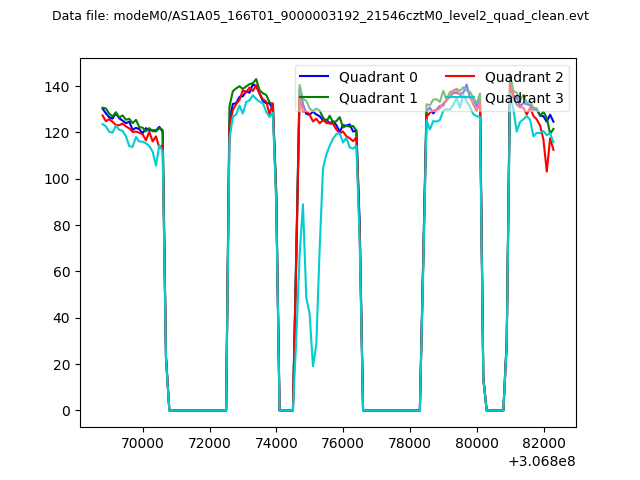 |
|
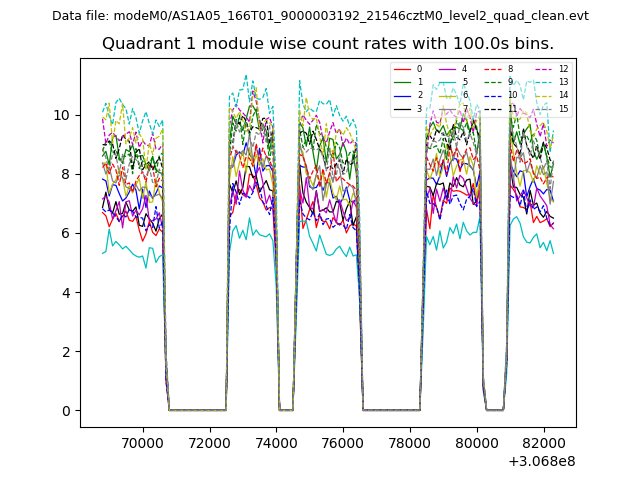
| Module-wise count rates for Quadrant A Data is divided into 100 sec bins |
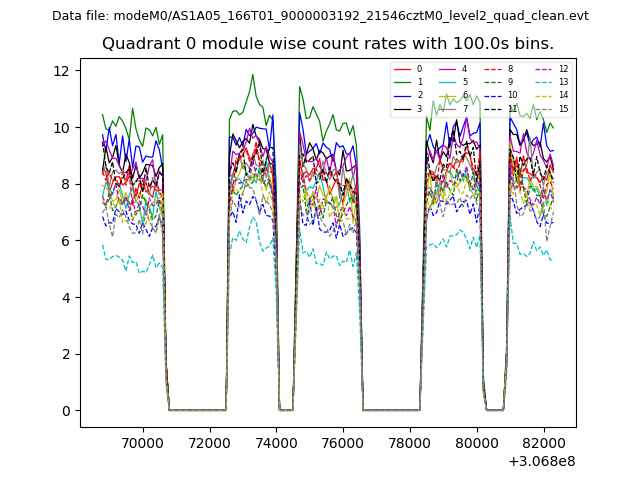 |
 |
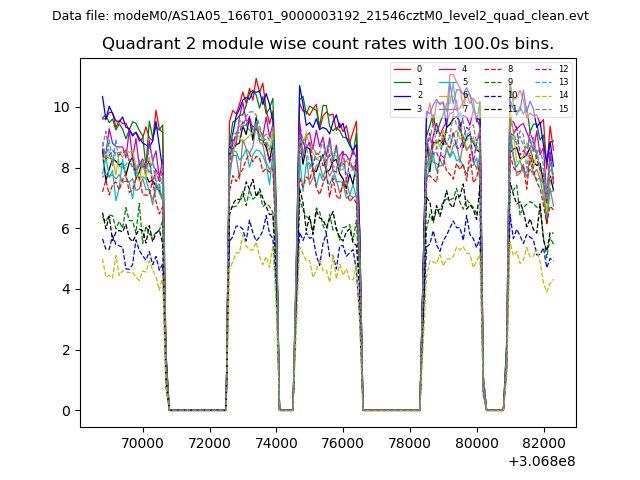
| Module-wise count rates for Quadrant B Data is divided into 100 sec bins |
 |
 |
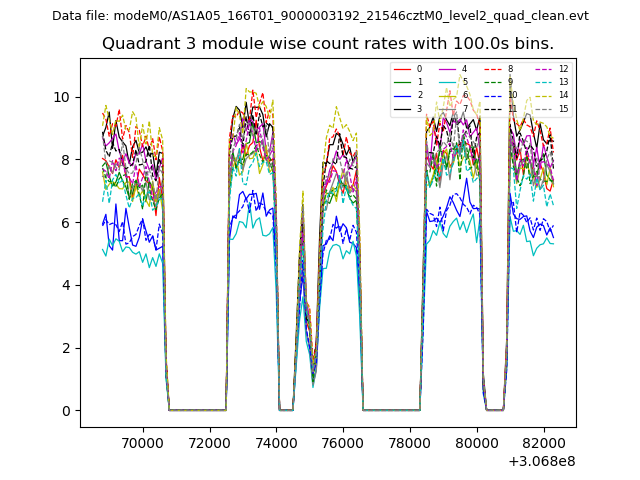
| Module-wise count rates for Quadrant C Data is divided into 100 sec bins |
 |
 |
| Module-wise count rates for Quadrant D Data is divided into 100 sec bins |
 |
 |
| Parameter | Plot |
|---|---|
| CZT HV Monitor | 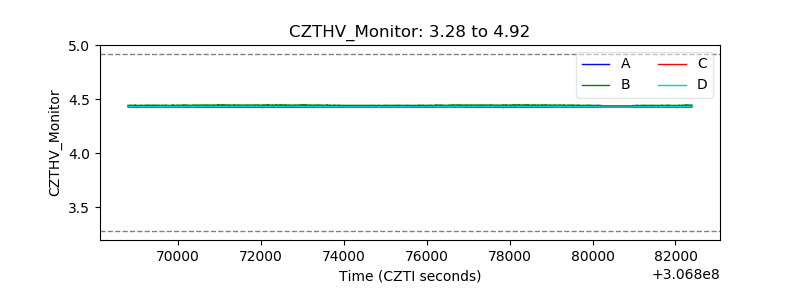 |
| D_VDD | 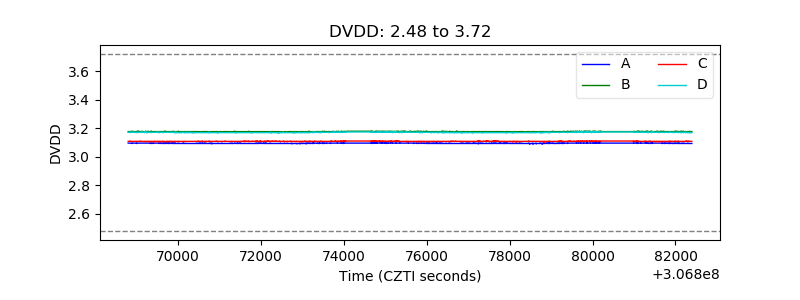 |
| Temperature 1 | 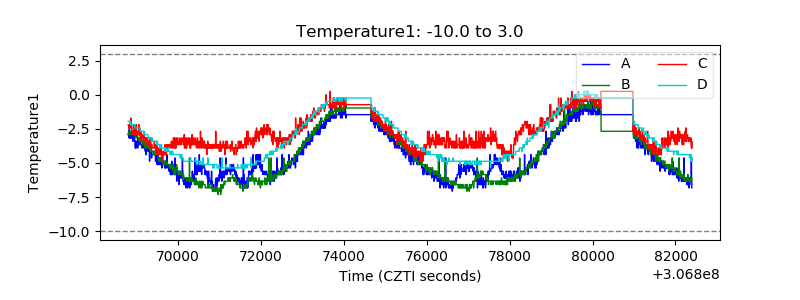 |
| Veto HV Monitor | 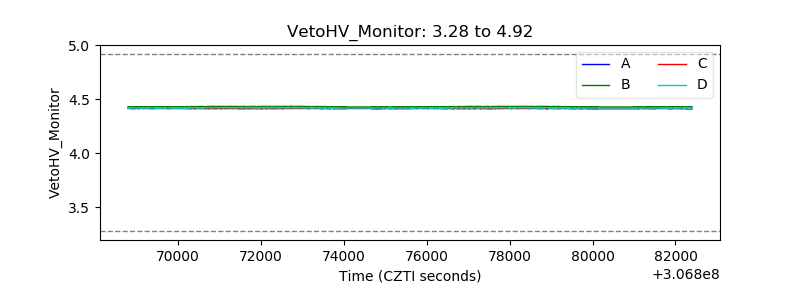 |
| Veto LLD | 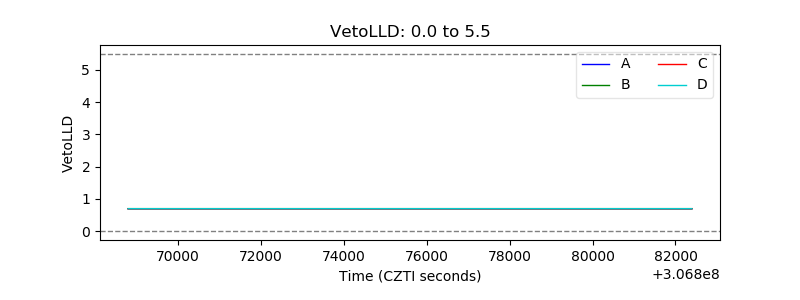 |
| Alpha Counter | 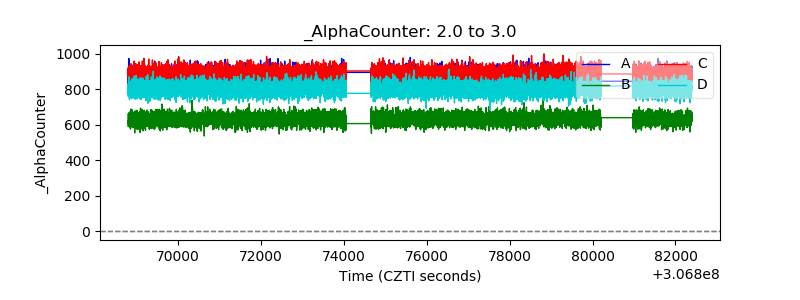 |
| _CPM_Rate |  |
| CZT Counter | 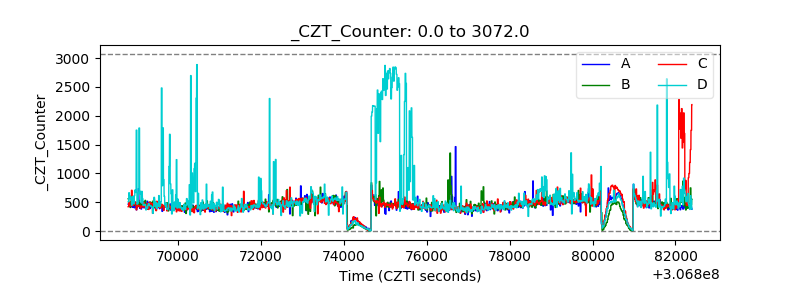 |
| +2.5 Volts monitor |  |
| +5 Volts monitor | 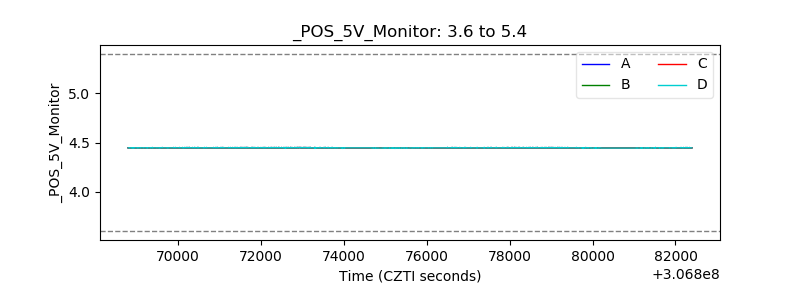 |
| _ROLL_ROT | 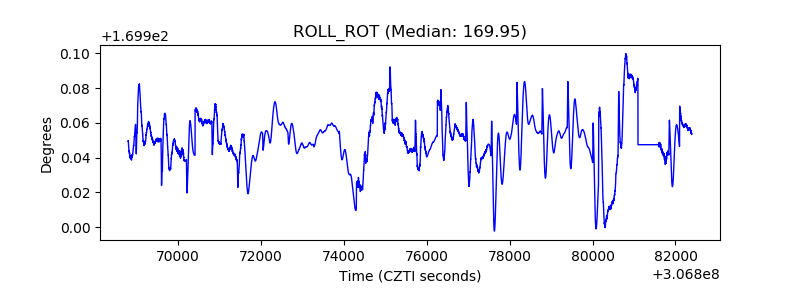 |
| _Roll_DEC |  |
| _Roll_RA | 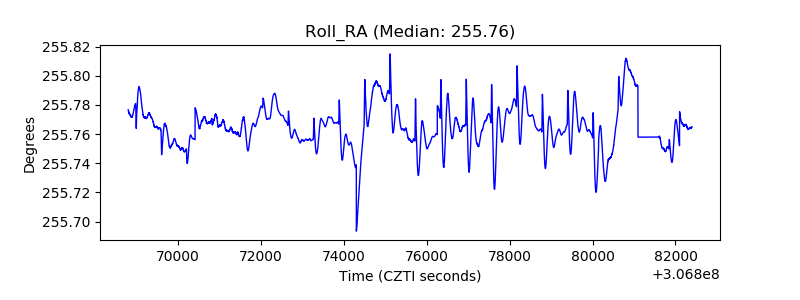 |
| Veto Counter | 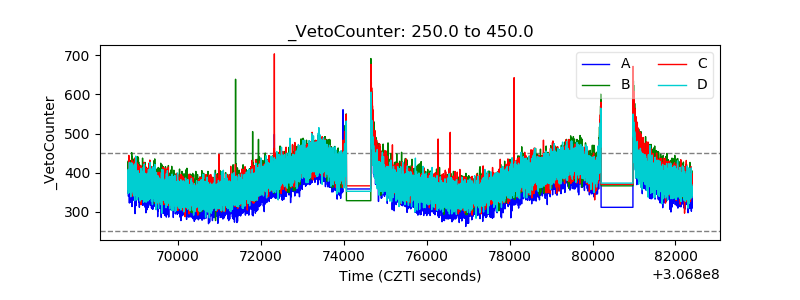 |