| Param | Original file | Final file |
|---|---|---|
| Filename | modeM0/AS1A05_166T01_9000003192_21547cztM0_level2.evt | modeM0/AS1A05_166T01_9000003192_21547cztM0_level2_quad_clean.evt |
| Size (bytes) | 376,588,800 | 78,816,960 |
| Size | 359.1 MB | 75.2 MB |
| Events in quadrant A | 2,527,194 | 520,912 |
| Events in quadrant B | 2,718,568 | 512,000 |
| Events in quadrant C | 3,054,407 | 492,697 |
| Events in quadrant D | 2,740,488 | 487,421 |
| Mode M0 | |||
|---|---|---|---|
| Quadrant | BADHDUFLAG | Total packets | Discarded packets |
| A | 0 | 13516 | 2515 |
| B | 0 | 14223 | 2790 |
| C | 0 | 16735 | 4439 |
| D | 0 | 14892 | 3153 |
| Mode M9 | |||
|---|---|---|---|
| Quadrant | BADHDUFLAG | Total packets | Discarded packets |
| A | 0 | 13 | 0 |
| B | 0 | 14 | 1 |
| C | 0 | 14 | 0 |
| D | 0 | 14 | 0 |
| Mode SS | |||
|---|---|---|---|
| Quadrant | BADHDUFLAG | Total packets | Discarded packets |
| A | 0 | 136 | 28 |
| B | 0 | 136 | 26 |
| C | 0 | 136 | 26 |
| D | 0 | 136 | 28 |
| Quadrant | Total seconds | Saturated seconds | Saturation percentage |
|---|---|---|---|
| A | 5420 | 18 | 0.332103% |
| B | 5353 | 31 | 0.579115% |
| C | 5181 | 111 | 2.142444% |
| D | 5347 | 28 | 0.523658% |
Noise dominated data is calculated using 1-second bins in cleaned event files. If a bin has >2000 counts, and if more than 50% of those come from <1% of pixels, then it is considered to be noise-dominated and hence unusable.
| Quadrant | # 1 sec bins | Bins with >0 counts | Bins with >2000 counts | High rate bins dominated by noise | Noise dominated (total time) | Noise dominated (detector-on time) | Marked lightcurve |
|---|---|---|---|---|---|---|---|
| A | 7639 | 6078 | 0 | 0 | 0.00% | 0.00% | 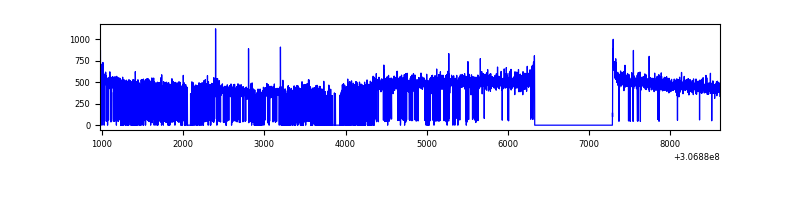 |
| B | 7639 | 6075 | 4 | 4 | 0.05% | 0.07% | 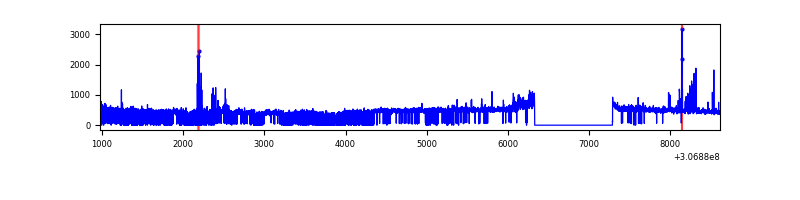 |
| C | 7638 | 5901 | 33 | 33 | 0.43% | 0.56% | 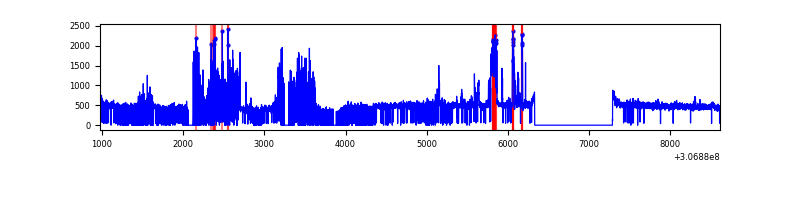 |
| D | 7638 | 6065 | 13 | 13 | 0.17% | 0.21% | 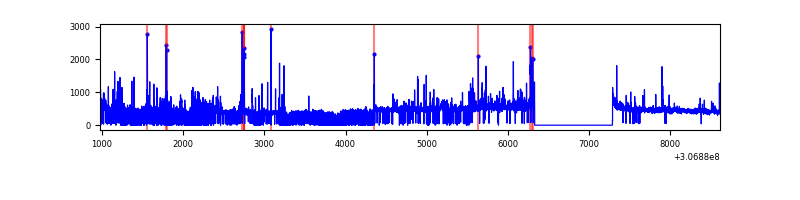 |
Top three noisy pixels from each quadrant. If the there are fewer than three noisy pixels in the level2.evt file, extra rows are filled as -1
| Pixel properties | Quadrant properties | ||||||
|---|---|---|---|---|---|---|---|
| Quadrant | DetID | PixID | Counts | Sigma | Mean | Median | Sigma |
| A | 13 | 254 | 8634 | 60.02 | 655 | 641 | 133.2 |
| A | 0 | 226 | 5615 | 37.35 | 655 | 641 | 133.2 |
| A | 3 | 137 | 5490 | 36.41 | 655 | 641 | 133.2 |
| B | 0 | 230 | 81281 | 652.8 | 646 | 630 | 123.5 |
| B | 0 | 228 | 56473 | 452.0 | 646 | 630 | 123.5 |
| B | 4 | 190 | 17791 | 138.9 | 646 | 630 | 123.5 |
| C | 3 | 233 | 628060 | 4540.32 | 597 | 601 | 138.2 |
| C | 14 | 238 | 93783 | 674.27 | 597 | 601 | 138.2 |
| C | 13 | 61 | 4083 | 25.2 | 597 | 601 | 138.2 |
| D | 1 | 52 | 182753 | 1193.95 | 621 | 602 | 152.6 |
| D | 13 | 153 | 59174 | 383.92 | 621 | 602 | 152.6 |
| D | 13 | 104 | 48852 | 316.27 | 621 | 602 | 152.6 |
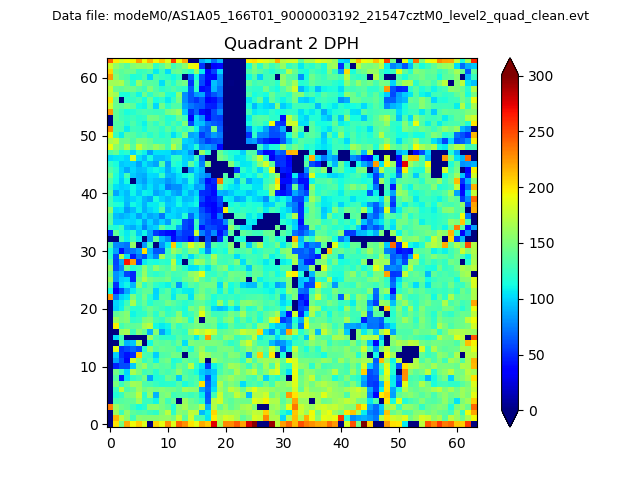
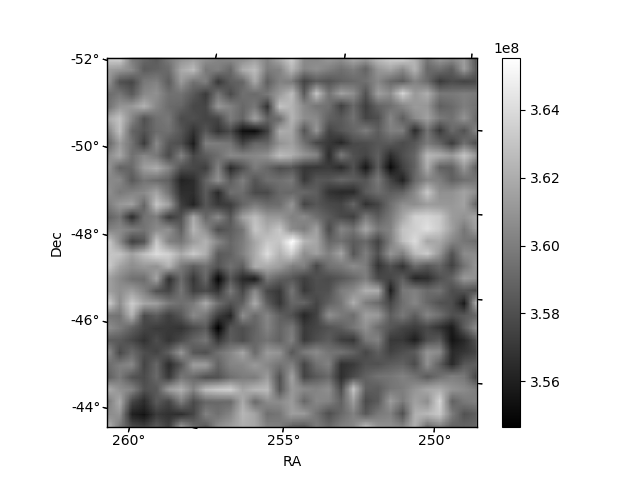
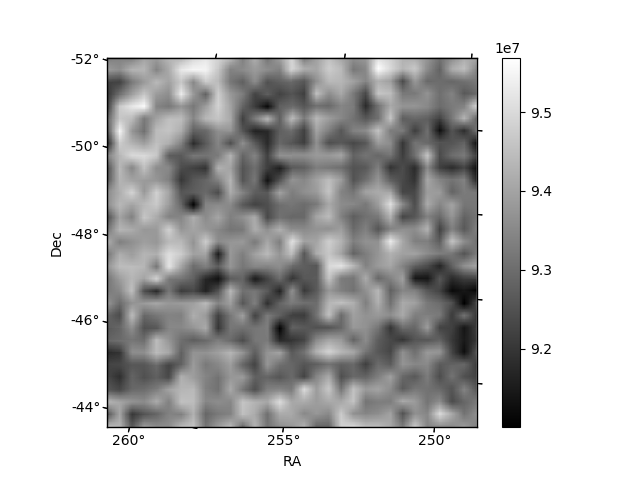
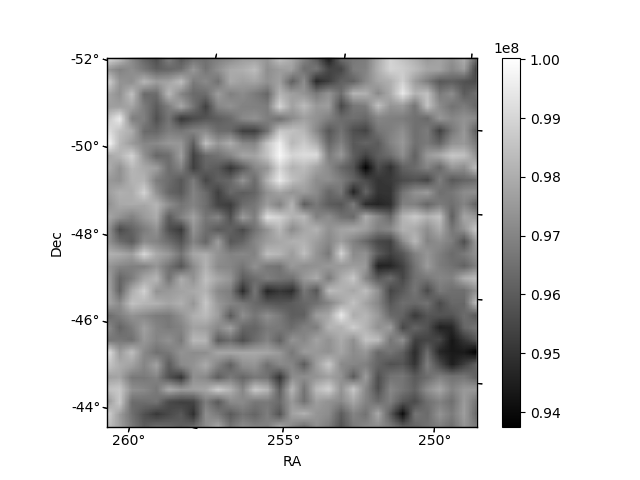
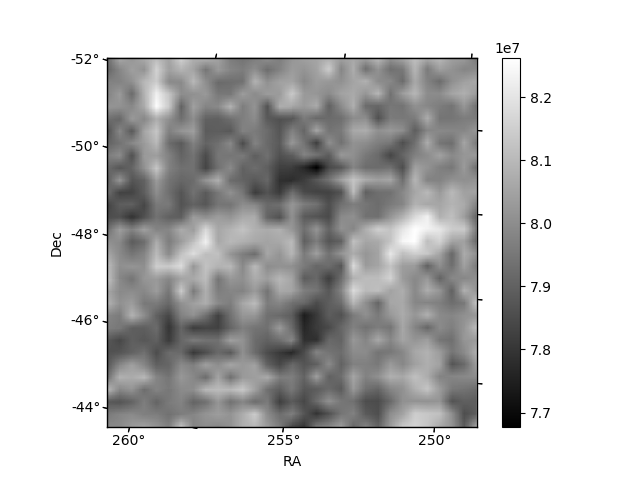
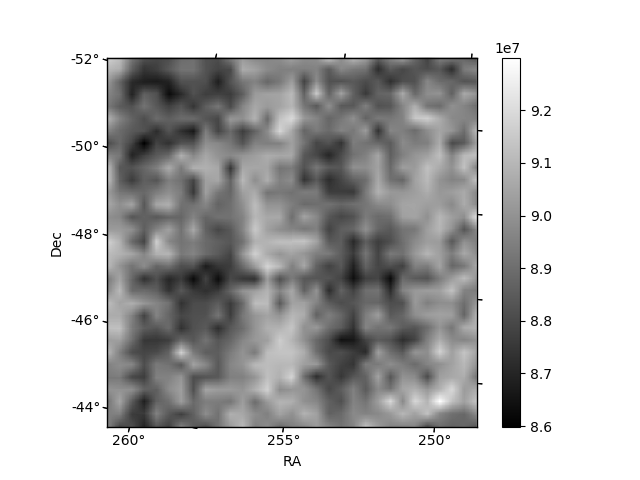
Histogram calculated using DETX and DETY for each event in the final _common_clean file
| Quadrant A | 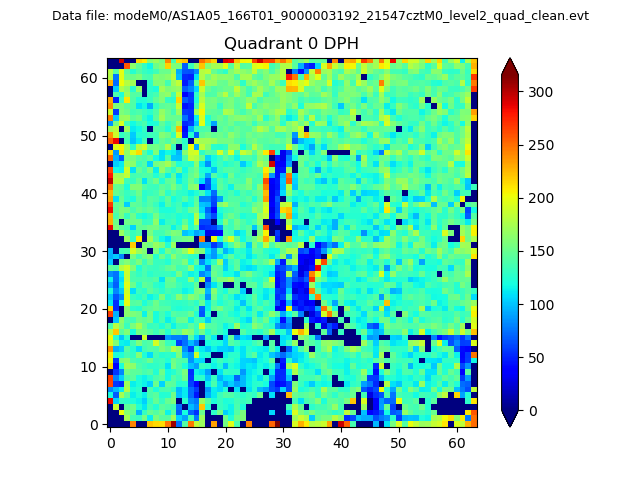 |
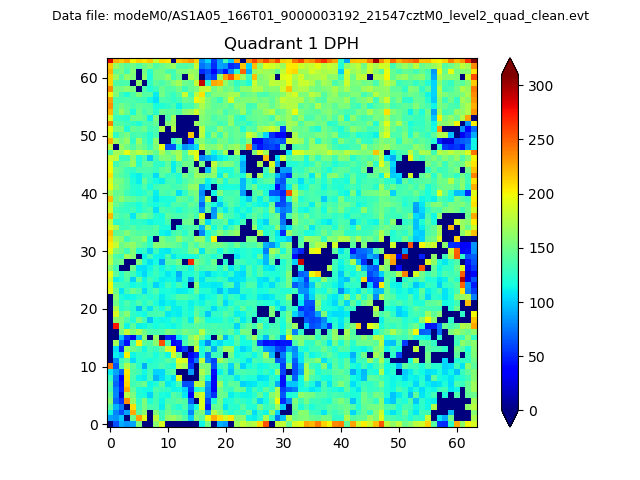 |
Quadrant B |
|---|---|---|---|
| Quadrant D | 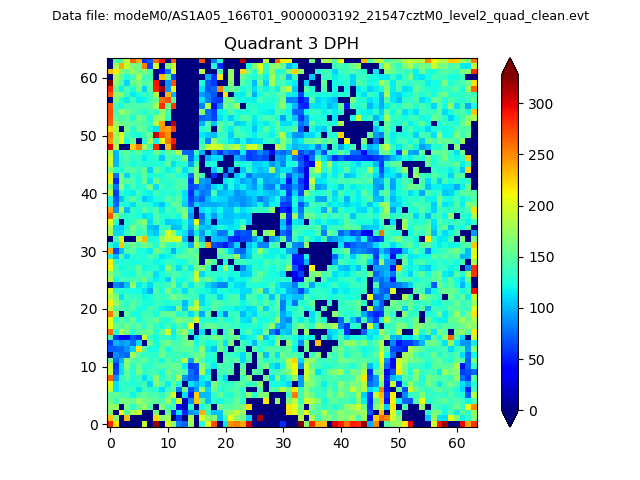 |
 |
Quadrant C |
| Plot type | Count rate plots | Images |
|---|---|---|
| Comparison with Poisson distribution Blue bars denote a histogram of data divided into 1 sec bins. Red curve is a Poisson curve with rate = median count rate of data. |
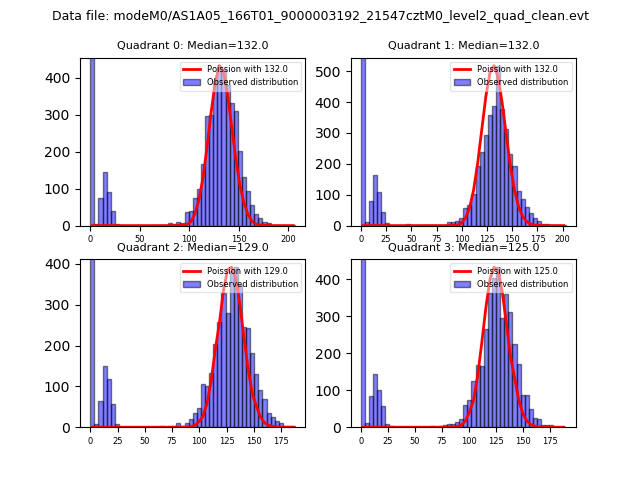 |
 |
| Quadrant-wise count rates Data is divided into 100 sec bins |
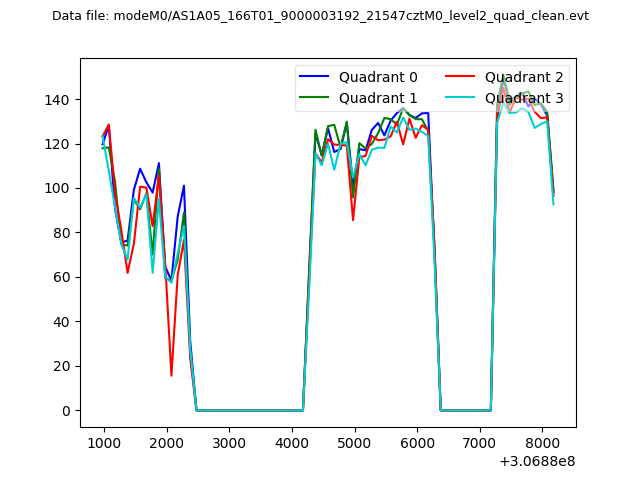 |
|
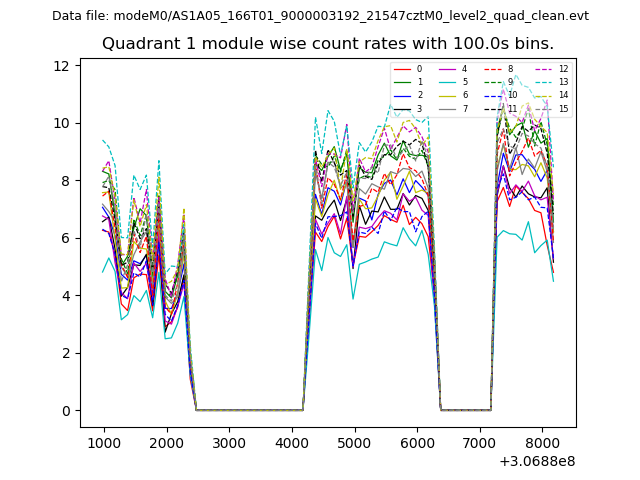
| Module-wise count rates for Quadrant A Data is divided into 100 sec bins |
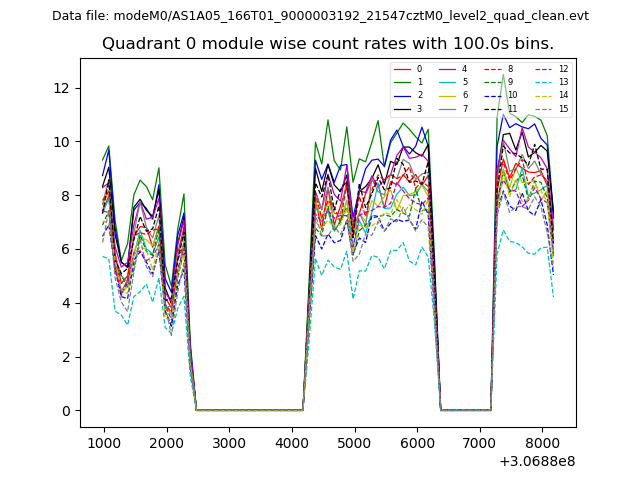 |
 |
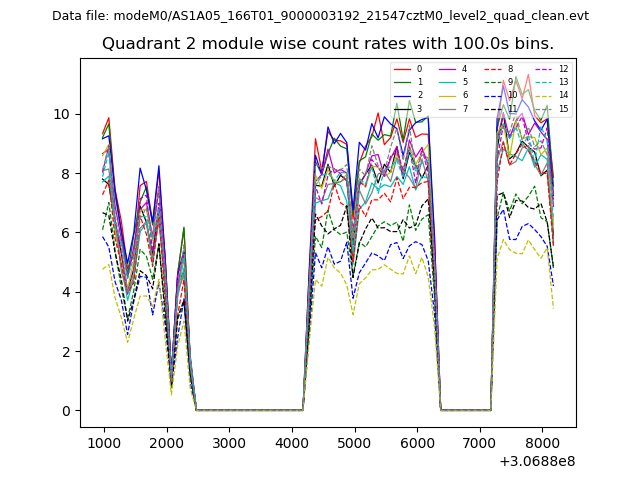
| Module-wise count rates for Quadrant B Data is divided into 100 sec bins |
 |
 |
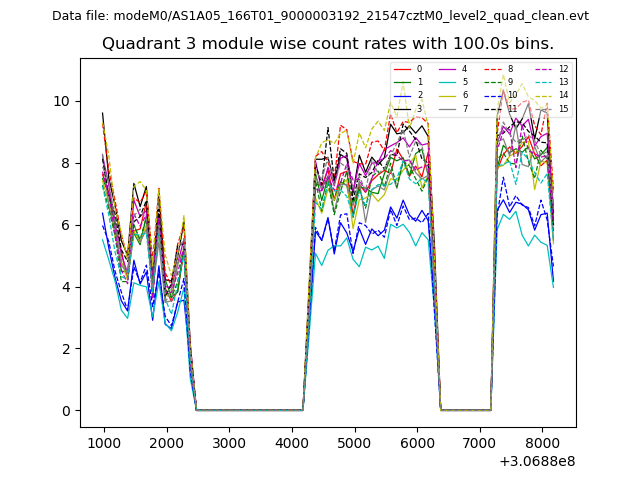
| Module-wise count rates for Quadrant C Data is divided into 100 sec bins |
 |
 |
| Module-wise count rates for Quadrant D Data is divided into 100 sec bins |
 |
 |
| Parameter | Plot |
|---|---|
| CZT HV Monitor | 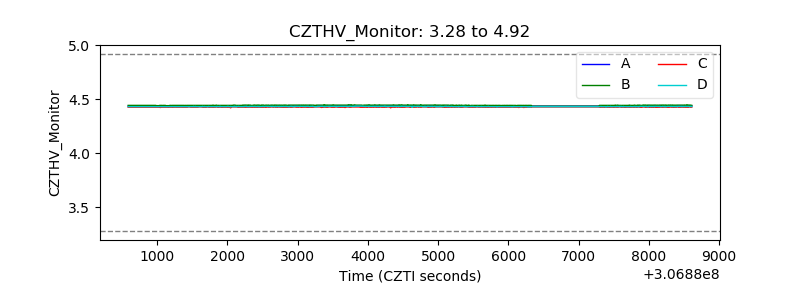 |
| D_VDD | 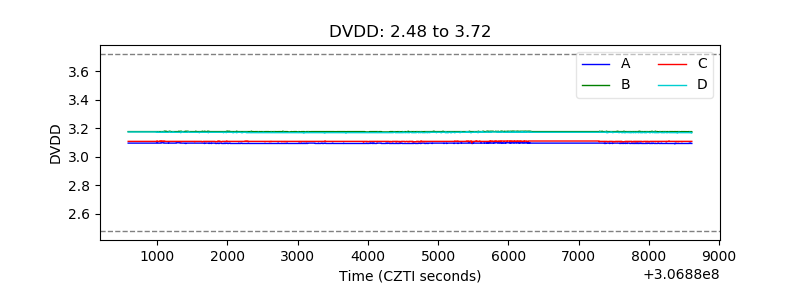 |
| Temperature 1 | 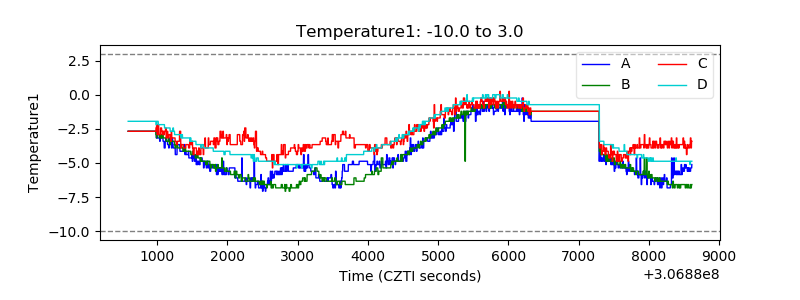 |
| Veto HV Monitor |  |
| Veto LLD | 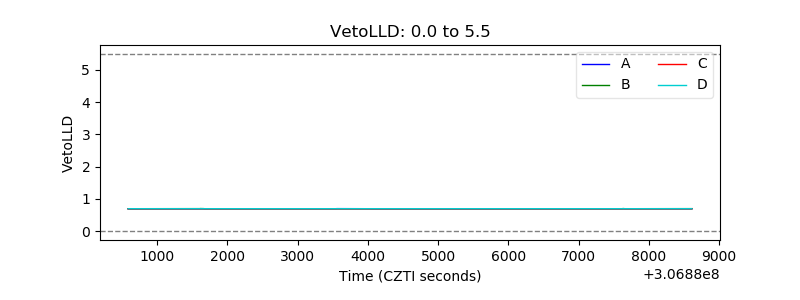 |
| Alpha Counter | 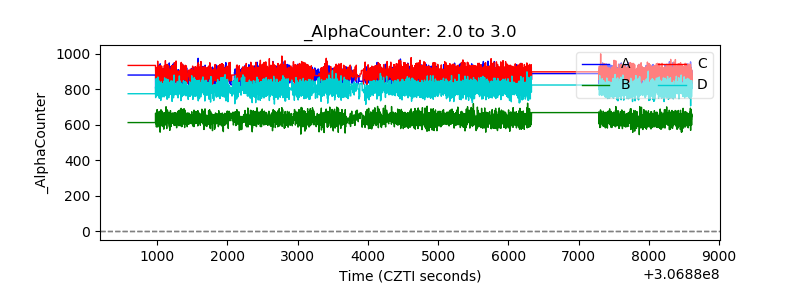 |
| _CPM_Rate | 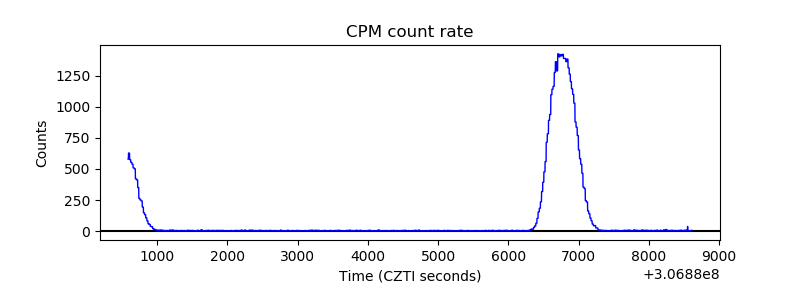 |
| CZT Counter | 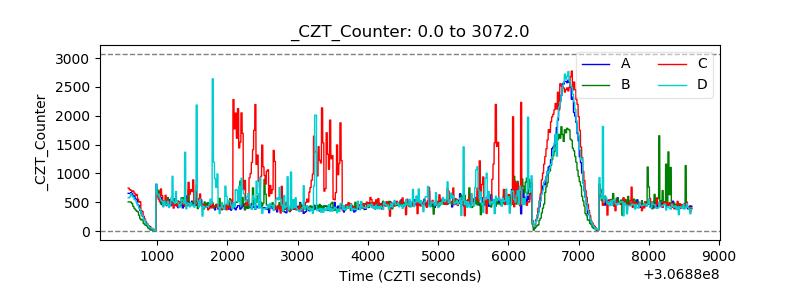 |
| +2.5 Volts monitor |  |
| +5 Volts monitor |  |
| _ROLL_ROT | 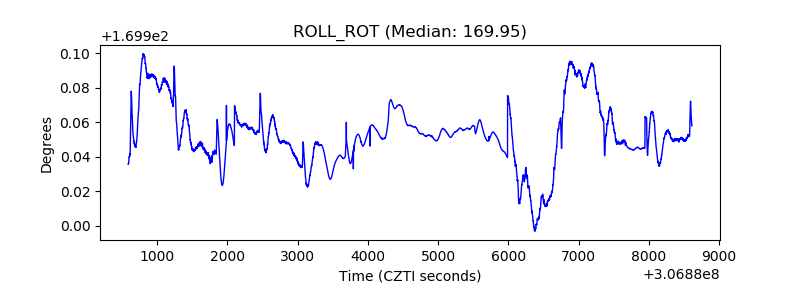 |
| _Roll_DEC | 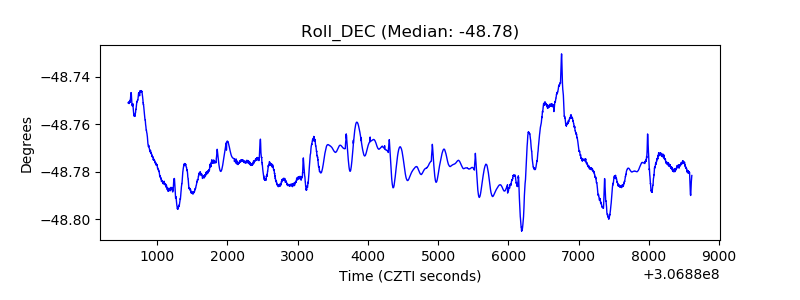 |
| _Roll_RA | 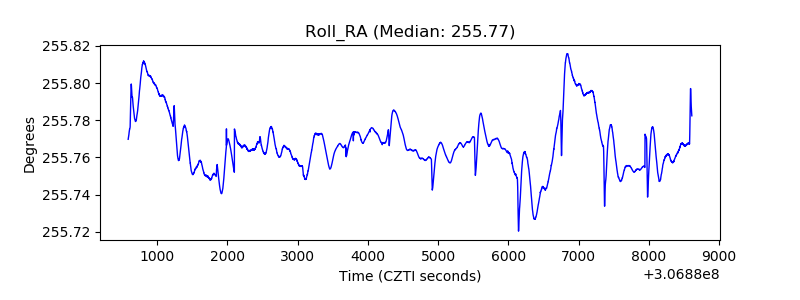 |
| Veto Counter | 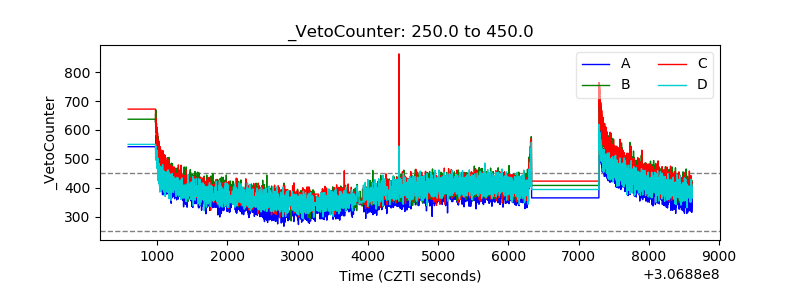 |