| Param | Original file | Final file |
|---|---|---|
| Filename | modeM0/AS1A05_166T01_9000003192_21548cztM0_level2.evt | modeM0/AS1A05_166T01_9000003192_21548cztM0_level2_quad_clean.evt |
| Size (bytes) | 782,596,800 | 134,562,240 |
| Size | 746.3 MB | 128.3 MB |
| Events in quadrant A | 5,122,732 | 838,974 |
| Events in quadrant B | 5,706,513 | 846,375 |
| Events in quadrant C | 6,526,413 | 822,218 |
| Events in quadrant D | 5,600,725 | 806,287 |
| Mode M0 | |||
|---|---|---|---|
| Quadrant | BADHDUFLAG | Total packets | Discarded packets |
| A | 0 | 22464 | 77 |
| B | 0 | 24145 | 66 |
| C | 0 | 26720 | 284 |
| D | 0 | 24174 | 92 |
| Mode M9 | |||
|---|---|---|---|
| Quadrant | BADHDUFLAG | Total packets | Discarded packets |
| A | 0 | 21 | 0 |
| B | 0 | 21 | 0 |
| C | 0 | 21 | 0 |
| D | 0 | 21 | 0 |
| Mode SS | |||
|---|---|---|---|
| Quadrant | BADHDUFLAG | Total packets | Discarded packets |
| A | 0 | 222 | 0 |
| B | 0 | 222 | 0 |
| C | 0 | 222 | 0 |
| D | 0 | 222 | 0 |
| Quadrant | Total seconds | Saturated seconds | Saturation percentage |
|---|---|---|---|
| A | 11006 | 43 | 0.390696% |
| B | 11010 | 111 | 1.008174% |
| C | 10999 | 261 | 2.372943% |
| D | 11007 | 92 | 0.835832% |
Noise dominated data is calculated using 1-second bins in cleaned event files. If a bin has >2000 counts, and if more than 50% of those come from <1% of pixels, then it is considered to be noise-dominated and hence unusable.
| Quadrant | # 1 sec bins | Bins with >0 counts | Bins with >2000 counts | High rate bins dominated by noise | Noise dominated (total time) | Noise dominated (detector-on time) | Marked lightcurve |
|---|---|---|---|---|---|---|---|
| A | 13069 | 11015 | 0 | 0 | 0.00% | 0.00% |  |
| B | 13066 | 11019 | 44 | 44 | 0.34% | 0.40% | 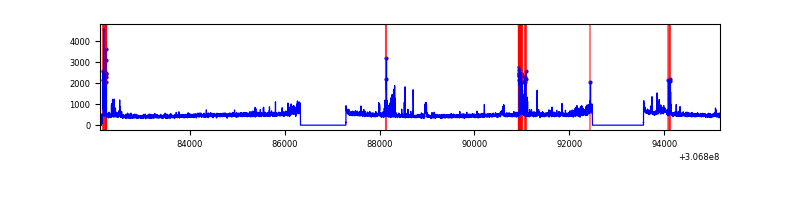 |
| C | 13047 | 11007 | 87 | 87 | 0.67% | 0.79% | 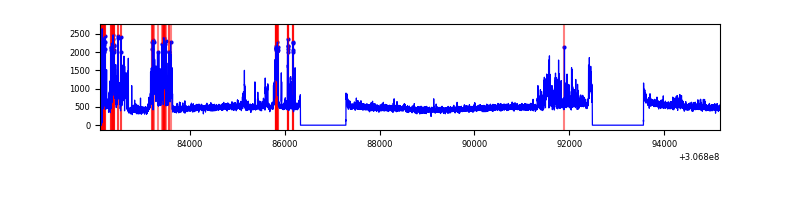 |
| D | 13074 | 11017 | 39 | 39 | 0.30% | 0.35% | 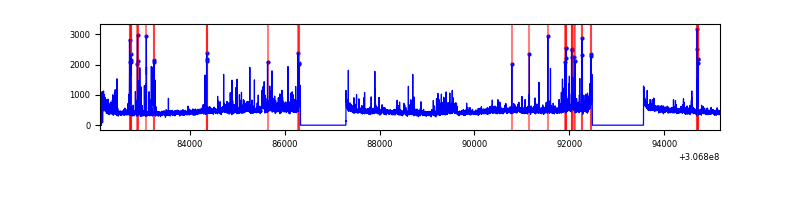 |
Top three noisy pixels from each quadrant. If the there are fewer than three noisy pixels in the level2.evt file, extra rows are filled as -1
| Pixel properties | Quadrant properties | ||||||
|---|---|---|---|---|---|---|---|
| Quadrant | DetID | PixID | Counts | Sigma | Mean | Median | Sigma |
| A | 13 | 254 | 16512 | 57.48 | 1328 | 1302 | 264.6 |
| A | 0 | 226 | 11286 | 37.73 | 1328 | 1302 | 264.6 |
| A | 3 | 137 | 10904 | 36.29 | 1328 | 1302 | 264.6 |
| B | 0 | 230 | 169319 | 679.21 | 1327 | 1293 | 247.4 |
| B | 4 | 171 | 115620 | 462.14 | 1327 | 1293 | 247.4 |
| B | 0 | 228 | 102592 | 409.48 | 1327 | 1293 | 247.4 |
| C | 3 | 233 | 1361332 | 4618.88 | 1273 | 1280 | 294.5 |
| C | 14 | 238 | 201292 | 679.26 | 1273 | 1280 | 294.5 |
| C | 13 | 61 | 8758 | 25.4 | 1273 | 1280 | 294.5 |
| D | 1 | 52 | 379436 | 1212.48 | 1286 | 1247 | 311.9 |
| D | 13 | 153 | 93542 | 295.9 | 1286 | 1247 | 311.9 |
| D | 14 | 35 | 81618 | 257.67 | 1286 | 1247 | 311.9 |
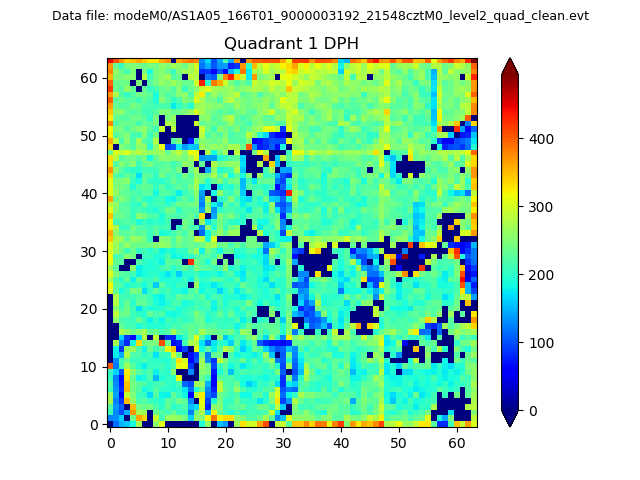
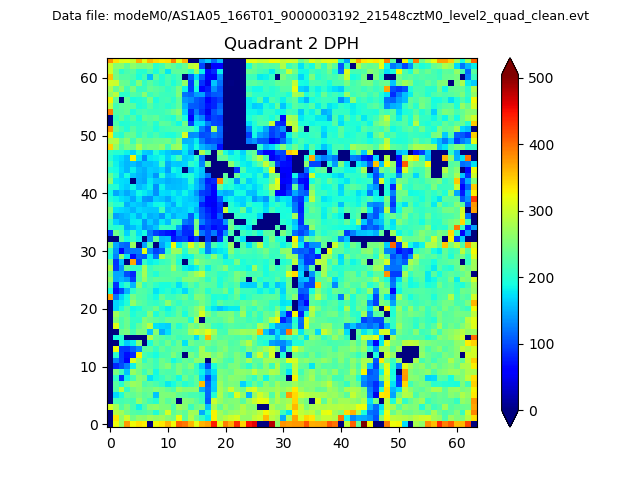
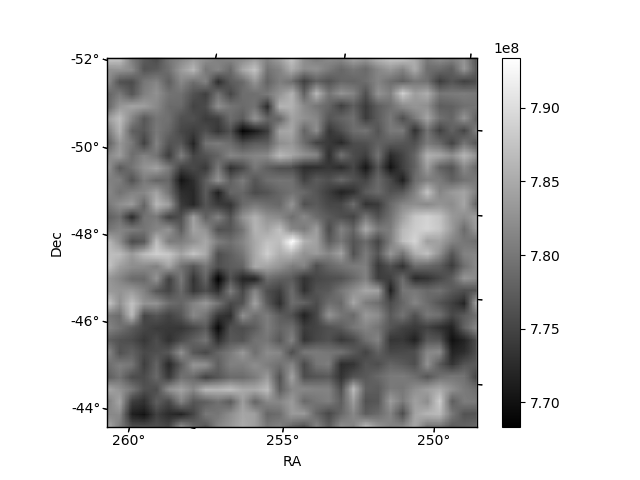
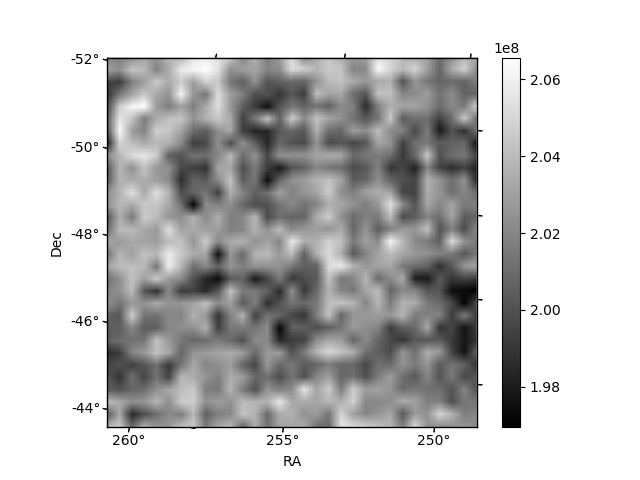
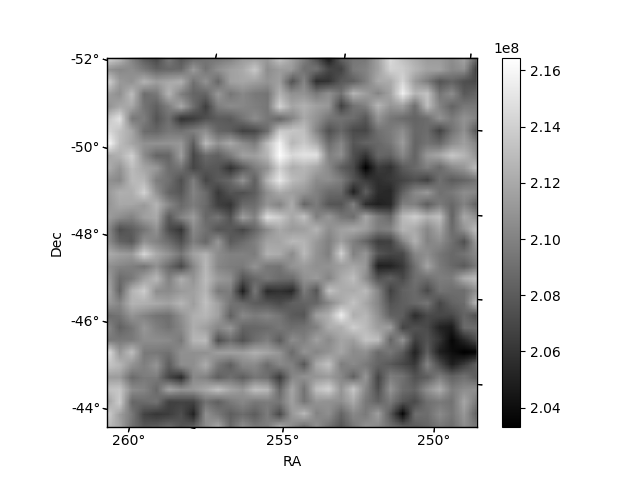
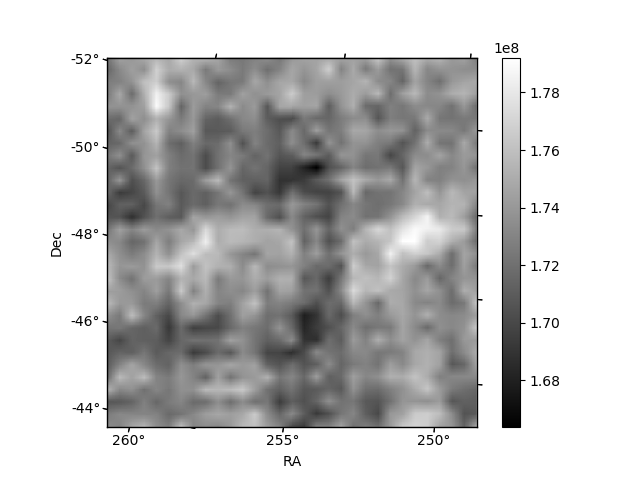
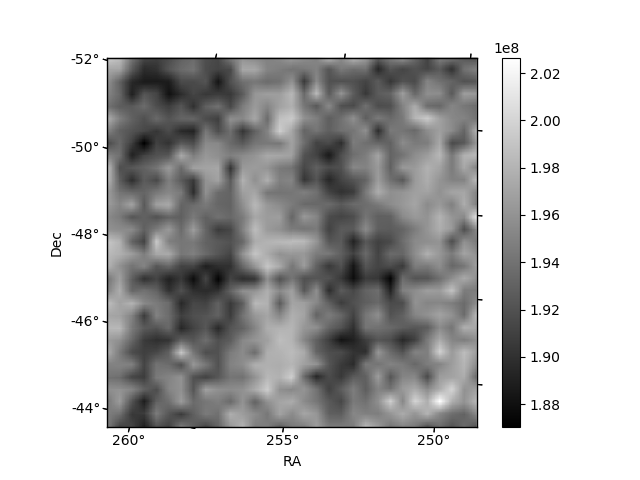
Histogram calculated using DETX and DETY for each event in the final _common_clean file
| Quadrant A | 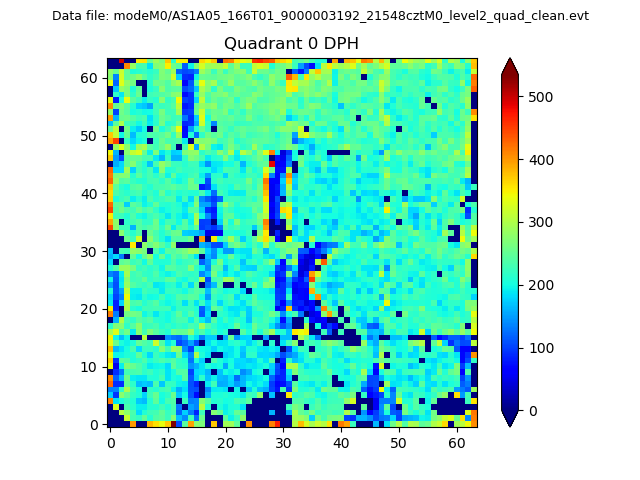 |
 |
Quadrant B |
|---|---|---|---|
| Quadrant D | 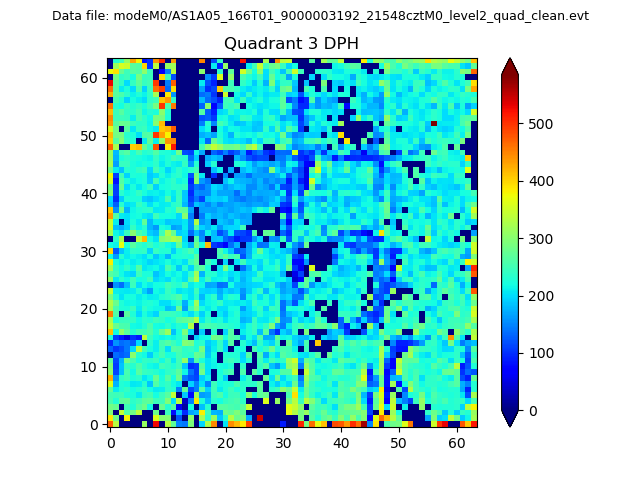 |
 |
Quadrant C |
| Plot type | Count rate plots | Images |
|---|---|---|
| Comparison with Poisson distribution Blue bars denote a histogram of data divided into 1 sec bins. Red curve is a Poisson curve with rate = median count rate of data. |
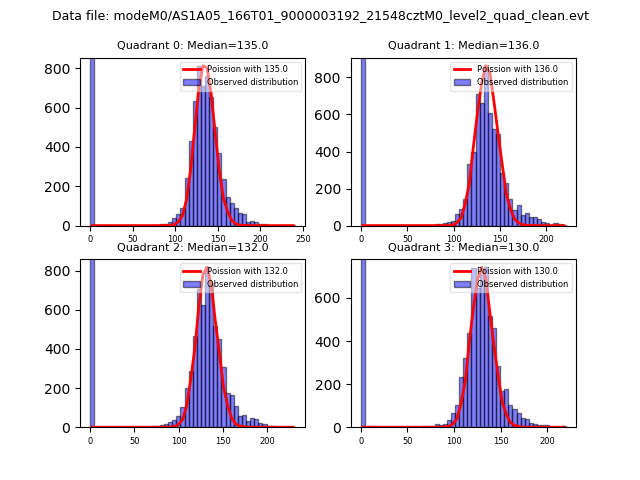 |
 |
| Quadrant-wise count rates Data is divided into 100 sec bins |
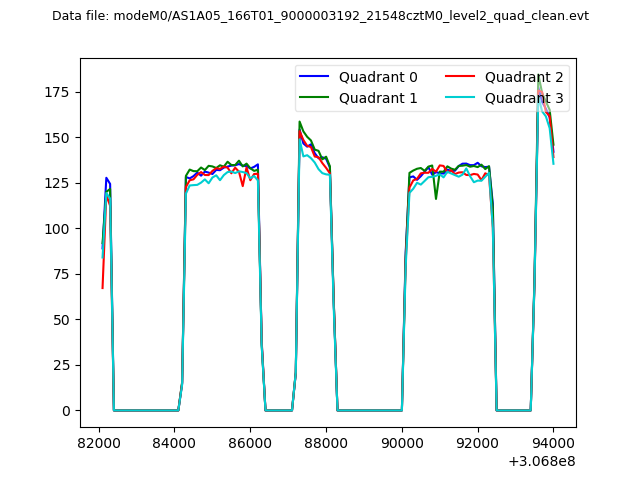 |
|
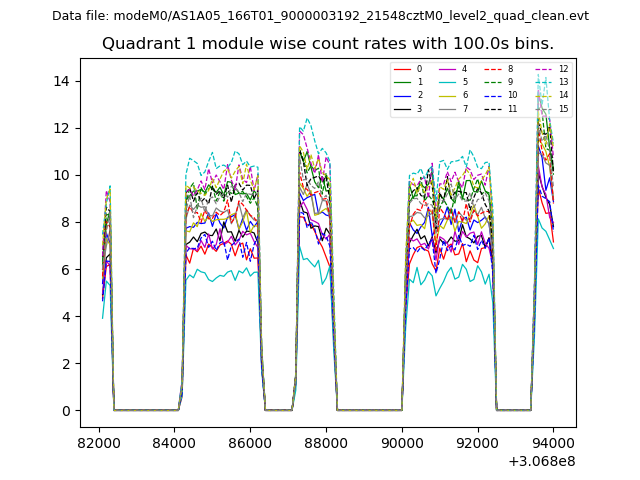
| Module-wise count rates for Quadrant A Data is divided into 100 sec bins |
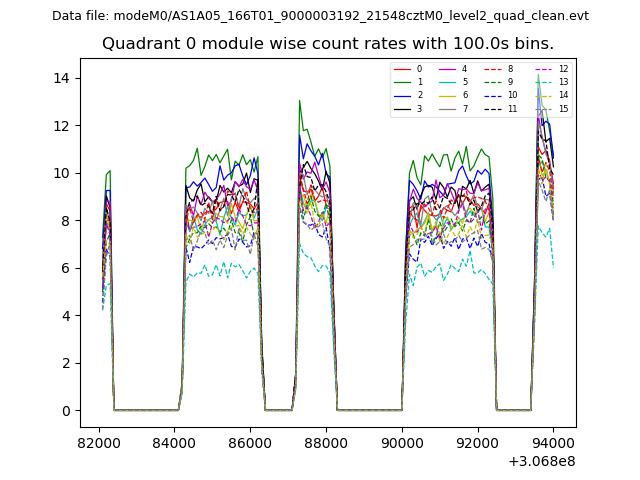 |
 |
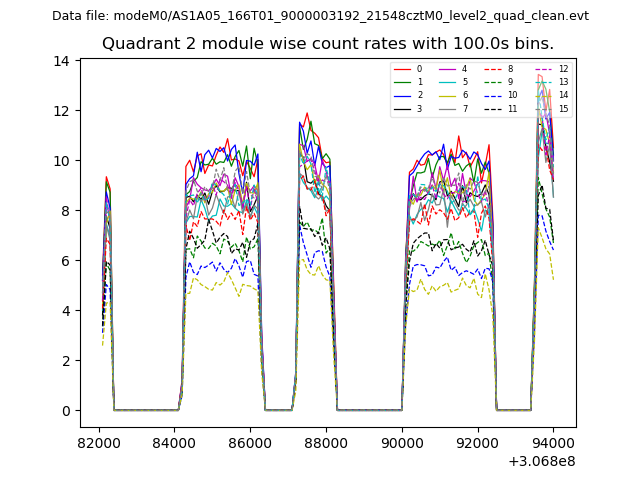
| Module-wise count rates for Quadrant B Data is divided into 100 sec bins |
 |
 |
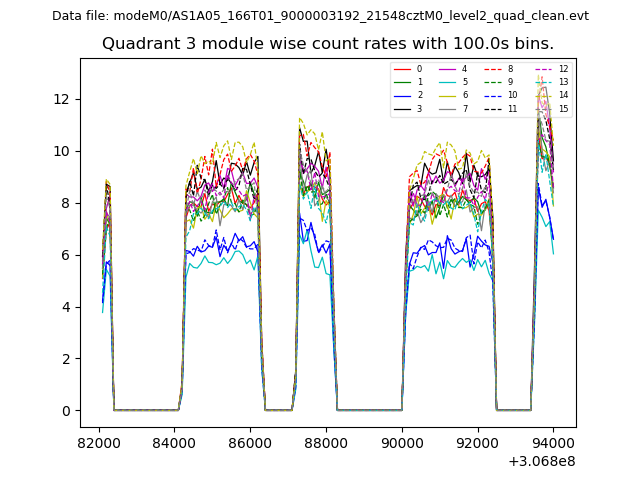
| Module-wise count rates for Quadrant C Data is divided into 100 sec bins |
 |
 |
| Module-wise count rates for Quadrant D Data is divided into 100 sec bins |
 |
 |
| Parameter | Plot |
|---|---|
| CZT HV Monitor | 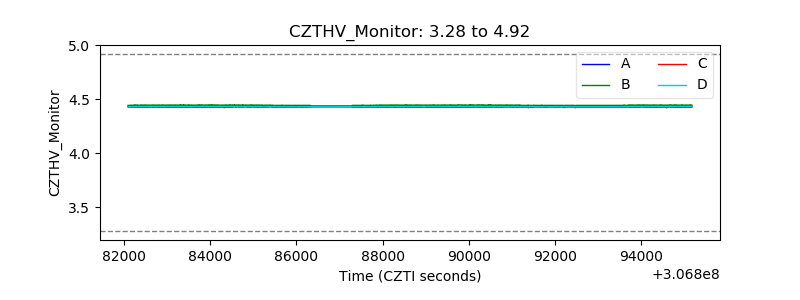 |
| D_VDD | 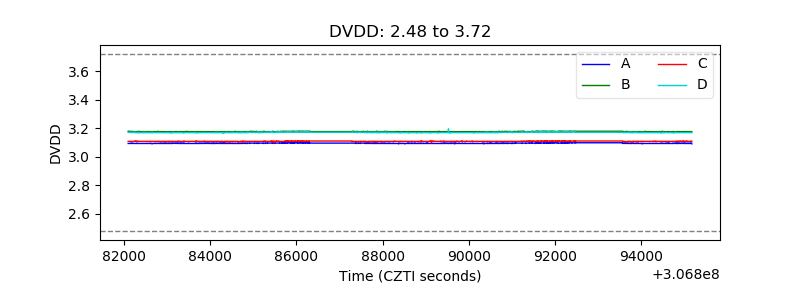 |
| Temperature 1 | 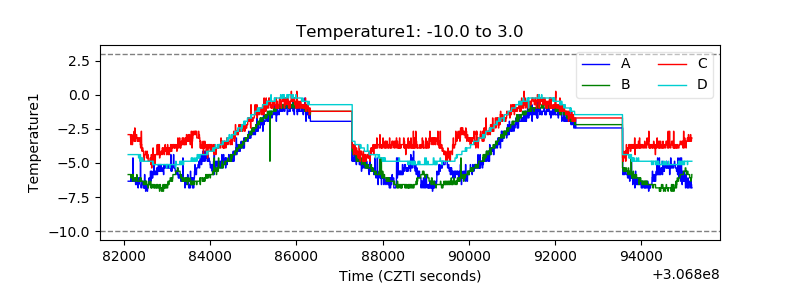 |
| Veto HV Monitor |  |
| Veto LLD | 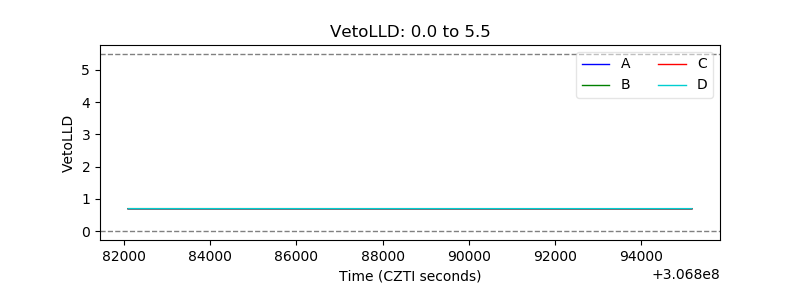 |
| Alpha Counter | 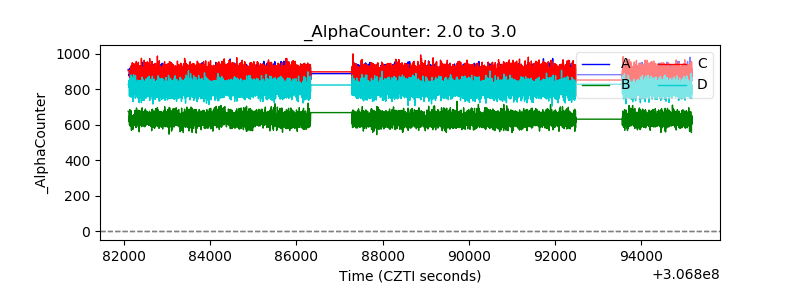 |
| _CPM_Rate | 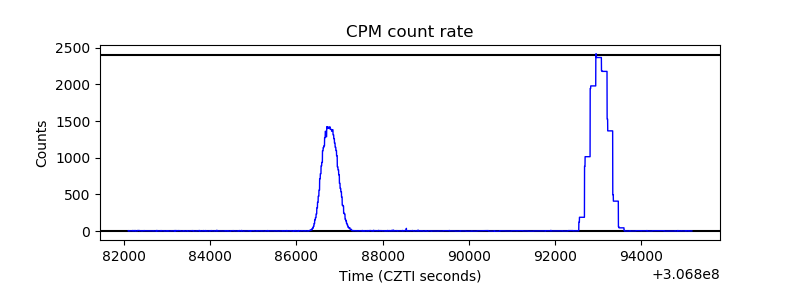 |
| CZT Counter | 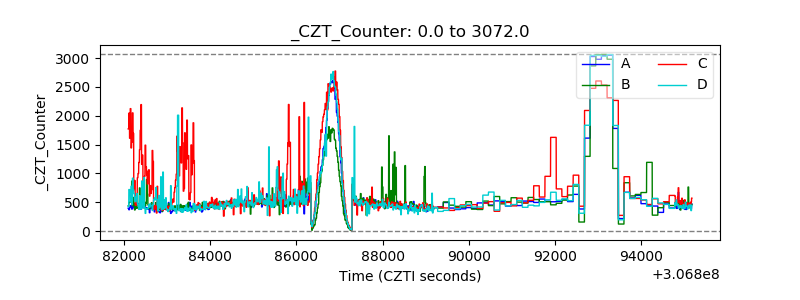 |
| +2.5 Volts monitor |  |
| +5 Volts monitor |  |
| _ROLL_ROT | 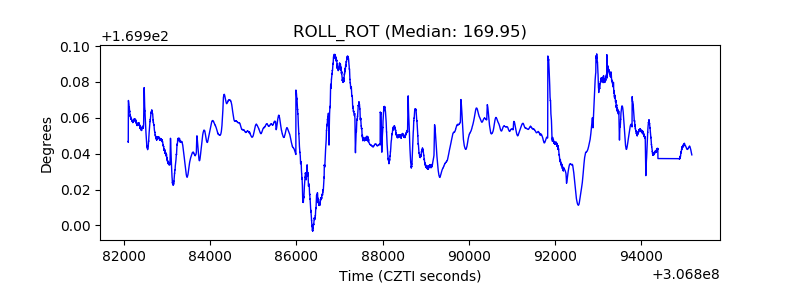 |
| _Roll_DEC | 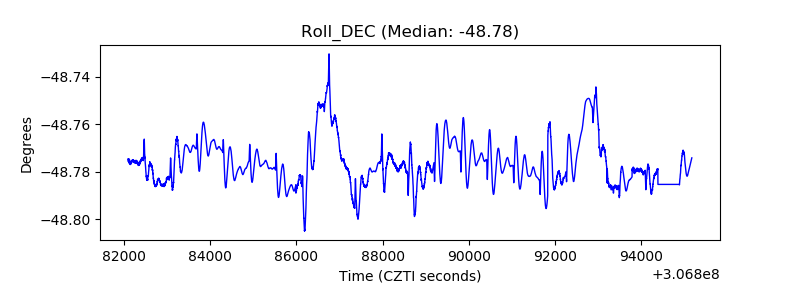 |
| _Roll_RA | 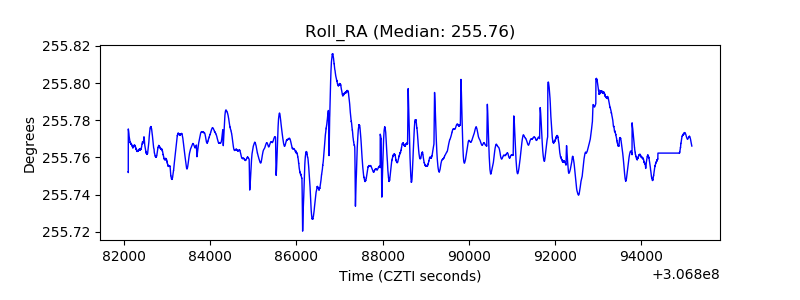 |
| Veto Counter | 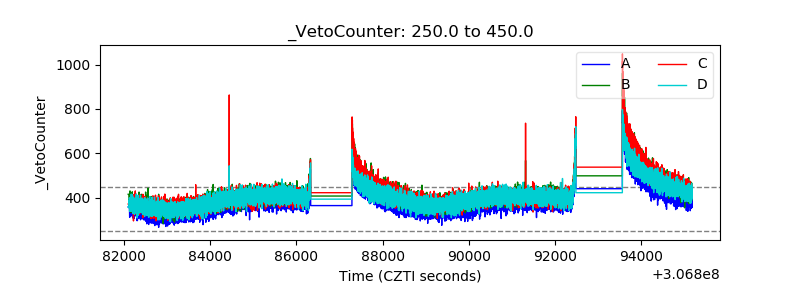 |