| Param | Original file | Final file |
|---|---|---|
| Filename | modeM0/AS1A05_166T01_9000003192_21551cztM0_level2.evt | modeM0/AS1A05_166T01_9000003192_21551cztM0_level2_quad_clean.evt |
| Size (bytes) | 484,899,840 | 72,512,640 |
| Size | 462.4 MB | 69.2 MB |
| Events in quadrant A | 3,369,512 | 442,200 |
| Events in quadrant B | 3,494,494 | 449,762 |
| Events in quadrant C | 3,427,267 | 442,421 |
| Events in quadrant D | 3,967,956 | 422,950 |
| Mode M0 | |||
|---|---|---|---|
| Quadrant | BADHDUFLAG | Total packets | Discarded packets |
| A | 0 | 13796 | 2 |
| B | 0 | 14248 | 2 |
| C | 0 | 14056 | 2 |
| D | 0 | 15914 | 2 |
| Mode M9 | |||
|---|---|---|---|
| Quadrant | BADHDUFLAG | Total packets | Discarded packets |
| A | 0 | 22 | 0 |
| B | 0 | 23 | 0 |
| C | 0 | 23 | 0 |
| D | 0 | 23 | 0 |
| Mode SS | |||
|---|---|---|---|
| Quadrant | BADHDUFLAG | Total packets | Discarded packets |
| A | 0 | 128 | 0 |
| B | 0 | 128 | 0 |
| C | 0 | 128 | 0 |
| D | 0 | 128 | 0 |
| Quadrant | Total seconds | Saturated seconds | Saturation percentage |
|---|---|---|---|
| A | 6278 | 39 | 0.621217% |
| B | 6278 | 67 | 1.067219% |
| C | 6278 | 94 | 1.497292% |
| D | 6278 | 86 | 1.369863% |
Noise dominated data is calculated using 1-second bins in cleaned event files. If a bin has >2000 counts, and if more than 50% of those come from <1% of pixels, then it is considered to be noise-dominated and hence unusable.
| Quadrant | # 1 sec bins | Bins with >0 counts | Bins with >2000 counts | High rate bins dominated by noise | Noise dominated (total time) | Noise dominated (detector-on time) | Marked lightcurve |
|---|---|---|---|---|---|---|---|
| A | 7598 | 6279 | 0 | 0 | 0.00% | 0.00% | 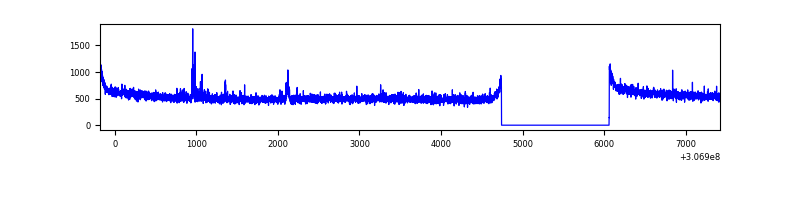 |
| B | 7598 | 6279 | 5 | 5 | 0.07% | 0.08% | 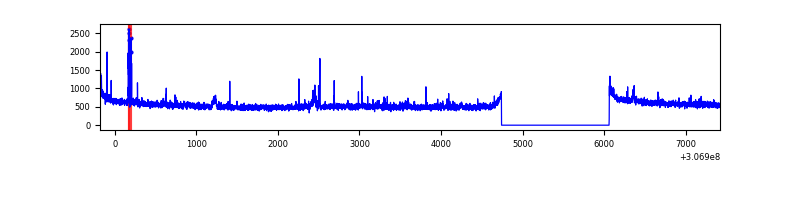 |
| C | 7598 | 6279 | 0 | 0 | 0.00% | 0.00% | 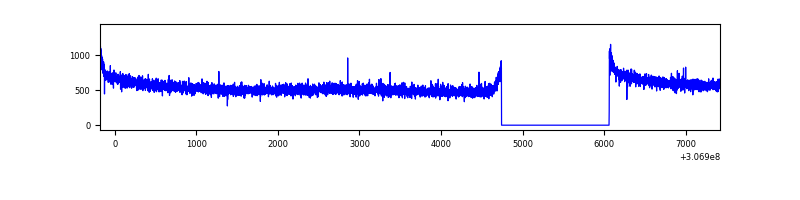 |
| D | 7598 | 6279 | 61 | 61 | 0.80% | 0.97% | 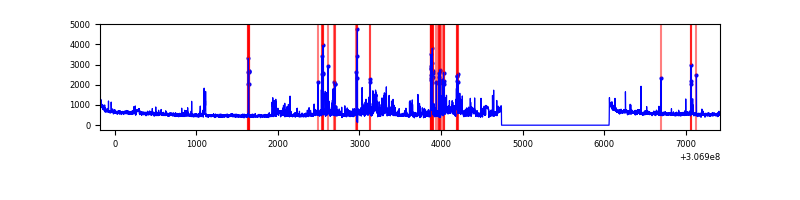 |
Top three noisy pixels from each quadrant. If the there are fewer than three noisy pixels in the level2.evt file, extra rows are filled as -1
| Pixel properties | Quadrant properties | ||||||
|---|---|---|---|---|---|---|---|
| Quadrant | DetID | PixID | Counts | Sigma | Mean | Median | Sigma |
| A | 4 | 2 | 41521 | 239.12 | 864 | 849 | 170.1 |
| A | 13 | 254 | 9667 | 51.84 | 864 | 849 | 170.1 |
| A | 0 | 226 | 7644 | 39.95 | 864 | 849 | 170.1 |
| B | 3 | 64 | 45990 | 287.21 | 863 | 846 | 157.2 |
| B | 0 | 230 | 35529 | 220.65 | 863 | 846 | 157.2 |
| B | 12 | 111 | 17989 | 109.06 | 863 | 846 | 157.2 |
| C | 14 | 238 | 137112 | 713.46 | 843 | 855 | 191.0 |
| C | 13 | 61 | 5910 | 26.47 | 843 | 855 | 191.0 |
| C | 3 | 233 | 4502 | 19.1 | 843 | 855 | 191.0 |
| D | 1 | 52 | 636762 | 3116.58 | 844 | 820 | 204.1 |
| D | 7 | 38 | 64768 | 313.39 | 844 | 820 | 204.1 |
| D | 14 | 35 | 30804 | 146.94 | 844 | 820 | 204.1 |
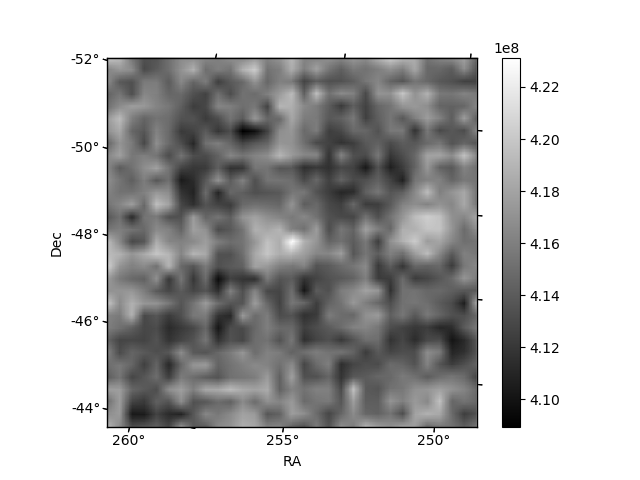
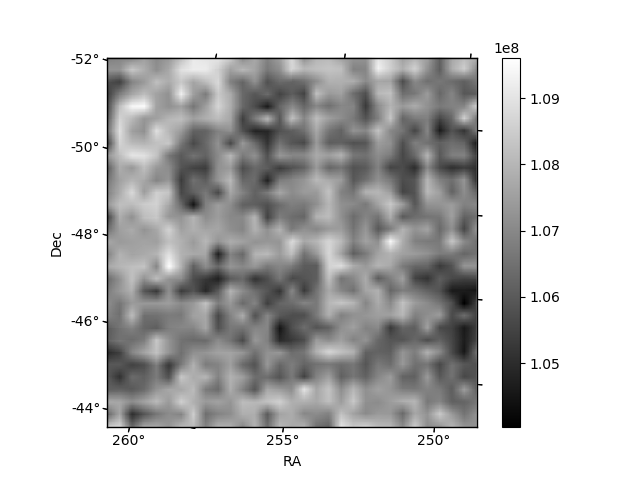
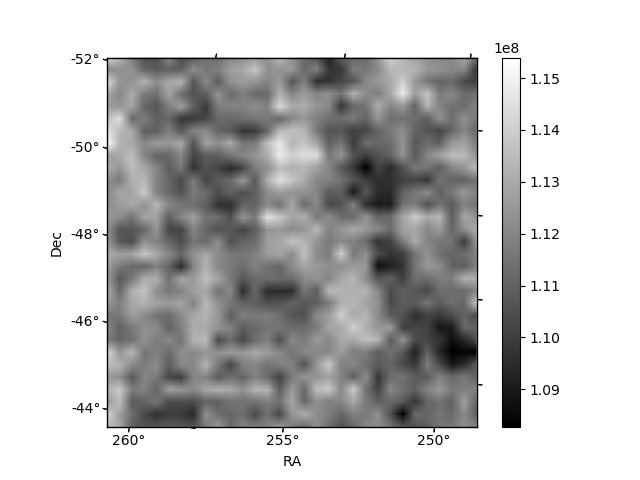
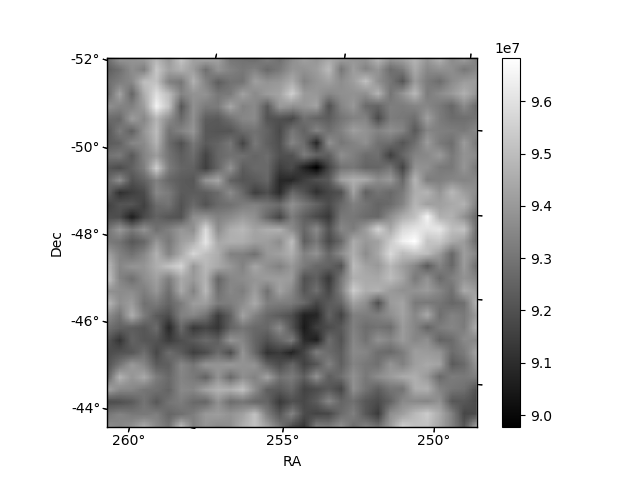
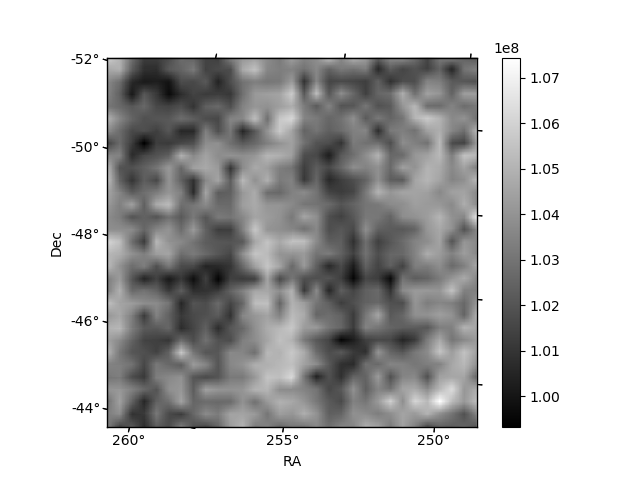
Histogram calculated using DETX and DETY for each event in the final _common_clean file
| Quadrant A | 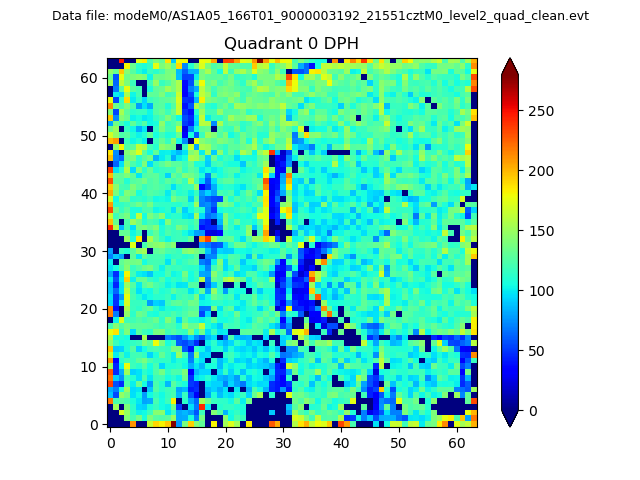 |
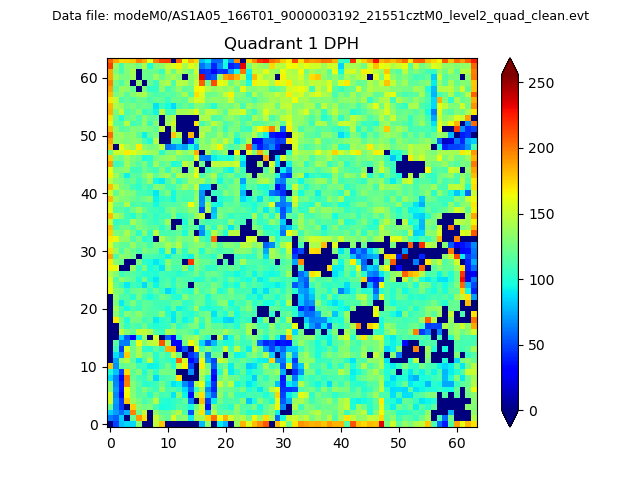 |
Quadrant B |
|---|---|---|---|
| Quadrant D |  |
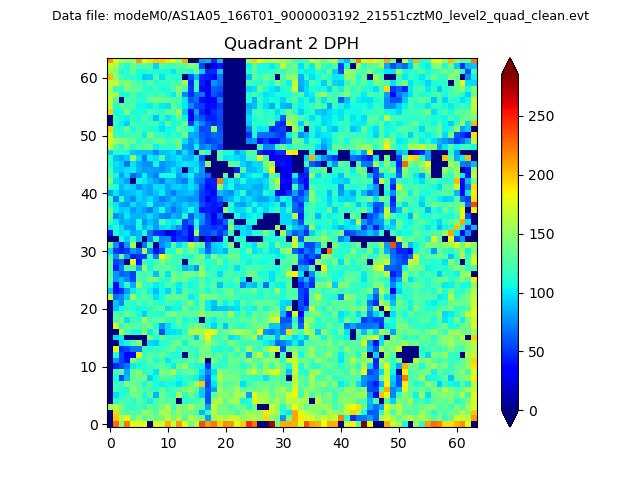 |
Quadrant C |
| Plot type | Count rate plots | Images |
|---|---|---|
| Comparison with Poisson distribution Blue bars denote a histogram of data divided into 1 sec bins. Red curve is a Poisson curve with rate = median count rate of data. |
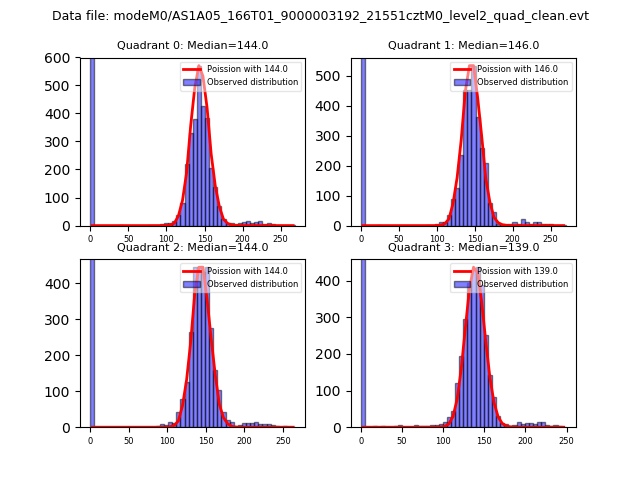 |
 |
| Quadrant-wise count rates Data is divided into 100 sec bins |
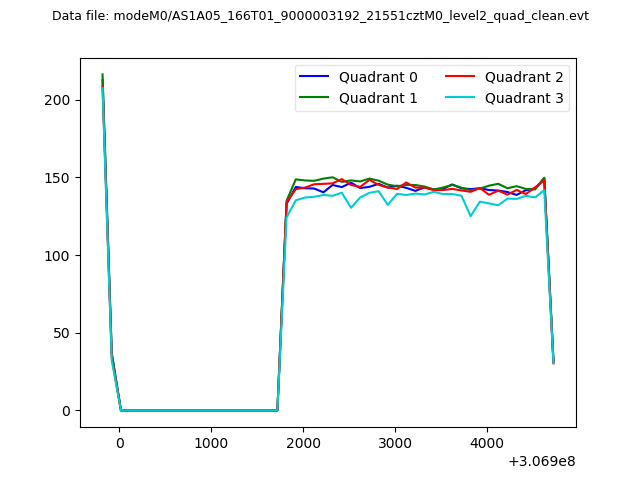 |
|
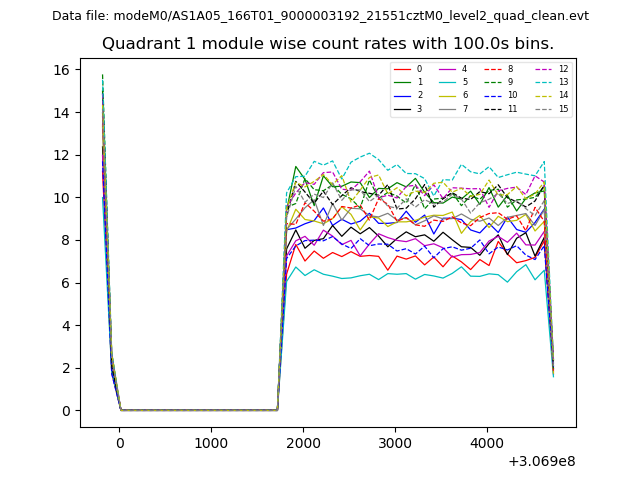
| Module-wise count rates for Quadrant A Data is divided into 100 sec bins |
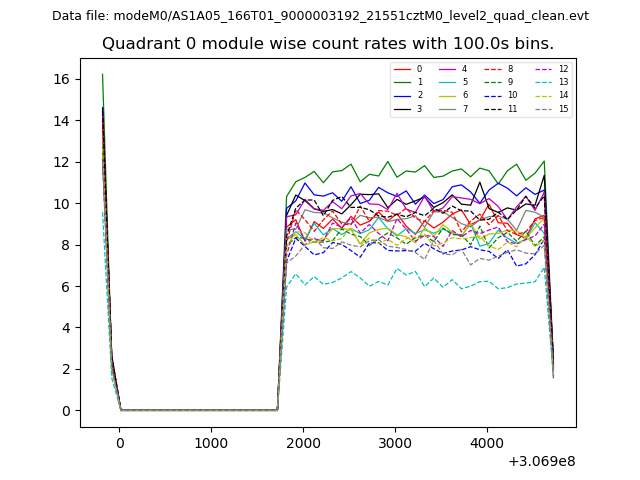 |
 |
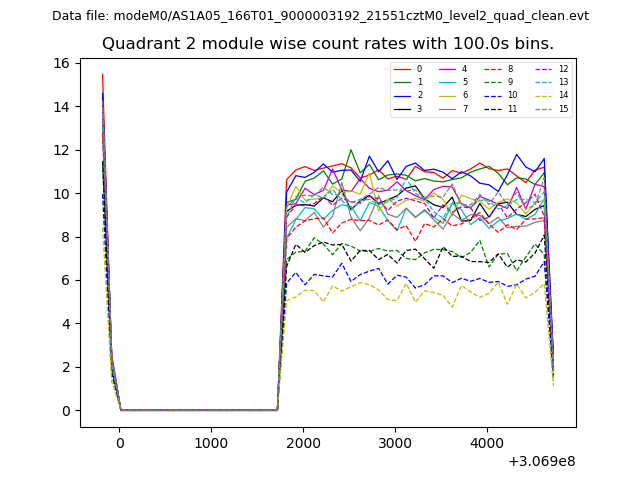
| Module-wise count rates for Quadrant B Data is divided into 100 sec bins |
 |
 |
| Module-wise count rates for Quadrant C Data is divided into 100 sec bins |
 |
 |
| Module-wise count rates for Quadrant D Data is divided into 100 sec bins |
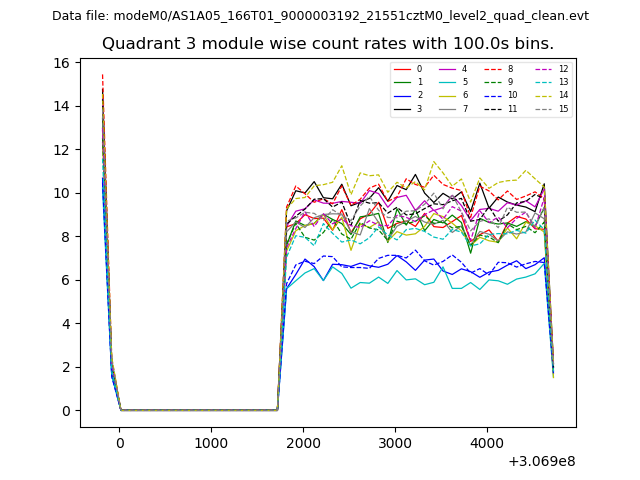 |
 |
| Parameter | Plot |
|---|---|
| CZT HV Monitor | 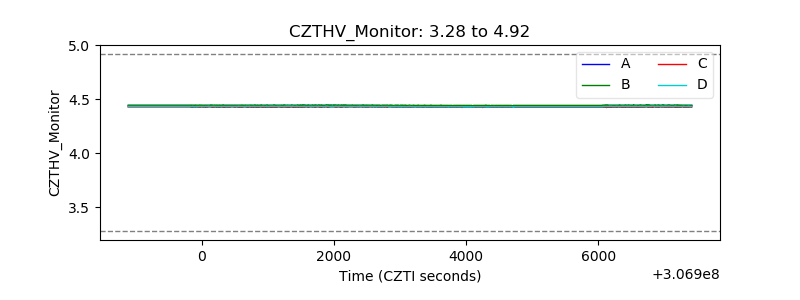 |
| D_VDD | 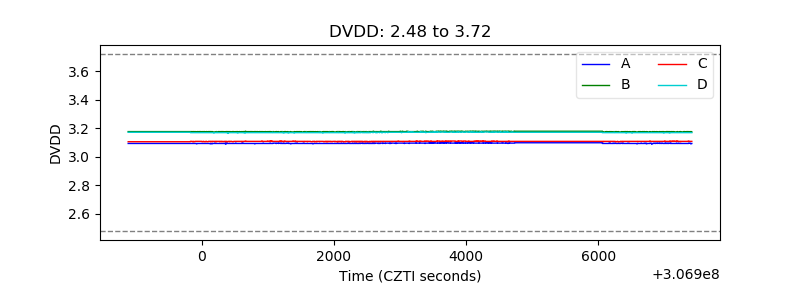 |
| Temperature 1 |  |
| Veto HV Monitor | 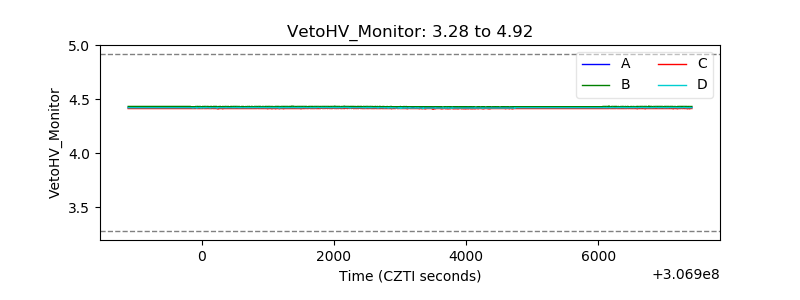 |
| Veto LLD | 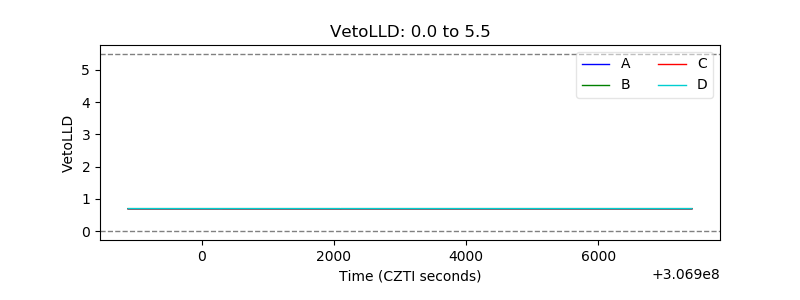 |
| Alpha Counter | 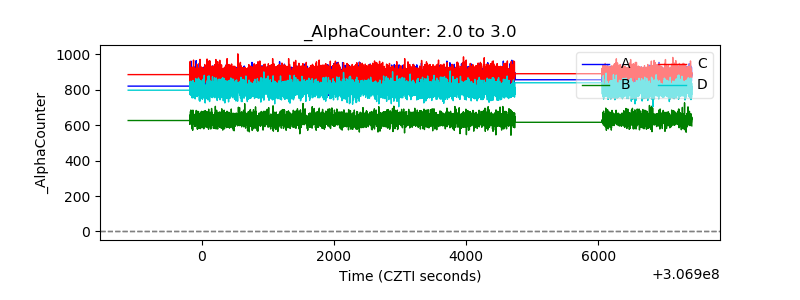 |
| _CPM_Rate | 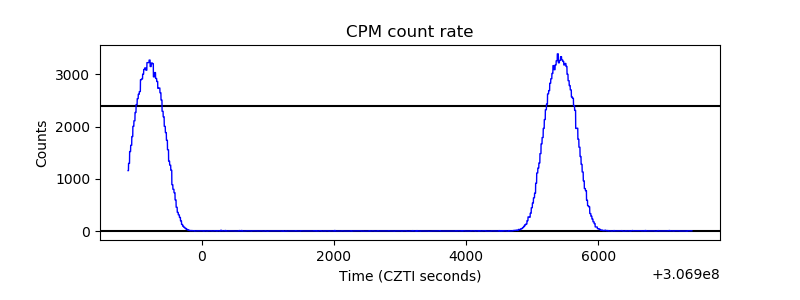 |
| CZT Counter | 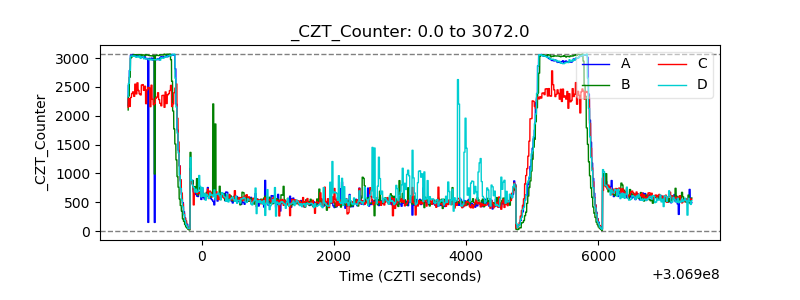 |
| +2.5 Volts monitor | 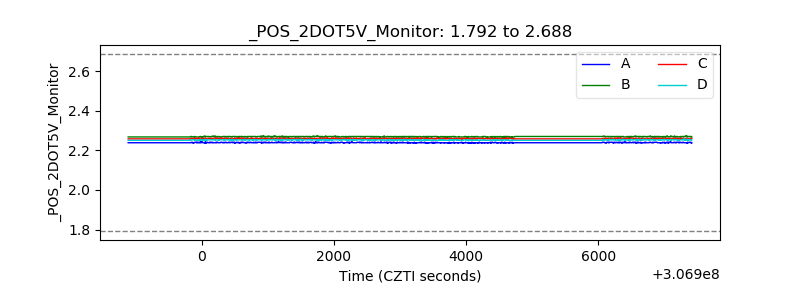 |
| +5 Volts monitor | 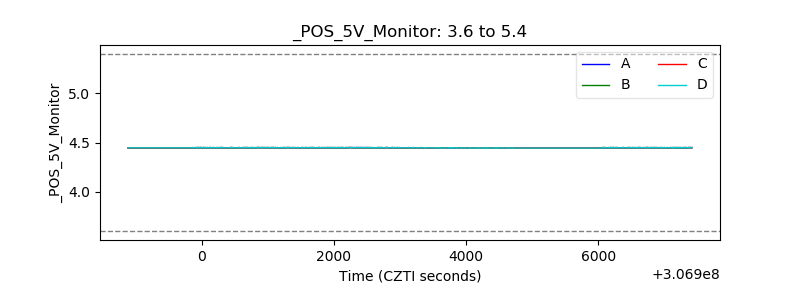 |
| _ROLL_ROT | 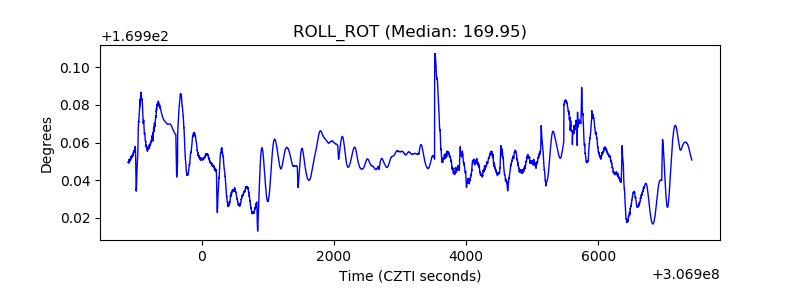 |
| _Roll_DEC | 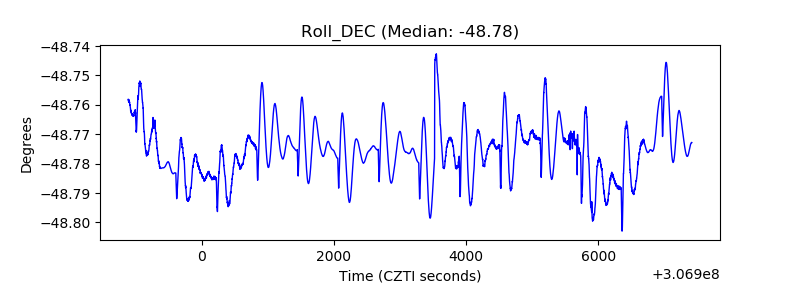 |
| _Roll_RA | 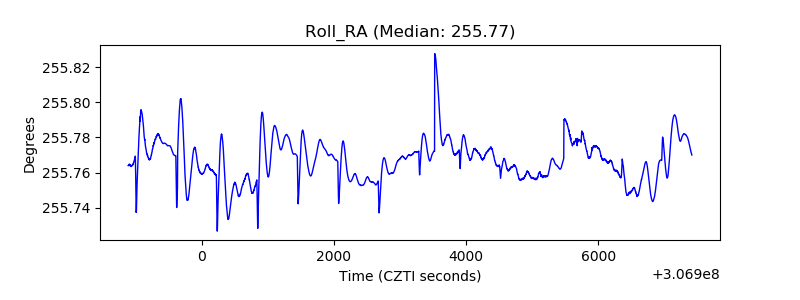 |
| Veto Counter | 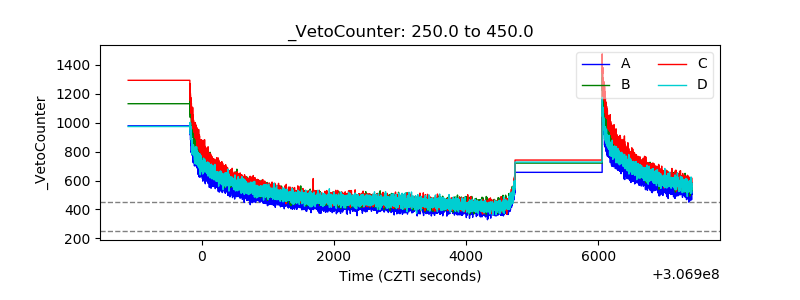 |