| Param | Original file | Final file |
|---|---|---|
| Filename | modeM0/AS1A05_166T01_9000003192_21553cztM0_level2.evt | modeM0/AS1A05_166T01_9000003192_21553cztM0_level2_quad_clean.evt |
| Size (bytes) | 508,608,000 | 99,466,560 |
| Size | 485.0 MB | 94.9 MB |
| Events in quadrant A | 3,285,968 | 655,670 |
| Events in quadrant B | 3,477,980 | 662,993 |
| Events in quadrant C | 3,405,779 | 651,264 |
| Events in quadrant D | 4,822,993 | 619,636 |
| Mode M0 | |||
|---|---|---|---|
| Quadrant | BADHDUFLAG | Total packets | Discarded packets |
| A | 0 | 13312 | 1 |
| B | 0 | 14002 | 1 |
| C | 0 | 14049 | 1 |
| D | 0 | 18285 | 1 |
| Mode M9 | |||
|---|---|---|---|
| Quadrant | BADHDUFLAG | Total packets | Discarded packets |
| A | 0 | 13 | 0 |
| B | 0 | 13 | 0 |
| C | 0 | 13 | 0 |
| D | 0 | 13 | 0 |
| Mode SS | |||
|---|---|---|---|
| Quadrant | BADHDUFLAG | Total packets | Discarded packets |
| A | 0 | 124 | 0 |
| B | 0 | 124 | 0 |
| C | 0 | 124 | 0 |
| D | 0 | 124 | 0 |
| Quadrant | Total seconds | Saturated seconds | Saturation percentage |
|---|---|---|---|
| A | 6051 | 103 | 1.702198% |
| B | 6052 | 136 | 2.247191% |
| C | 6052 | 164 | 2.709848% |
| D | 6052 | 320 | 5.287508% |
Noise dominated data is calculated using 1-second bins in cleaned event files. If a bin has >2000 counts, and if more than 50% of those come from <1% of pixels, then it is considered to be noise-dominated and hence unusable.
| Quadrant | # 1 sec bins | Bins with >0 counts | Bins with >2000 counts | High rate bins dominated by noise | Noise dominated (total time) | Noise dominated (detector-on time) | Marked lightcurve |
|---|---|---|---|---|---|---|---|
| A | 7386 | 6052 | 0 | 0 | 0.00% | 0.00% | 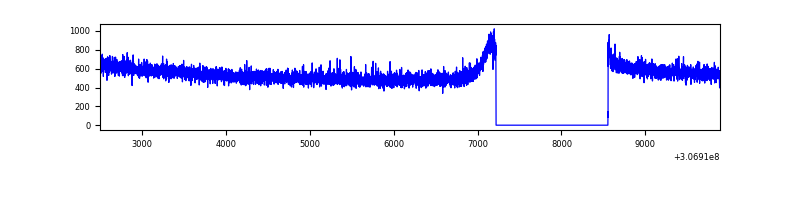 |
| B | 7387 | 6053 | 7 | 7 | 0.09% | 0.12% | 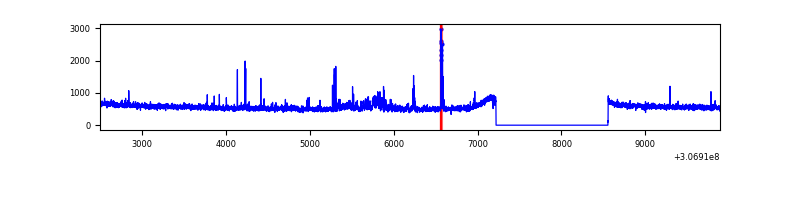 |
| C | 7387 | 6053 | 0 | 0 | 0.00% | 0.00% | 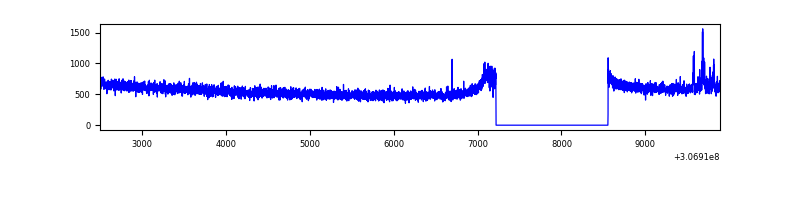 |
| D | 7387 | 6053 | 161 | 161 | 2.18% | 2.66% | 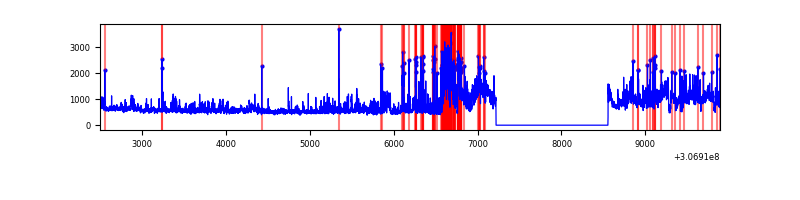 |
Top three noisy pixels from each quadrant. If the there are fewer than three noisy pixels in the level2.evt file, extra rows are filled as -1
| Pixel properties | Quadrant properties | ||||||
|---|---|---|---|---|---|---|---|
| Quadrant | DetID | PixID | Counts | Sigma | Mean | Median | Sigma |
| A | 13 | 254 | 9452 | 51.68 | 853 | 837 | 166.7 |
| A | 0 | 226 | 7411 | 39.44 | 853 | 837 | 166.7 |
| A | 3 | 137 | 6258 | 32.52 | 853 | 837 | 166.7 |
| B | 3 | 64 | 55082 | 350.7 | 846 | 831 | 154.7 |
| B | 0 | 228 | 50947 | 323.97 | 846 | 831 | 154.7 |
| B | 0 | 190 | 34256 | 216.07 | 846 | 831 | 154.7 |
| C | 14 | 238 | 135890 | 720.31 | 825 | 836 | 187.5 |
| C | 3 | 233 | 53719 | 282.05 | 825 | 836 | 187.5 |
| C | 13 | 61 | 5927 | 27.15 | 825 | 836 | 187.5 |
| D | 1 | 52 | 1030828 | 5213.88 | 832 | 811 | 197.6 |
| D | 2 | 136 | 322412 | 1627.92 | 832 | 811 | 197.6 |
| D | 7 | 223 | 86630 | 434.41 | 832 | 811 | 197.6 |
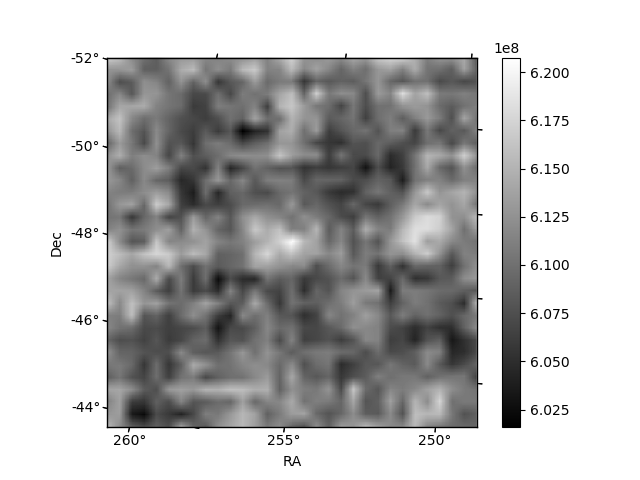
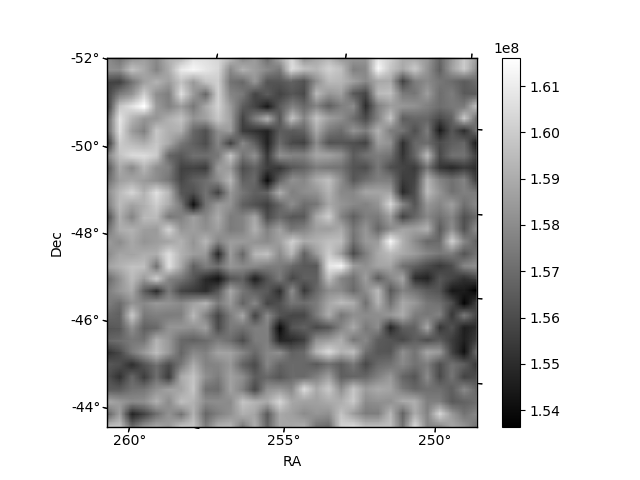
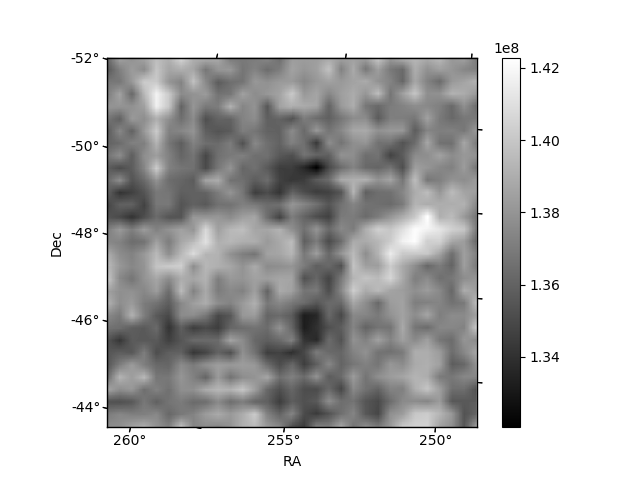
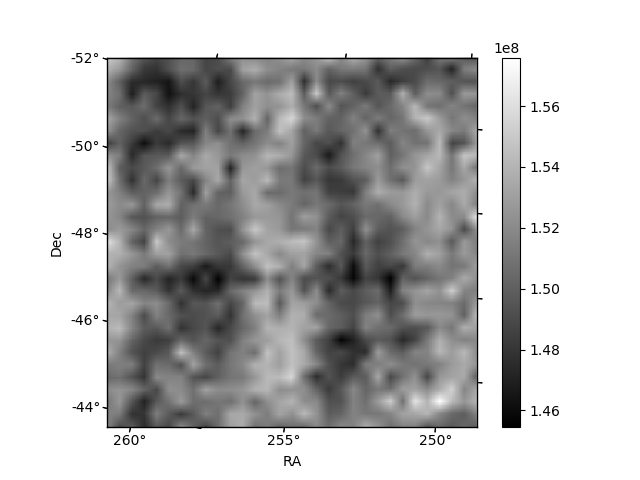
Histogram calculated using DETX and DETY for each event in the final _common_clean file
| Quadrant A | 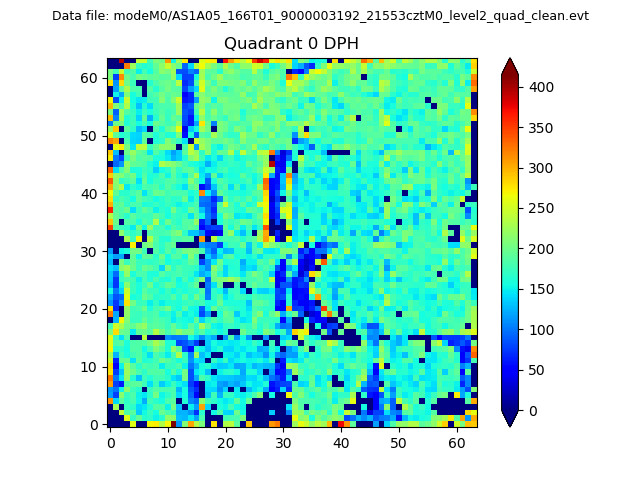 |
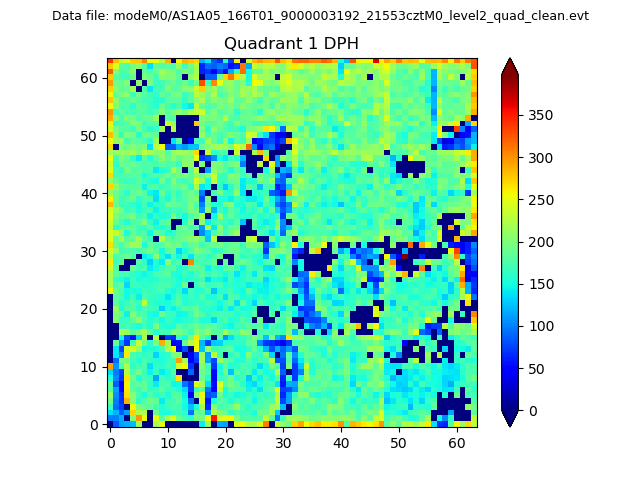 |
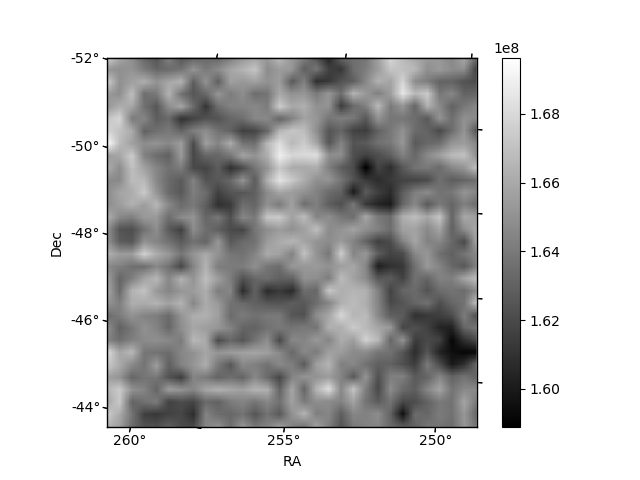
Quadrant B |
|---|---|---|---|
| Quadrant D | 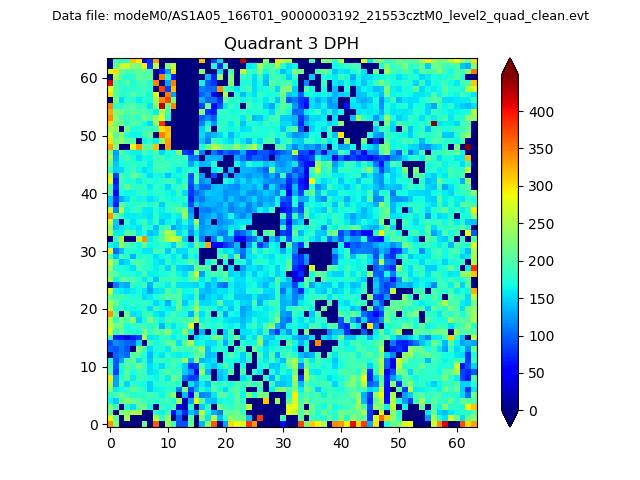 |
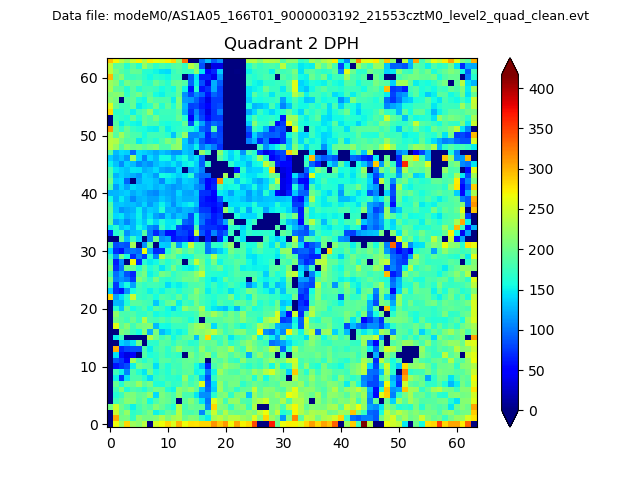 |
Quadrant C |
| Plot type | Count rate plots | Images |
|---|---|---|
| Comparison with Poisson distribution Blue bars denote a histogram of data divided into 1 sec bins. Red curve is a Poisson curve with rate = median count rate of data. |
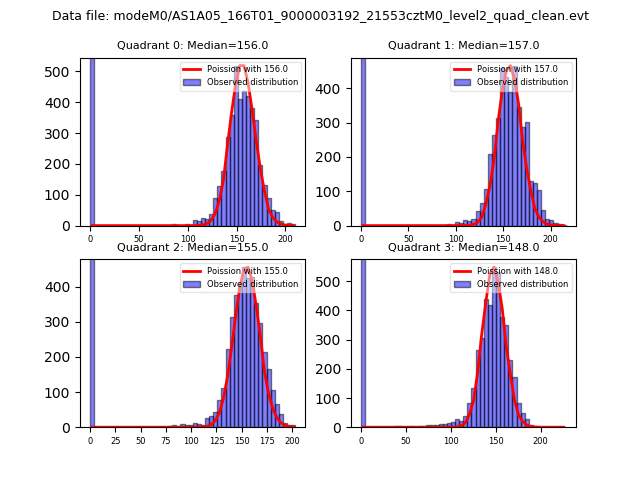 |
 |
| Quadrant-wise count rates Data is divided into 100 sec bins |
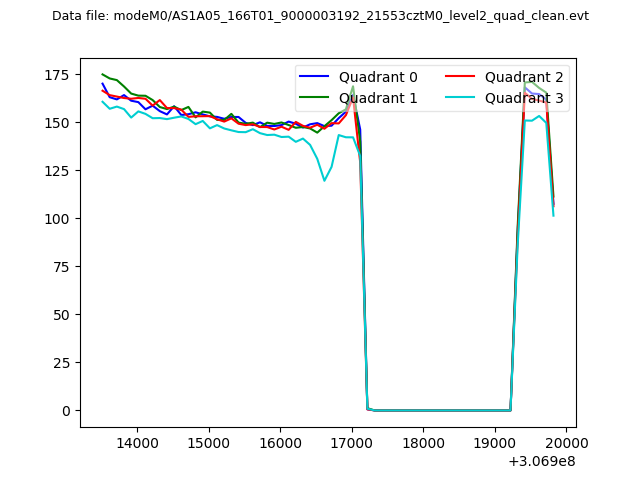 |
|
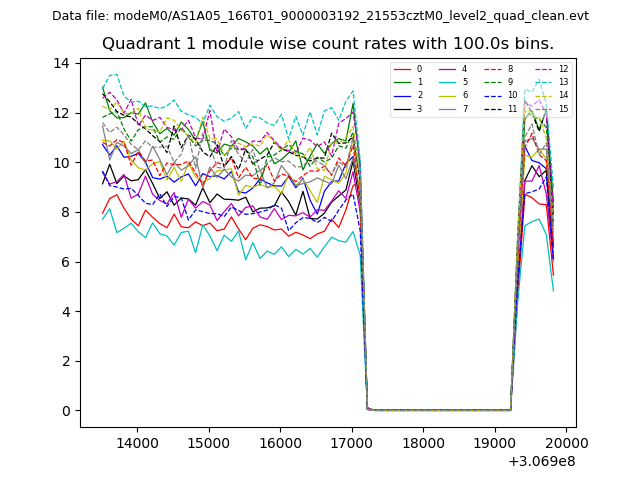
| Module-wise count rates for Quadrant A Data is divided into 100 sec bins |
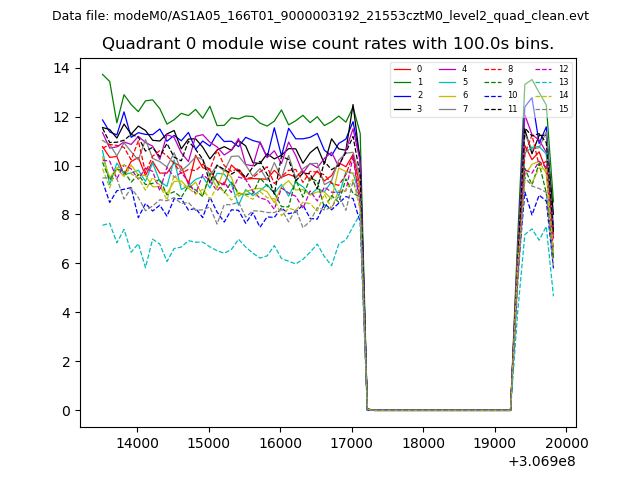 |
 |
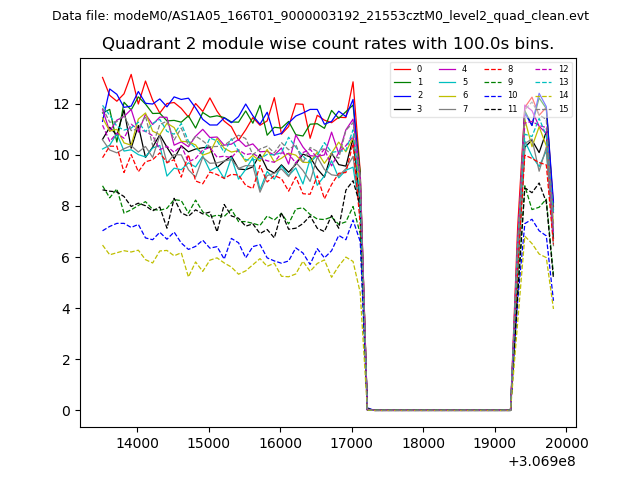
| Module-wise count rates for Quadrant B Data is divided into 100 sec bins |
 |
 |
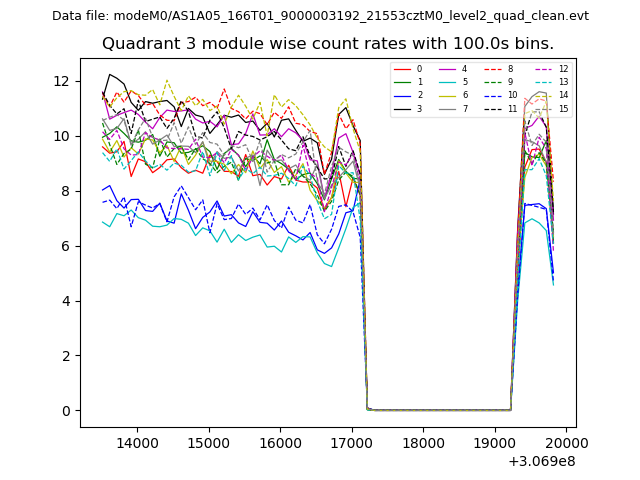
| Module-wise count rates for Quadrant C Data is divided into 100 sec bins |
 |
 |
| Module-wise count rates for Quadrant D Data is divided into 100 sec bins |
 |
 |
| Parameter | Plot |
|---|---|
| CZT HV Monitor | 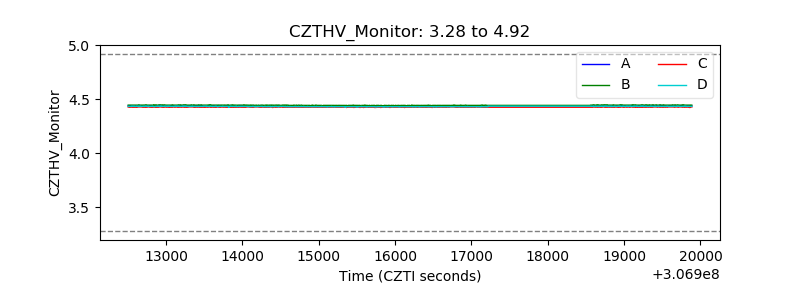 |
| D_VDD | 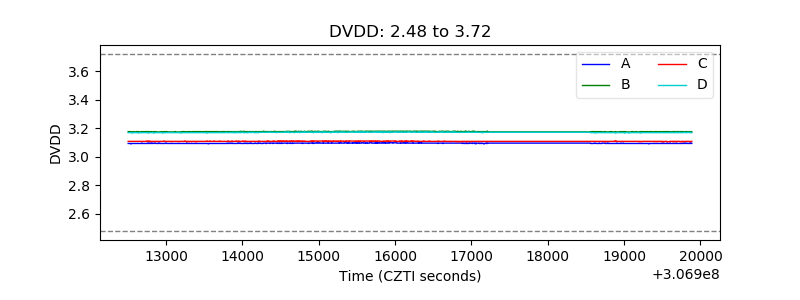 |
| Temperature 1 | 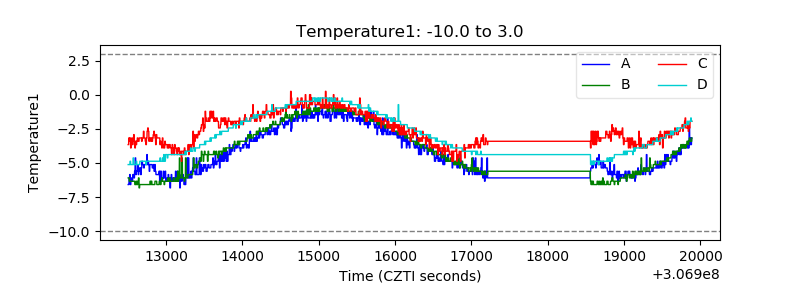 |
| Veto HV Monitor | 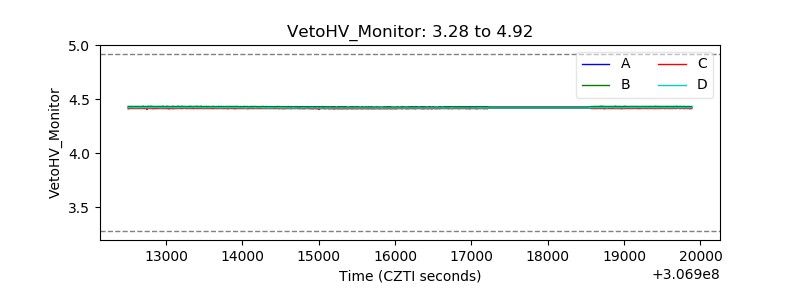 |
| Veto LLD | 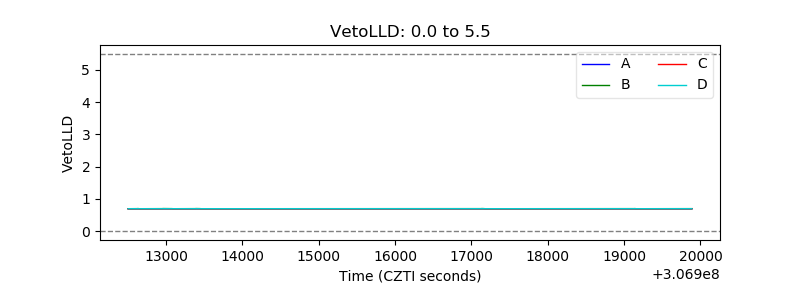 |
| Alpha Counter | 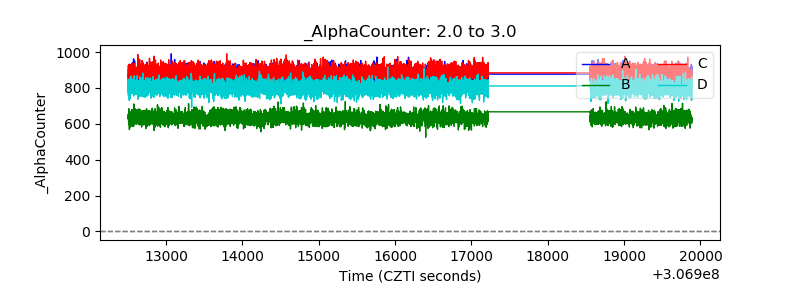 |
| _CPM_Rate | 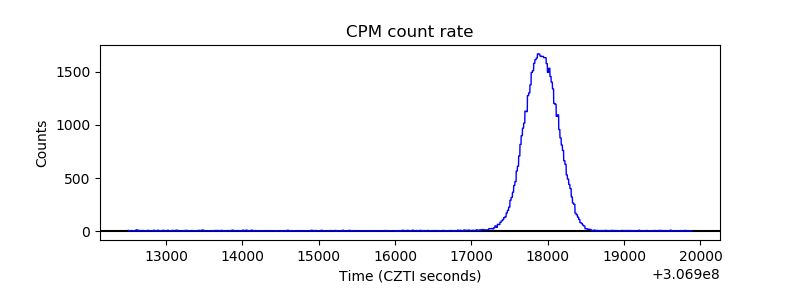 |
| CZT Counter | 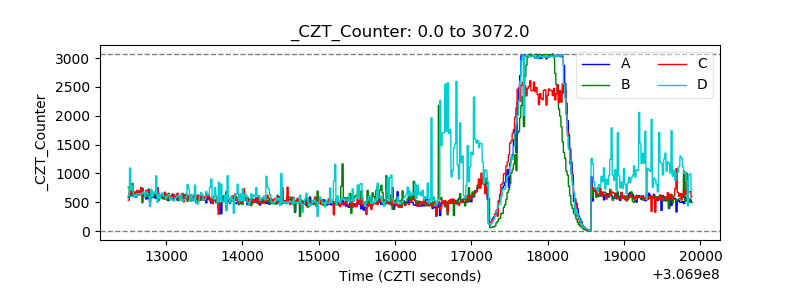 |
| +2.5 Volts monitor | 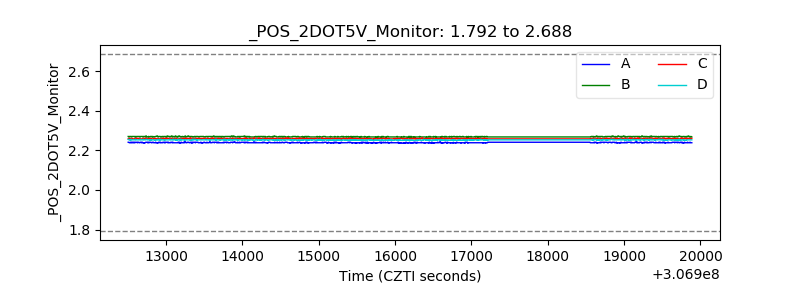 |
| +5 Volts monitor |  |
| _ROLL_ROT | 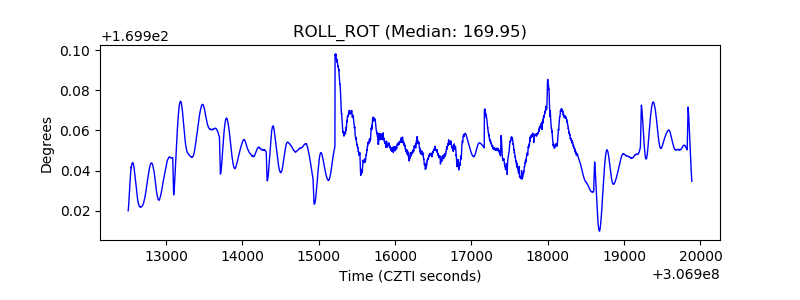 |
| _Roll_DEC | 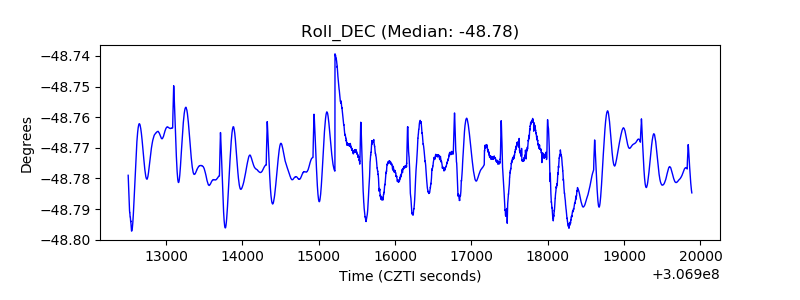 |
| _Roll_RA | 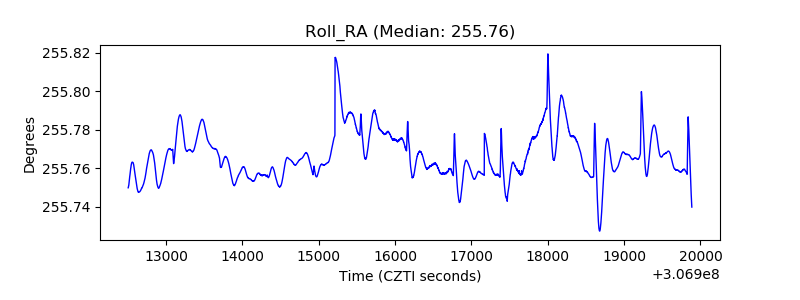 |
| Veto Counter | 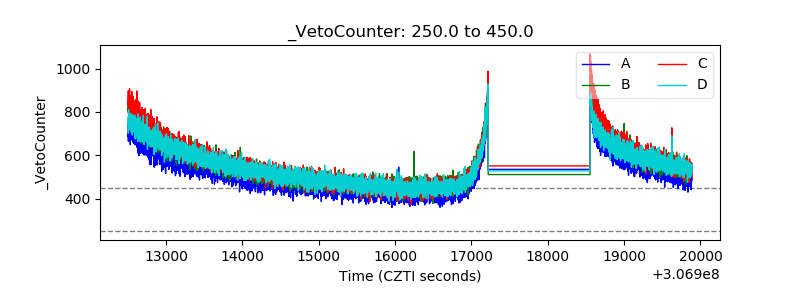 |