| Param | Original file | Final file |
|---|---|---|
| Filename | modeM0/AS1A05_166T01_9000003192_21555cztM0_level2.evt | modeM0/AS1A05_166T01_9000003192_21555cztM0_level2_quad_clean.evt |
| Size (bytes) | 359,717,760 | 81,244,800 |
| Size | 343.1 MB | 77.5 MB |
| Events in quadrant A | 2,229,994 | 547,285 |
| Events in quadrant B | 2,379,654 | 549,838 |
| Events in quadrant C | 2,372,669 | 537,515 |
| Events in quadrant D | 3,606,032 | 509,784 |
| Mode M0 | |||
|---|---|---|---|
| Quadrant | BADHDUFLAG | Total packets | Discarded packets |
| A | 0 | 10406 | 1233 |
| B | 0 | 10940 | 1330 |
| C | 0 | 10949 | 1271 |
| D | 0 | 15759 | 1982 |
| Mode SS | |||
|---|---|---|---|
| Quadrant | BADHDUFLAG | Total packets | Discarded packets |
| A | 0 | 104 | 14 |
| B | 0 | 101 | 13 |
| C | 0 | 103 | 13 |
| D | 0 | 101 | 11 |
| Quadrant | Total seconds | Saturated seconds | Saturation percentage |
|---|---|---|---|
| A | 4499 | 4 | 0.088909% |
| B | 4498 | 9 | 0.200089% |
| C | 4495 | 37 | 0.823137% |
| D | 4484 | 147 | 3.278323% |
Noise dominated data is calculated using 1-second bins in cleaned event files. If a bin has >2000 counts, and if more than 50% of those come from <1% of pixels, then it is considered to be noise-dominated and hence unusable.
| Quadrant | # 1 sec bins | Bins with >0 counts | Bins with >2000 counts | High rate bins dominated by noise | Noise dominated (total time) | Noise dominated (detector-on time) | Marked lightcurve |
|---|---|---|---|---|---|---|---|
| A | 7164 | 4563 | 0 | 0 | 0.00% | 0.00% | 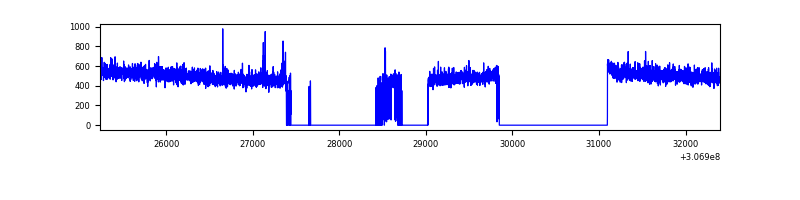 |
| B | 7164 | 4555 | 1 | 1 | 0.01% | 0.02% | 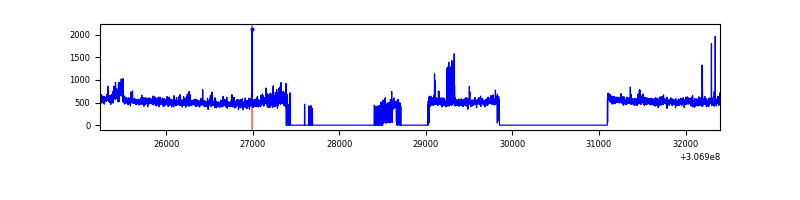 |
| C | 7164 | 4573 | 0 | 0 | 0.00% | 0.00% | 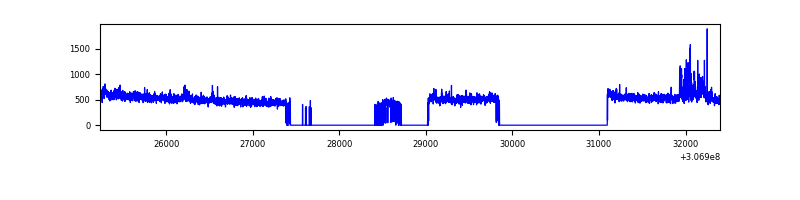 |
| D | 7163 | 4542 | 141 | 141 | 1.97% | 3.10% | 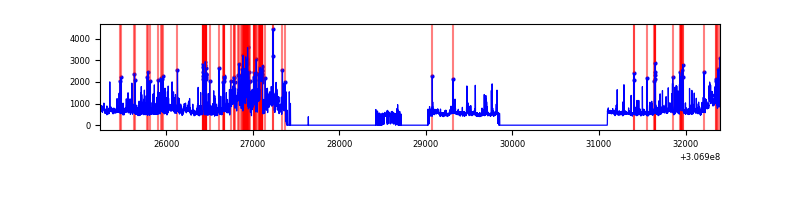 |
Top three noisy pixels from each quadrant. If the there are fewer than three noisy pixels in the level2.evt file, extra rows are filled as -1
| Pixel properties | Quadrant properties | ||||||
|---|---|---|---|---|---|---|---|
| Quadrant | DetID | PixID | Counts | Sigma | Mean | Median | Sigma |
| A | 4 | 2 | 9258 | 74.99 | 576 | 564 | 115.9 |
| A | 13 | 254 | 7130 | 56.63 | 576 | 564 | 115.9 |
| A | 0 | 226 | 4976 | 38.05 | 576 | 564 | 115.9 |
| B | 0 | 230 | 76199 | 707.93 | 567 | 554 | 106.9 |
| B | 0 | 228 | 43983 | 406.43 | 567 | 554 | 106.9 |
| B | 0 | 190 | 16023 | 144.77 | 567 | 554 | 106.9 |
| C | 3 | 233 | 136555 | 1062.44 | 551 | 555 | 128.0 |
| C | 14 | 238 | 87429 | 678.66 | 551 | 555 | 128.0 |
| C | 13 | 61 | 3876 | 25.94 | 551 | 555 | 128.0 |
| D | 1 | 52 | 1129458 | 8406.67 | 556 | 541 | 134.3 |
| D | 2 | 136 | 156672 | 1162.66 | 556 | 541 | 134.3 |
| D | 14 | 35 | 78669 | 581.79 | 556 | 541 | 134.3 |
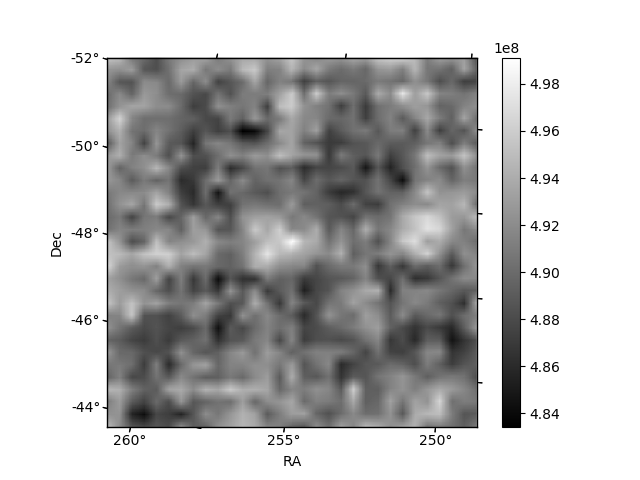
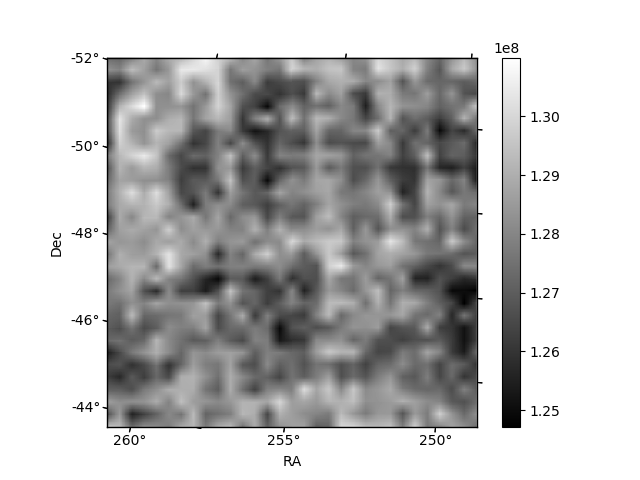
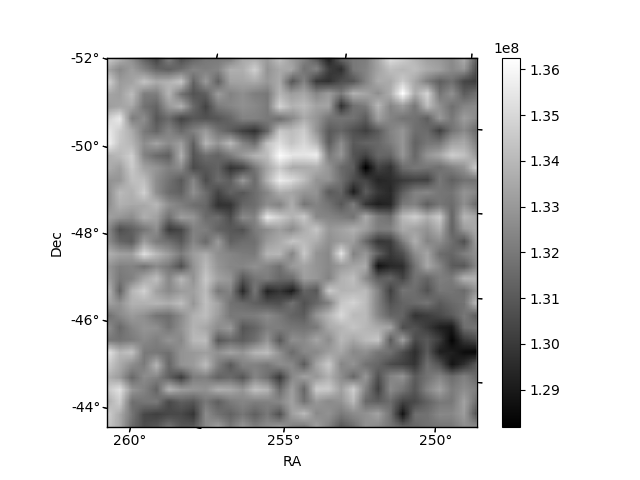
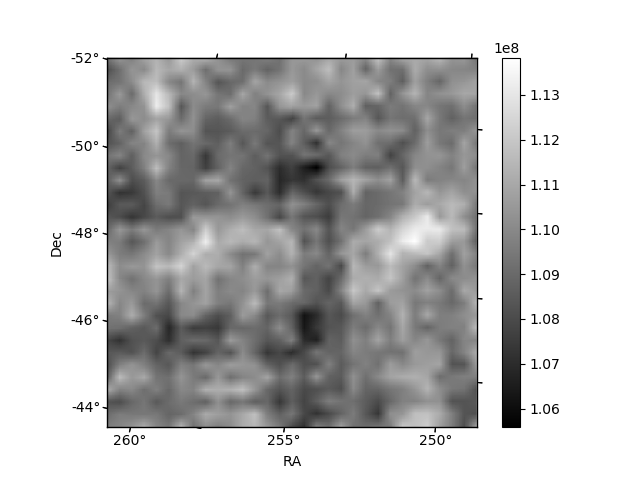
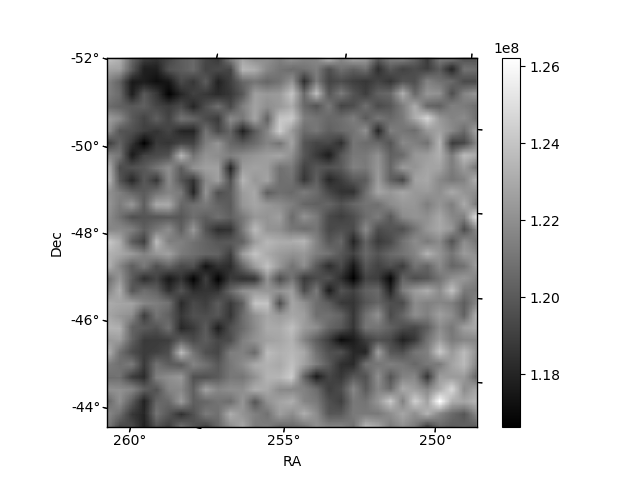
Histogram calculated using DETX and DETY for each event in the final _common_clean file
| Quadrant A | 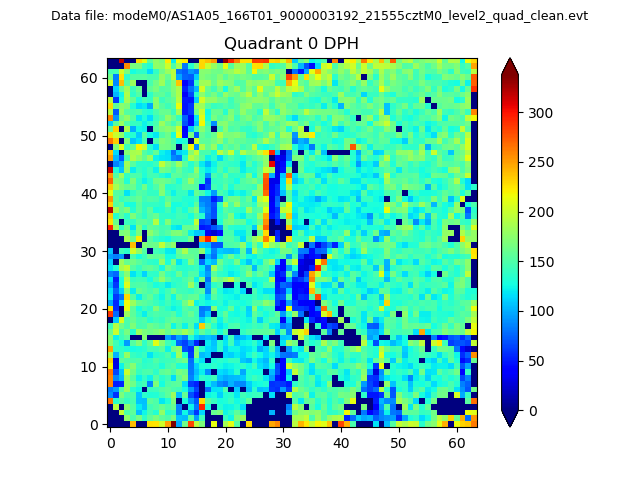 |
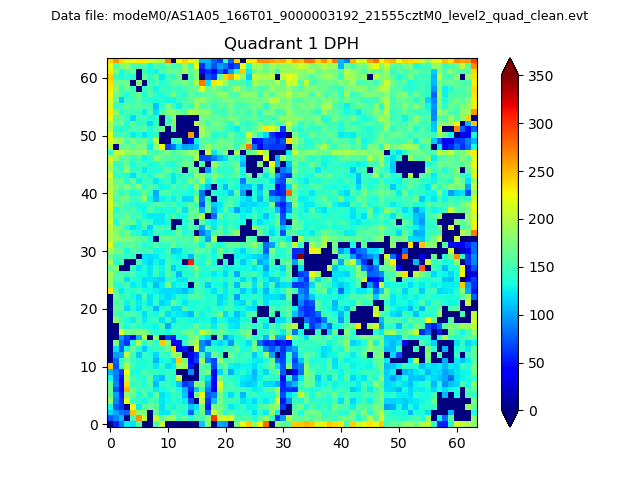 |
Quadrant B |
|---|---|---|---|
| Quadrant D | 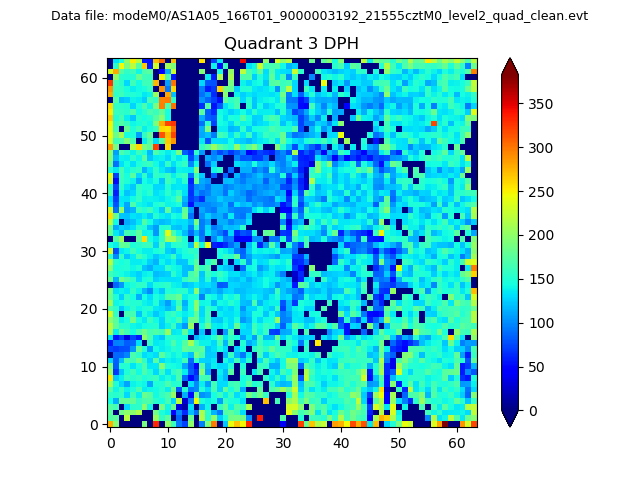 |
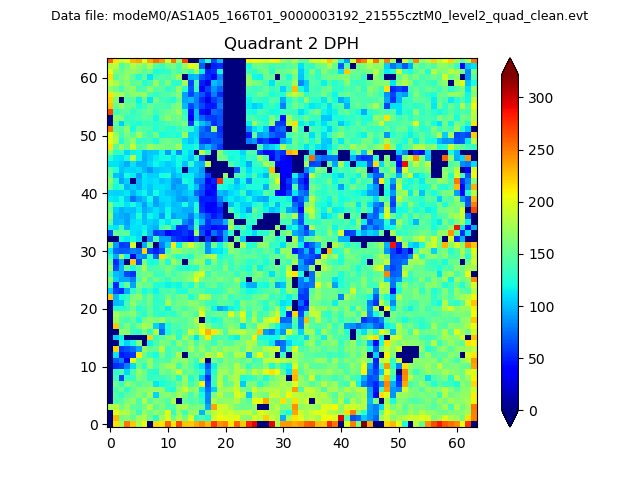 |
Quadrant C |
| Plot type | Count rate plots | Images |
|---|---|---|
| Comparison with Poisson distribution Blue bars denote a histogram of data divided into 1 sec bins. Red curve is a Poisson curve with rate = median count rate of data. |
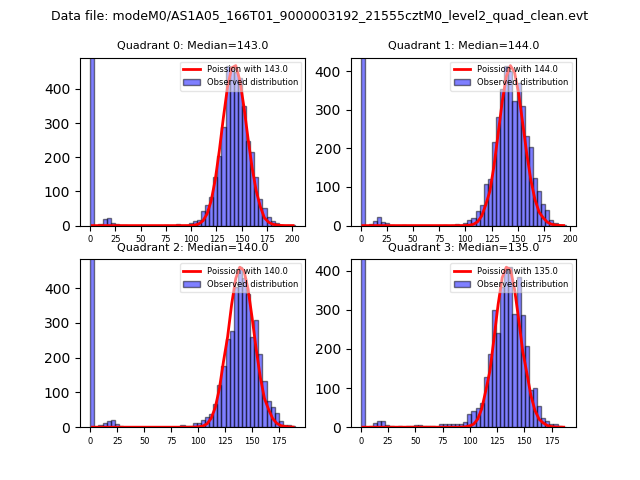 |
 |
| Quadrant-wise count rates Data is divided into 100 sec bins |
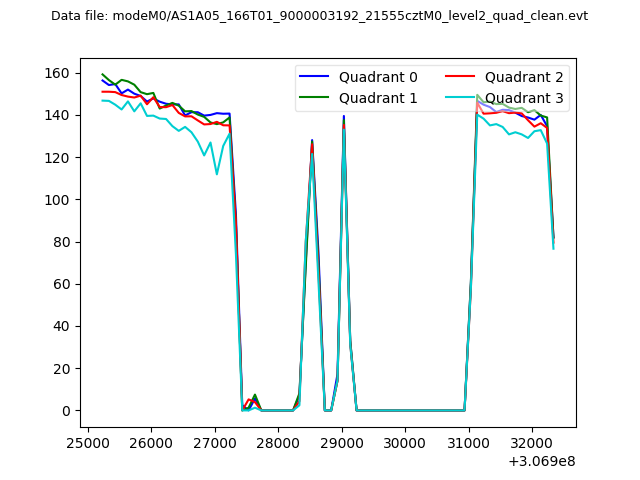 |
|
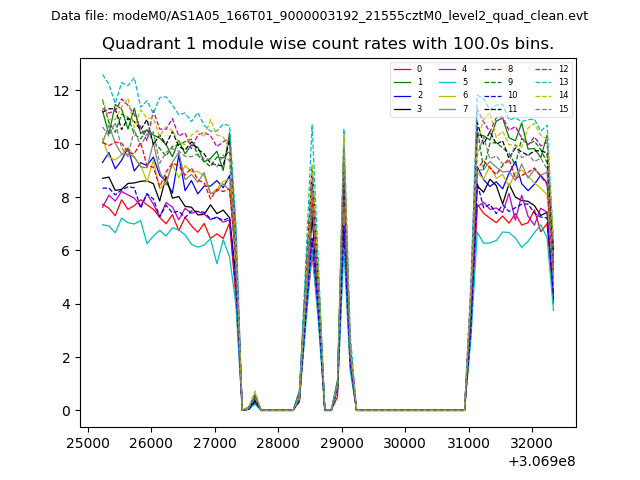
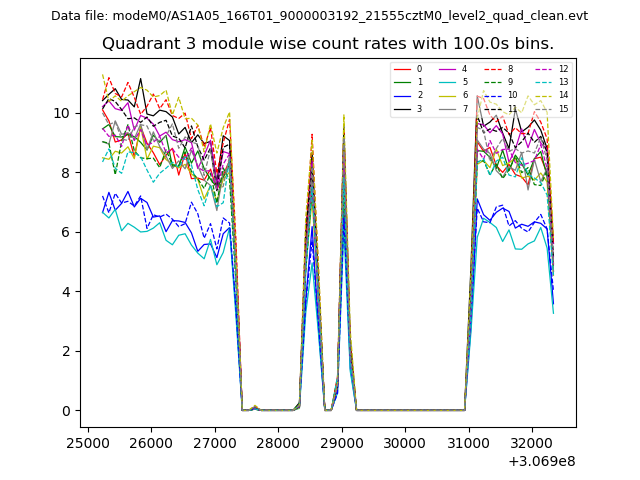
| Module-wise count rates for Quadrant A Data is divided into 100 sec bins |
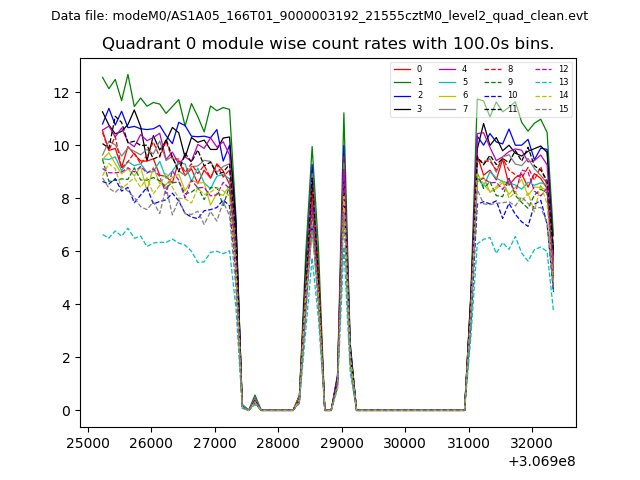 |
 |
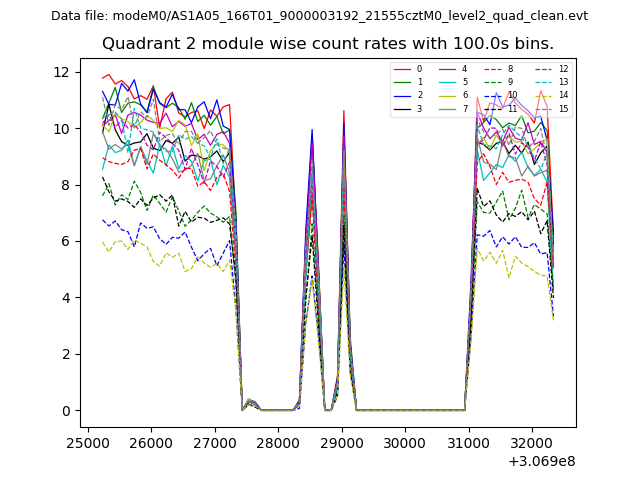
| Module-wise count rates for Quadrant B Data is divided into 100 sec bins |
 |
 |
| Module-wise count rates for Quadrant C Data is divided into 100 sec bins |
 |
 |
| Module-wise count rates for Quadrant D Data is divided into 100 sec bins |
 |
 |
| Parameter | Plot |
|---|---|
| CZT HV Monitor | 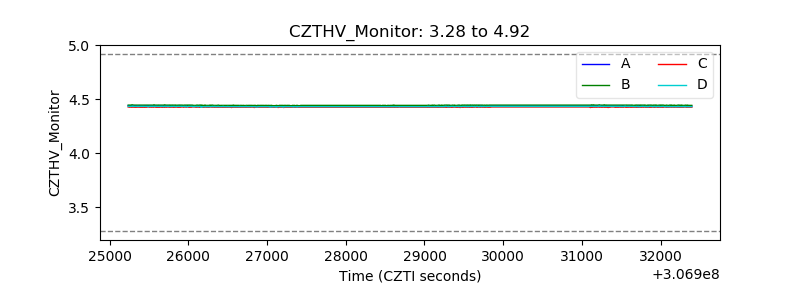 |
| D_VDD | 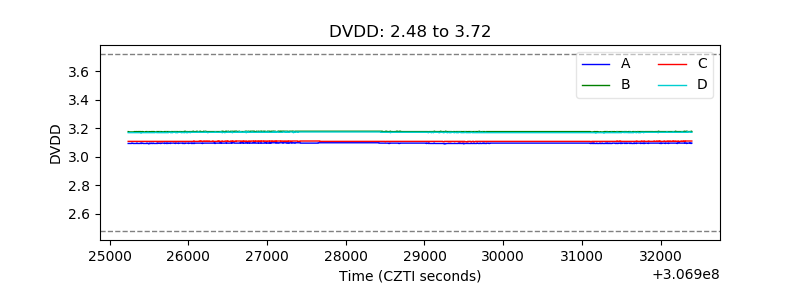 |
| Temperature 1 | 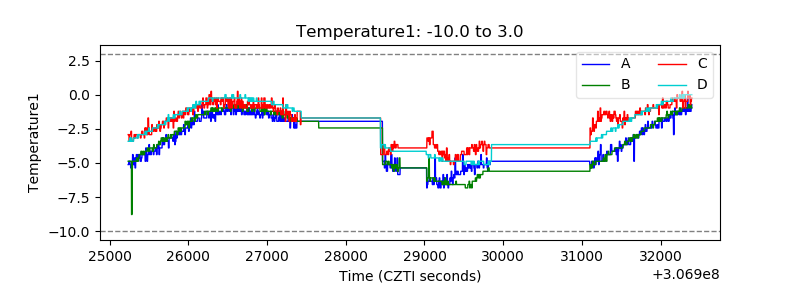 |
| Veto HV Monitor | 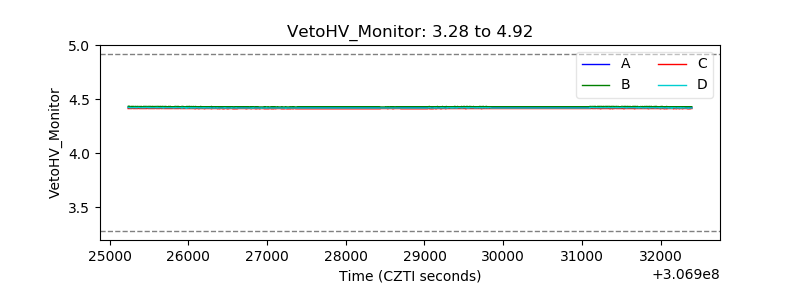 |
| Veto LLD | 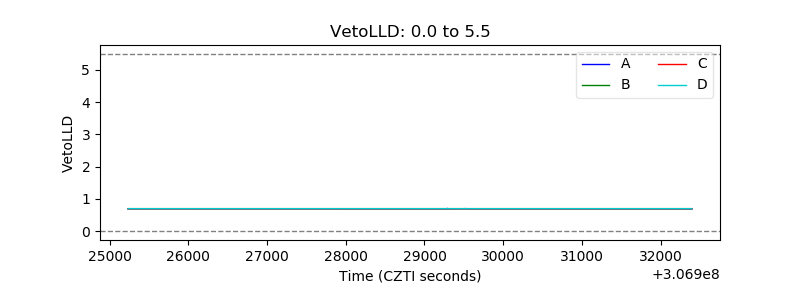 |
| Alpha Counter | 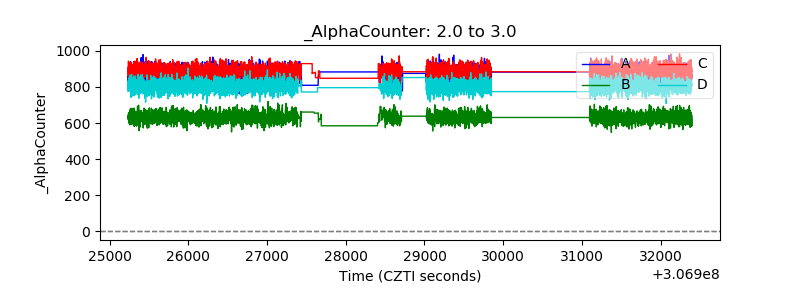 |
| _CPM_Rate | 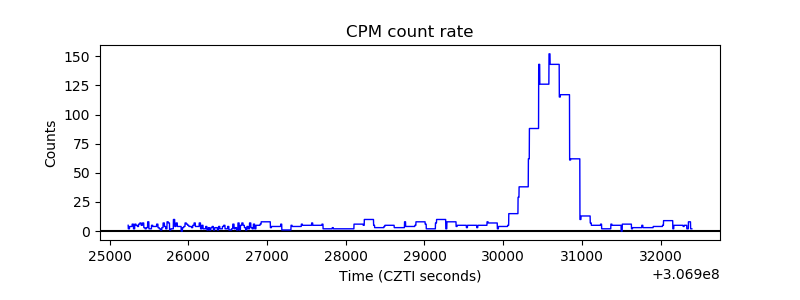 |
| CZT Counter | 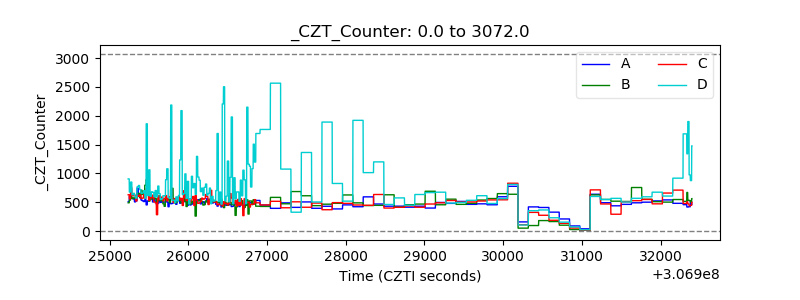 |
| +2.5 Volts monitor | 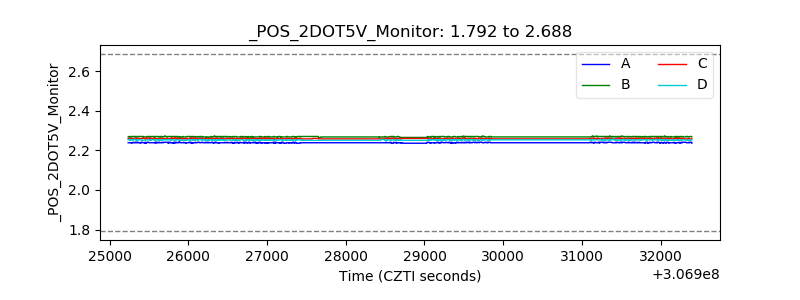 |
| +5 Volts monitor | 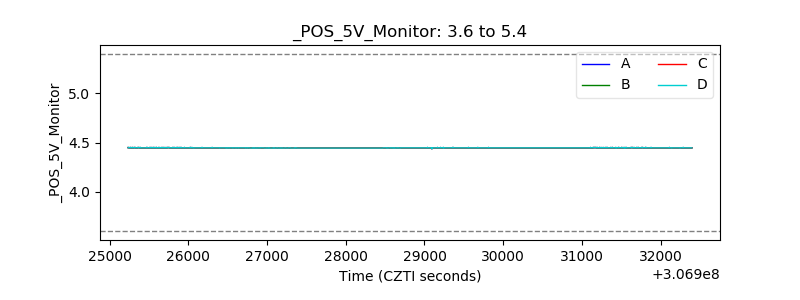 |
| _ROLL_ROT | 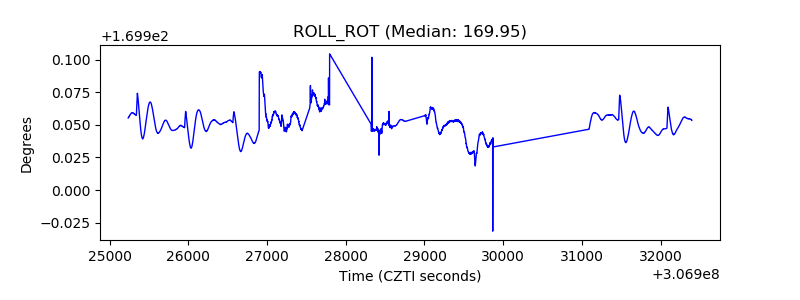 |
| _Roll_DEC | 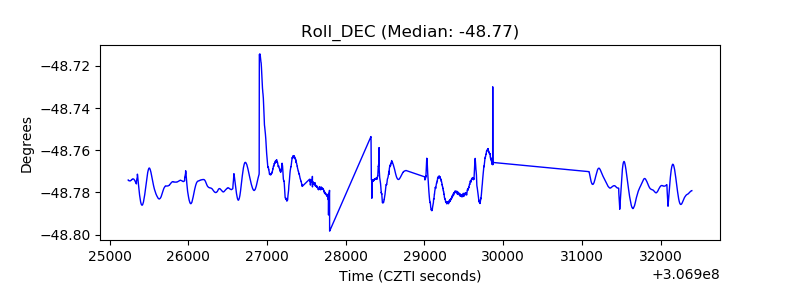 |
| _Roll_RA | 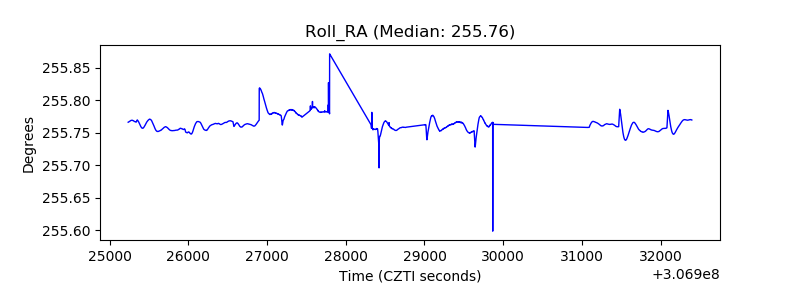 |
| Veto Counter | 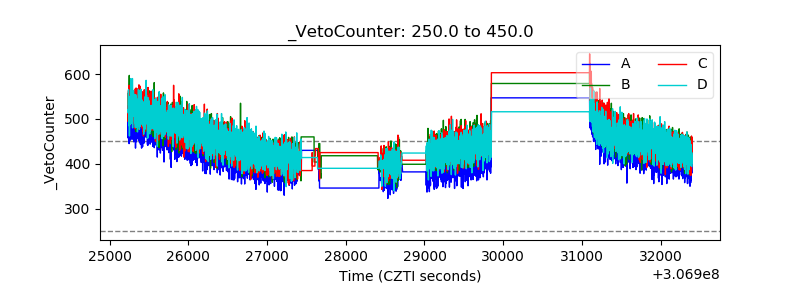 |