| Param | Original file | Final file |
|---|---|---|
| Filename | modeM0/AS1A05_166T01_9000003192_21556cztM0_level2.evt | modeM0/AS1A05_166T01_9000003192_21556cztM0_level2_quad_clean.evt |
| Size (bytes) | 594,440,640 | 105,065,280 |
| Size | 566.9 MB | 100.2 MB |
| Events in quadrant A | 3,303,932 | 690,528 |
| Events in quadrant B | 3,708,254 | 694,981 |
| Events in quadrant C | 3,421,285 | 682,898 |
| Events in quadrant D | 7,101,310 | 632,028 |
| Mode M0 | |||
|---|---|---|---|
| Quadrant | BADHDUFLAG | Total packets | Discarded packets |
| A | 0 | 14226 | 1 |
| B | 0 | 15195 | 1 |
| C | 0 | 14616 | 1 |
| D | 0 | 26022 | 1 |
| Mode M9 | |||
|---|---|---|---|
| Quadrant | BADHDUFLAG | Total packets | Discarded packets |
| A | 0 | 5 | 0 |
| B | 0 | 5 | 0 |
| C | 0 | 5 | 0 |
| D | 0 | 5 | 0 |
| Mode SS | |||
|---|---|---|---|
| Quadrant | BADHDUFLAG | Total packets | Discarded packets |
| A | 0 | 140 | 0 |
| B | 0 | 140 | 0 |
| C | 0 | 140 | 0 |
| D | 0 | 140 | 0 |
| Quadrant | Total seconds | Saturated seconds | Saturation percentage |
|---|---|---|---|
| A | 6911 | 85 | 1.229923% |
| B | 6911 | 102 | 1.475908% |
| C | 6911 | 100 | 1.446969% |
| D | 6910 | 668 | 9.667149% |
Noise dominated data is calculated using 1-second bins in cleaned event files. If a bin has >2000 counts, and if more than 50% of those come from <1% of pixels, then it is considered to be noise-dominated and hence unusable.
| Quadrant | # 1 sec bins | Bins with >0 counts | Bins with >2000 counts | High rate bins dominated by noise | Noise dominated (total time) | Noise dominated (detector-on time) | Marked lightcurve |
|---|---|---|---|---|---|---|---|
| A | 7366 | 6912 | 0 | 0 | 0.00% | 0.00% | 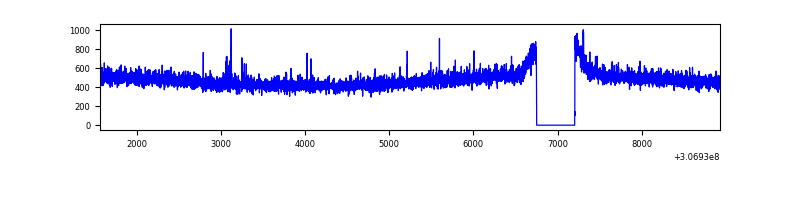 |
| B | 7366 | 6912 | 6 | 6 | 0.08% | 0.09% | 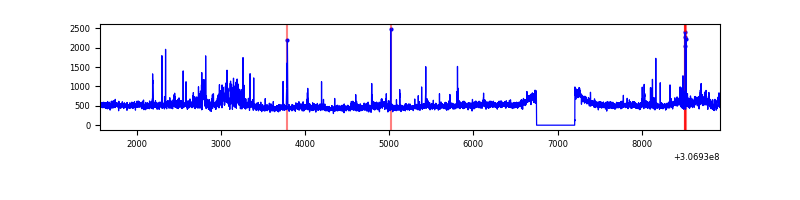 |
| C | 7366 | 6912 | 0 | 0 | 0.00% | 0.00% | 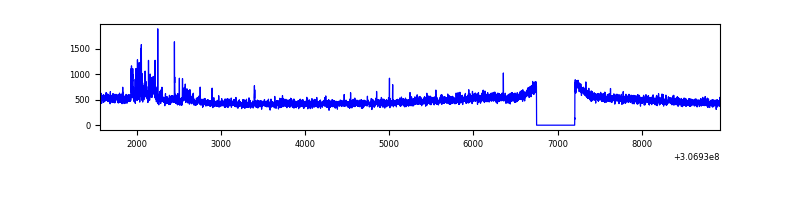 |
| D | 7365 | 6911 | 537 | 537 | 7.29% | 7.77% | 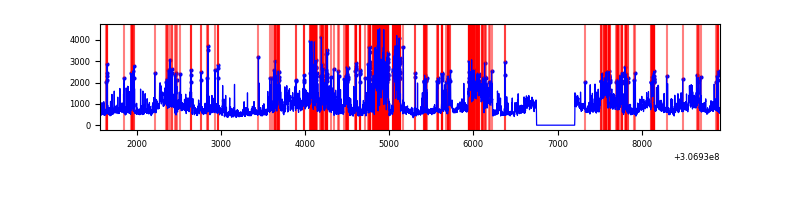 |
Top three noisy pixels from each quadrant. If the there are fewer than three noisy pixels in the level2.evt file, extra rows are filled as -1
| Pixel properties | Quadrant properties | ||||||
|---|---|---|---|---|---|---|---|
| Quadrant | DetID | PixID | Counts | Sigma | Mean | Median | Sigma |
| A | 13 | 254 | 11727 | 63.17 | 854 | 837 | 172.4 |
| A | 4 | 2 | 9969 | 52.97 | 854 | 837 | 172.4 |
| A | 0 | 226 | 7369 | 37.89 | 854 | 837 | 172.4 |
| B | 0 | 189 | 118288 | 731.42 | 847 | 825 | 160.6 |
| B | 0 | 230 | 95334 | 588.49 | 847 | 825 | 160.6 |
| B | 0 | 228 | 64937 | 399.21 | 847 | 825 | 160.6 |
| C | 14 | 238 | 129759 | 676.78 | 816 | 819 | 190.5 |
| C | 3 | 233 | 110864 | 577.6 | 816 | 819 | 190.5 |
| C | 13 | 61 | 5829 | 26.3 | 816 | 819 | 190.5 |
| D | 1 | 52 | 3306282 | 16937.25 | 806 | 782 | 195.2 |
| D | 14 | 35 | 262829 | 1342.72 | 806 | 782 | 195.2 |
| D | 2 | 136 | 262041 | 1338.68 | 806 | 782 | 195.2 |
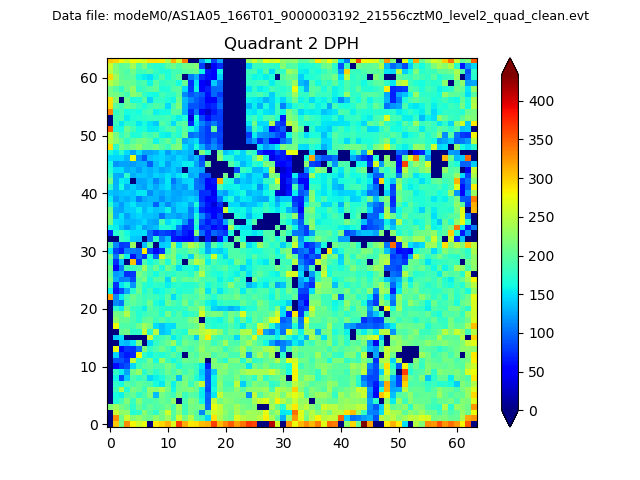
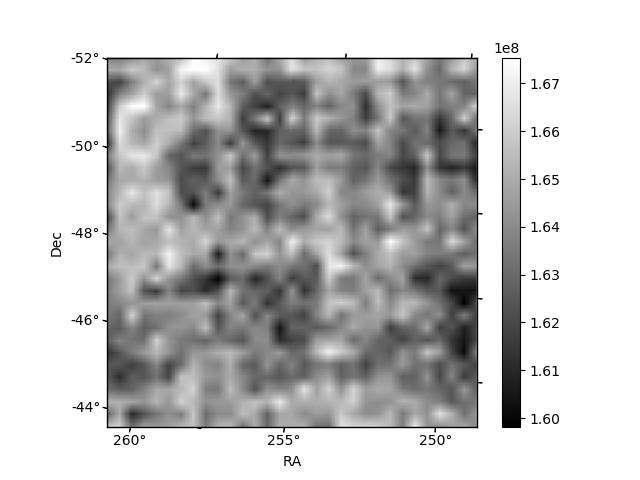
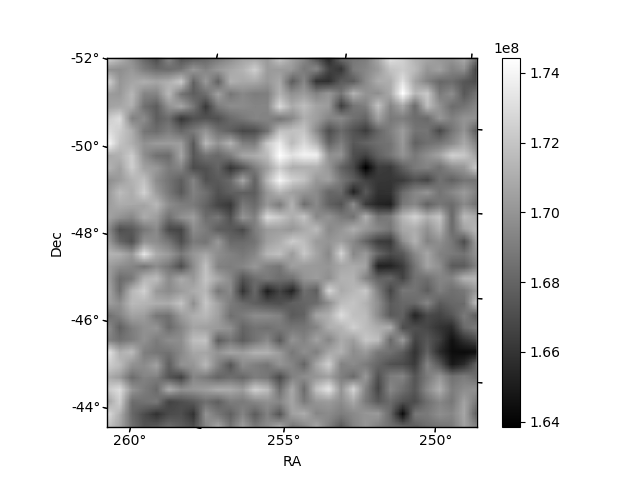
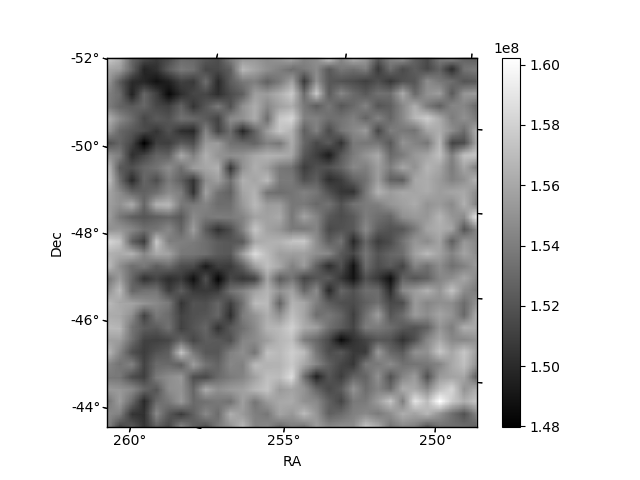
Histogram calculated using DETX and DETY for each event in the final _common_clean file
| Quadrant A | 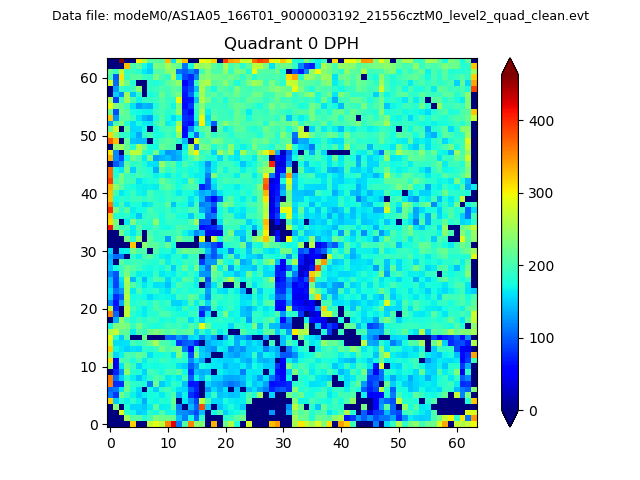 |
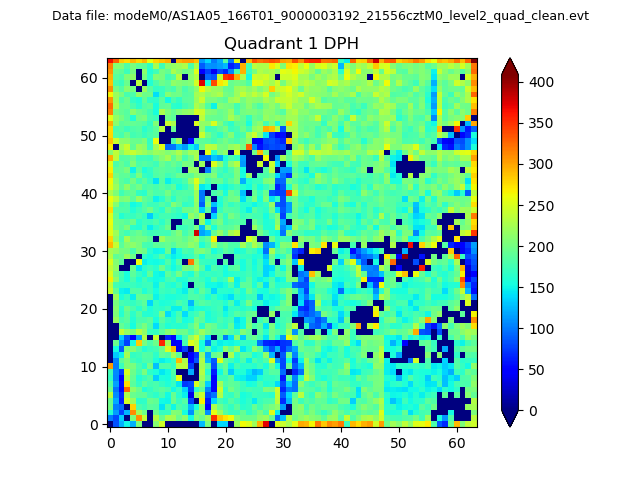 |
Quadrant B |
|---|---|---|---|
| Quadrant D | 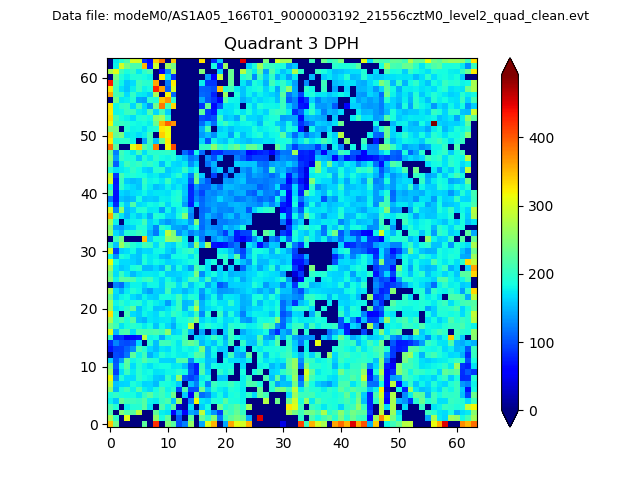 |
 |
Quadrant C |
| Plot type | Count rate plots | Images |
|---|---|---|
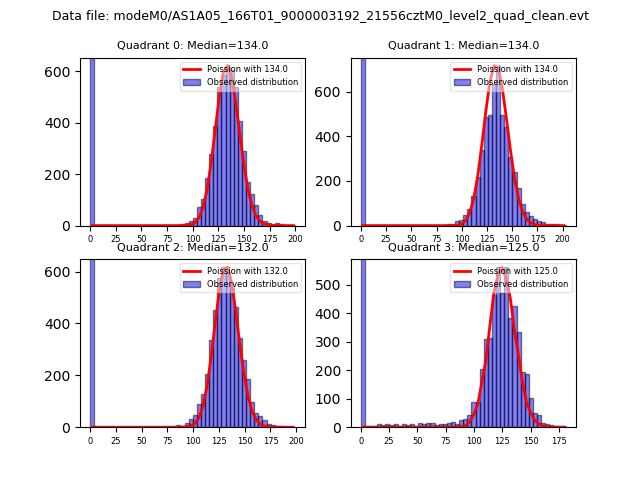
| Comparison with Poisson distribution Blue bars denote a histogram of data divided into 1 sec bins. Red curve is a Poisson curve with rate = median count rate of data. |
 |
 |
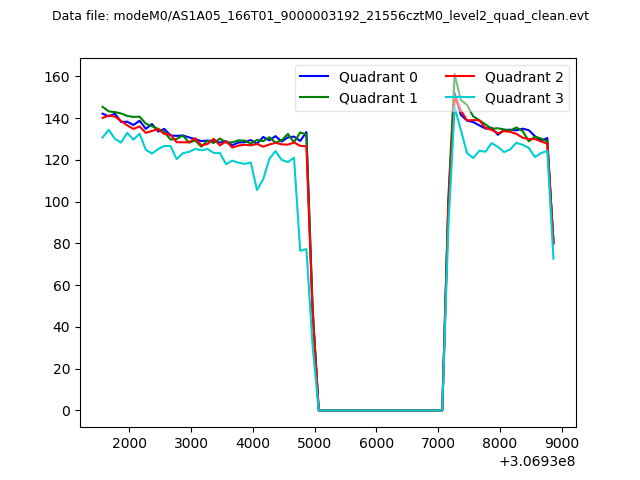
| Quadrant-wise count rates Data is divided into 100 sec bins |
 |
|
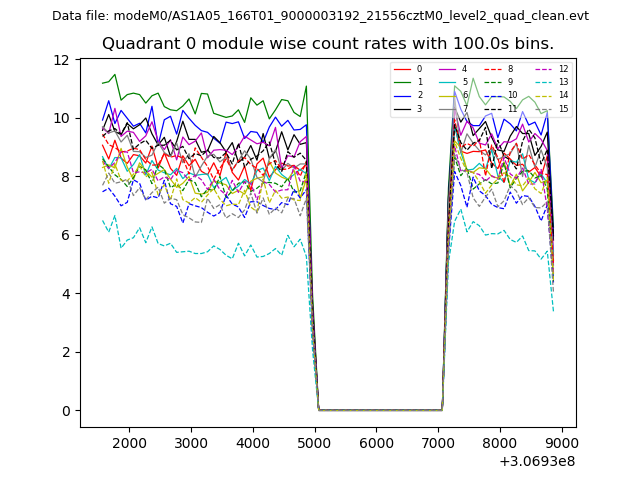
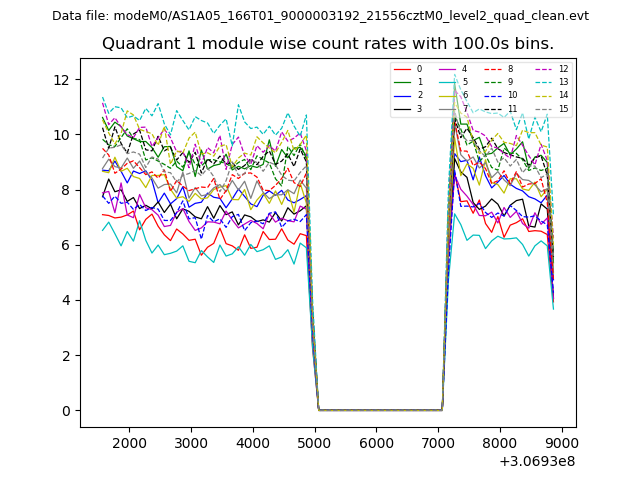
| Module-wise count rates for Quadrant A Data is divided into 100 sec bins |
 |
 |
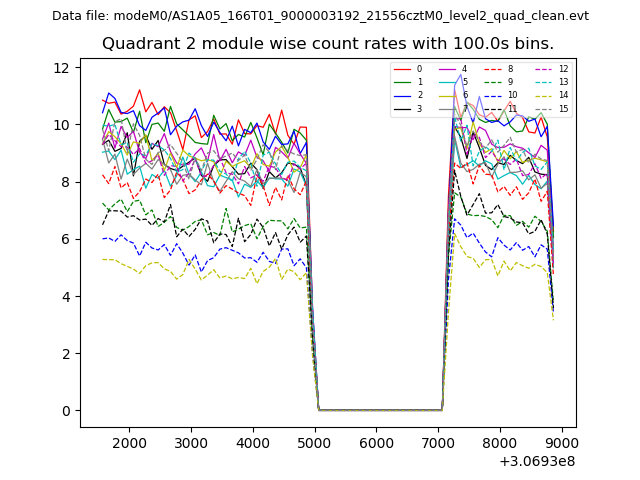
| Module-wise count rates for Quadrant B Data is divided into 100 sec bins |
 |
 |
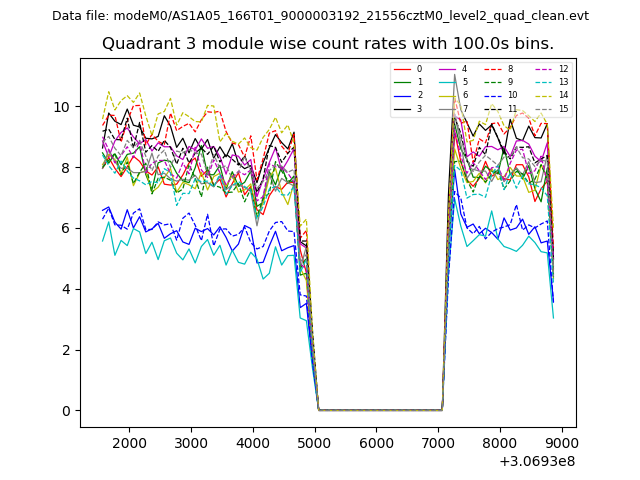
| Module-wise count rates for Quadrant C Data is divided into 100 sec bins |
 |
 |
| Module-wise count rates for Quadrant D Data is divided into 100 sec bins |
 |
 |
| Parameter | Plot |
|---|---|
| CZT HV Monitor | 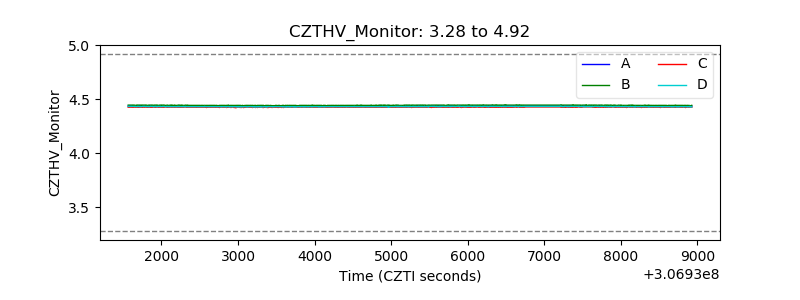 |
| D_VDD | 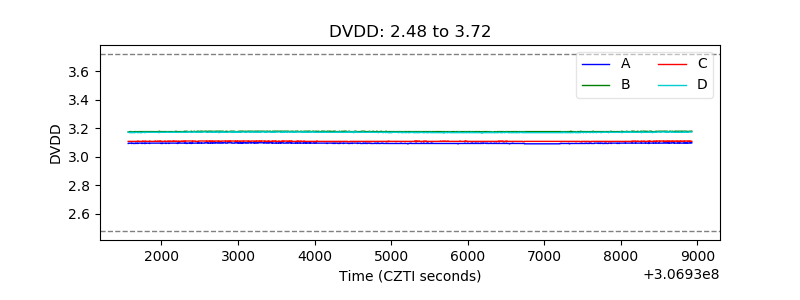 |
| Temperature 1 |  |
| Veto HV Monitor | 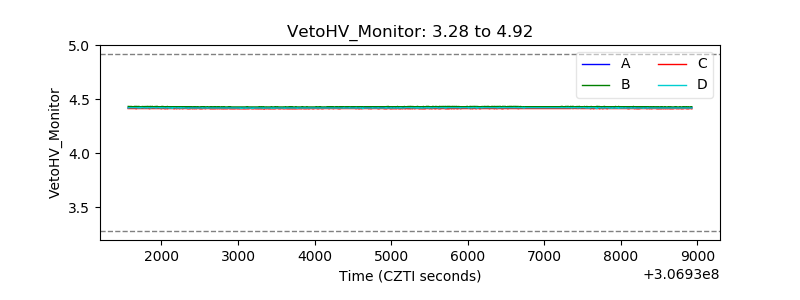 |
| Veto LLD | 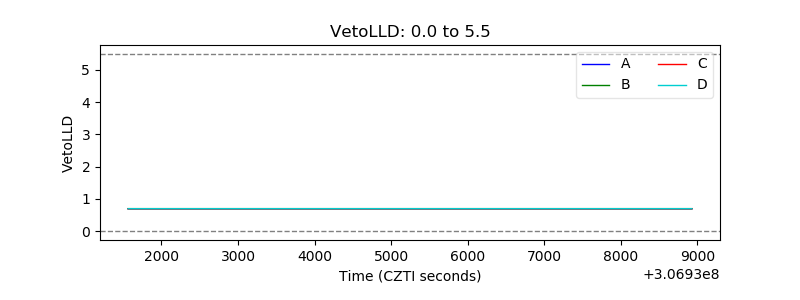 |
| Alpha Counter | 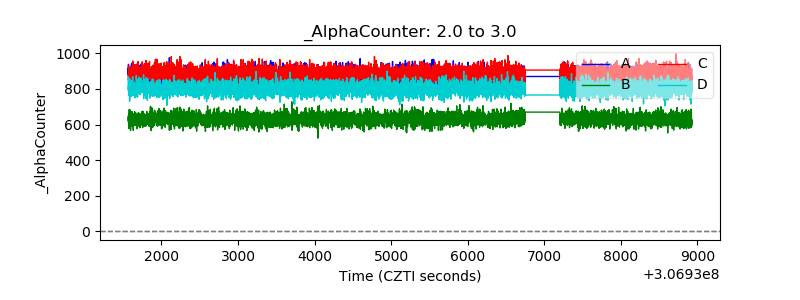 |
| _CPM_Rate | 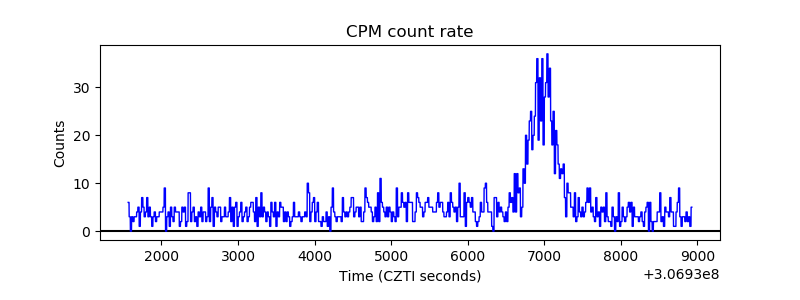 |
| CZT Counter | 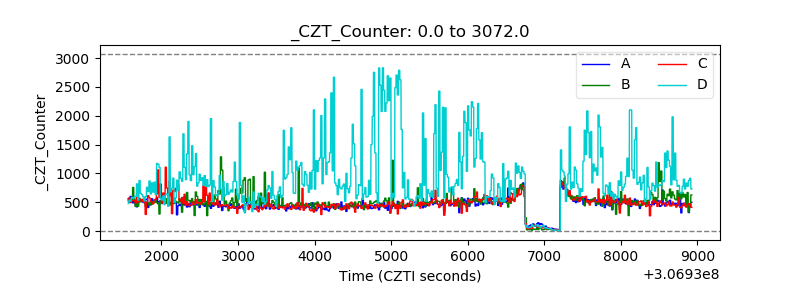 |
| +2.5 Volts monitor |  |
| +5 Volts monitor |  |
| _ROLL_ROT | 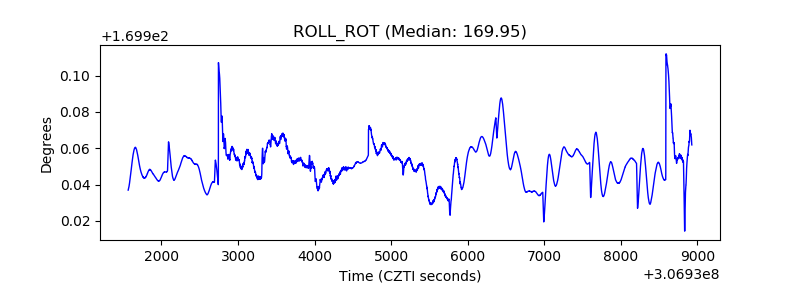 |
| _Roll_DEC | 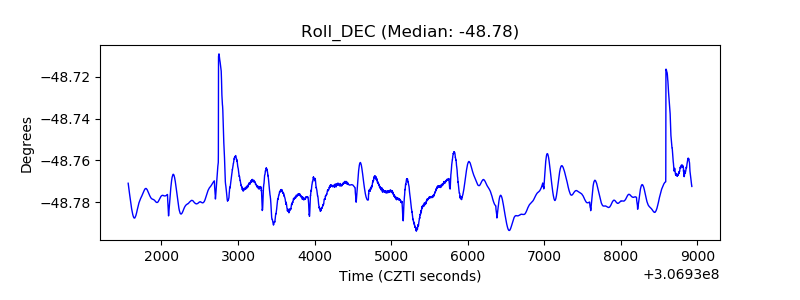 |
| _Roll_RA | 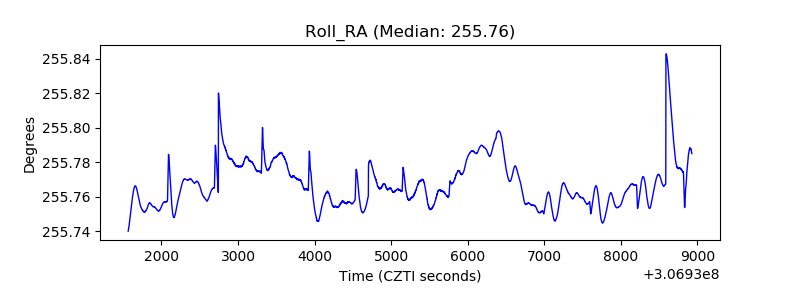 |
| Veto Counter | 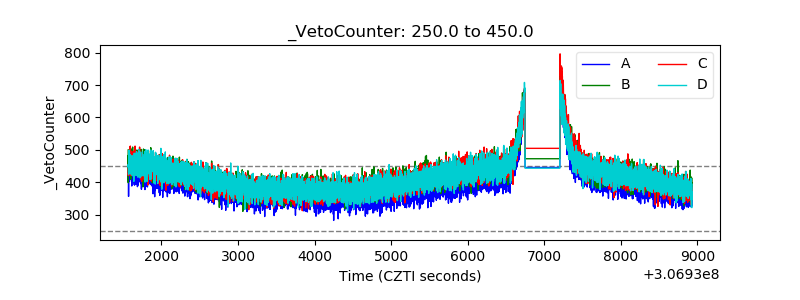 |