| Param | Original file | Final file |
|---|---|---|
| Filename | modeM0/AS1T03_138T03_9000003178cztM0_level2.fits | modeM0/AS1T03_138T03_9000003178cztM0_level2_quad_clean.evt |
| Size (bytes) | 153,126,720 | 68,973,120 |
| Size | 146.0 MB | 65.8 MB |
| Events in quadrant A | 981,942 | 292,302 |
| Events in quadrant B | 945,042 | 297,639 |
| Events in quadrant C | 932,472 | 271,815 |
| Events in quadrant D | 801,560 | 247,744 |
| Mode SS | |||
|---|---|---|---|
| Quadrant | BADHDUFLAG | Total packets | Discarded packets |
| A | 0 | 290 | 0 |
| B | 0 | 290 | 0 |
| C | 0 | 290 | 0 |
| D | 0 | 290 | 0 |
| Mode M9 | |||
|---|---|---|---|
| Quadrant | BADHDUFLAG | Total packets | Discarded packets |
| A | 0 | 37 | 0 |
| B | 0 | 37 | 0 |
| C | 0 | 37 | 0 |
| D | 0 | 37 | 0 |
| Mode M0 | |||
|---|---|---|---|
| Quadrant | BADHDUFLAG | Total packets | Discarded packets |
| A | 0 | 29705 | 0 |
| B | 0 | 30501 | 0 |
| C | 0 | 29750 | 0 |
| D | 0 | 33975 | 0 |
| Quadrant | Total seconds | Saturated seconds | Saturation percentage |
|---|---|---|---|
| A | 14146 | 44 | 0.311042% |
| B | 14146 | 55 | 0.388802% |
| C | 14146 | 108 | 0.763467% |
| D | 14146 | 306 | 2.163156% |
Noise dominated data is calculated using 1-second bins in cleaned event files. If a bin has >2000 counts, and if more than 50% of those come from <1% of pixels, then it is considered to be noise-dominated and hence unusable.
| Quadrant | # 1 sec bins | Bins with >0 counts | Bins with >2000 counts | High rate bins dominated by noise | Noise dominated (total time) | Noise dominated (detector-on time) | Marked lightcurve |
|---|---|---|---|---|---|---|---|
| A | 17936 | 14146 | 0 | 0 | 0.00% | 0.00% |  |
| B | 17936 | 14146 | 0 | 0 | 0.00% | 0.00% |  |
| C | 17936 | 14146 | 0 | 0 | 0.00% | 0.00% |  |
| D | 17936 | 14144 | 0 | 0 | 0.00% | 0.00% |  |
Top three noisy pixels from each quadrant. If the there are fewer than three noisy pixels in the level2.evt file, extra rows are filled as -1
| Pixel properties | Quadrant properties | ||||||
|---|---|---|---|---|---|---|---|
| Quadrant | DetID | PixID | Counts | Sigma | Mean | Median | Sigma |
| A | 0 | 29 | 907 | 10.52 | 255 | 241 | 63.3 |
| A | 7 | 110 | 756 | 8.13 | 255 | 241 | 63.3 |
| A | 0 | 30 | 716 | 7.5 | 255 | 241 | 63.3 |
| B | 2 | 9 | 745 | 9.91 | 250 | 239 | 51.1 |
| B | 5 | 128 | 598 | 7.03 | 250 | 239 | 51.1 |
| B | 2 | 8 | 591 | 6.89 | 250 | 239 | 51.1 |
| C | 1 | 81 | 676 | 6.85 | 246 | 231 | 65.0 |
| C | 1 | 80 | 675 | 6.83 | 246 | 231 | 65.0 |
| C | 9 | 188 | 647 | 6.4 | 246 | 231 | 65.0 |
| D | 6 | 231 | 617 | 6.63 | 229 | 210 | 61.4 |
| D | 10 | 189 | 573 | 5.91 | 229 | 210 | 61.4 |
| D | 7 | 3 | 567 | 5.81 | 229 | 210 | 61.4 |
Histogram calculated using DETX and DETY for each event in the final _common_clean file
| Quadrant A | 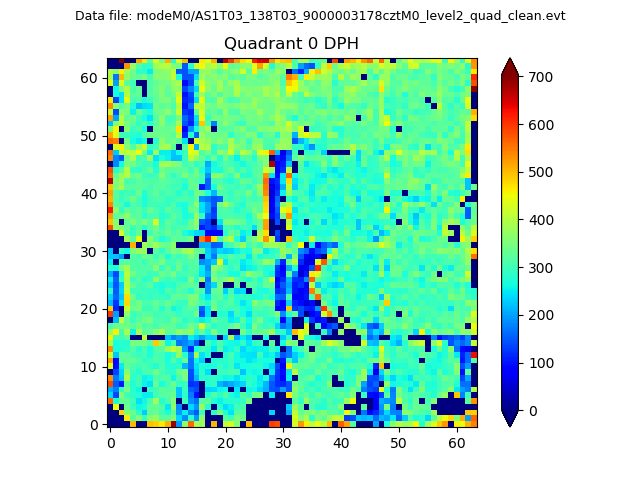 |
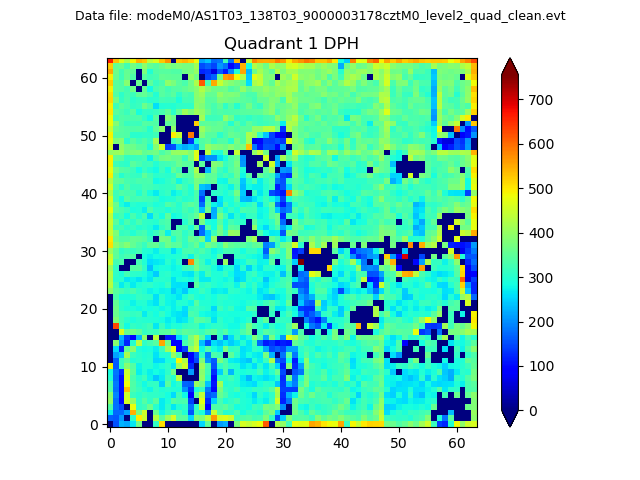 |
Quadrant B |
|---|---|---|---|
| Quadrant D |  |
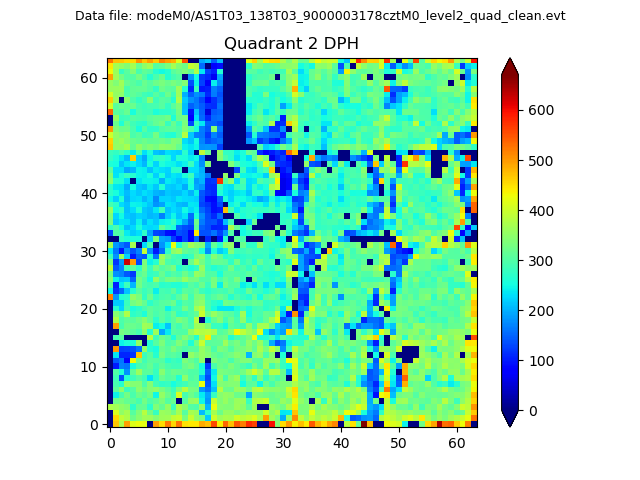 |
Quadrant C |
| Plot type | Count rate plots | Images |
|---|---|---|
| Comparison with Poisson distribution Blue bars denote a histogram of data divided into 1 sec bins. Red curve is a Poisson curve with rate = median count rate of data. |
 |
 |
| Quadrant-wise count rates Data is divided into 100 sec bins |
 |
|
| Module-wise count rates for Quadrant A Data is divided into 100 sec bins |
 |
 |
| Module-wise count rates for Quadrant B Data is divided into 100 sec bins |
 |
 |
| Module-wise count rates for Quadrant C Data is divided into 100 sec bins |
 |
 |
| Module-wise count rates for Quadrant D Data is divided into 100 sec bins |
 |
 |
| Parameter | Plot |
|---|---|
| CZT HV Monitor |  |
| D_VDD |  |
| Temperature 1 |  |
| Veto HV Monitor |  |
| Veto LLD |  |
| Alpha Counter |  |
| _CPM_Rate |  |
| CZT Counter |  |
| +2.5 Volts monitor |  |
| +5 Volts monitor |  |
| _ROLL_ROT |  |
| _Roll_DEC |  |
| _Roll_RA |  |
| Veto Counter |  |