| Param | Original file | Final file |
|---|---|---|
| Filename | modeM0/AS1T03_138T03_9000003178_21535cztM0_level2.evt | modeM0/AS1T03_138T03_9000003178_21535cztM0_level2_quad_clean.evt |
| Size (bytes) | 126,578,880 | 31,484,160 |
| Size | 120.7 MB | 30.0 MB |
| Events in quadrant A | 757,825 | 218,208 |
| Events in quadrant B | 791,073 | 227,322 |
| Events in quadrant C | 778,012 | 211,981 |
| Events in quadrant D | 1,406,158 | 188,633 |
| Mode SS | |||
|---|---|---|---|
| Quadrant | BADHDUFLAG | Total packets | Discarded packets |
| A | 0 | 32 | 0 |
| B | 0 | 32 | 0 |
| C | 0 | 32 | 0 |
| D | 0 | 32 | 0 |
| Mode M9 | |||
|---|---|---|---|
| Quadrant | BADHDUFLAG | Total packets | Discarded packets |
| A | 0 | 11 | 0 |
| B | 0 | 11 | 0 |
| C | 0 | 11 | 0 |
| D | 0 | 11 | 0 |
| Mode M0 | |||
|---|---|---|---|
| Quadrant | BADHDUFLAG | Total packets | Discarded packets |
| A | 0 | 3086 | 1 |
| B | 0 | 3252 | 1 |
| C | 0 | 3203 | 1 |
| D | 0 | 5191 | 1 |
| Quadrant | Total seconds | Saturated seconds | Saturation percentage |
|---|---|---|---|
| A | 1432 | 7 | 0.488827% |
| B | 1432 | 9 | 0.628492% |
| C | 1432 | 29 | 2.025140% |
| D | 1432 | 177 | 12.360335% |
Noise dominated data is calculated using 1-second bins in cleaned event files. If a bin has >2000 counts, and if more than 50% of those come from <1% of pixels, then it is considered to be noise-dominated and hence unusable.
| Quadrant | # 1 sec bins | Bins with >0 counts | Bins with >2000 counts | High rate bins dominated by noise | Noise dominated (total time) | Noise dominated (detector-on time) | Marked lightcurve |
|---|---|---|---|---|---|---|---|
| A | 2587 | 1433 | 0 | 0 | 0.00% | 0.00% | 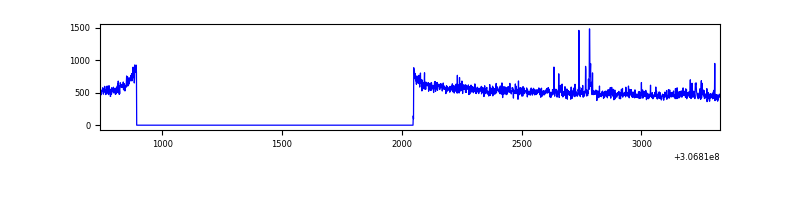 |
| B | 2587 | 1433 | 0 | 0 | 0.00% | 0.00% | 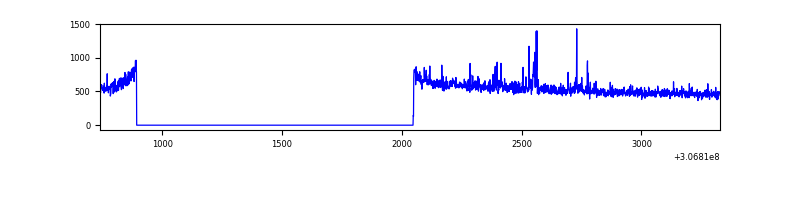 |
| C | 2587 | 1433 | 0 | 0 | 0.00% | 0.00% | 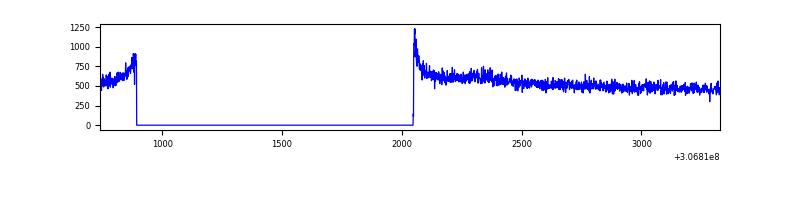 |
| D | 2587 | 1433 | 130 | 130 | 5.03% | 9.07% | 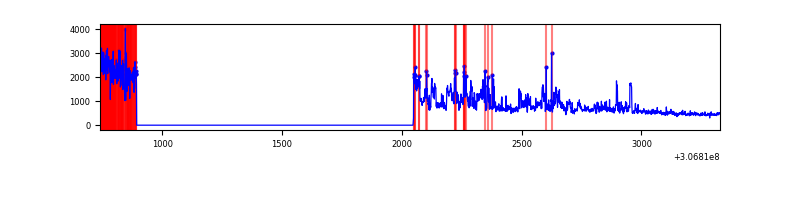 |
Top three noisy pixels from each quadrant. If the there are fewer than three noisy pixels in the level2.evt file, extra rows are filled as -1
| Pixel properties | Quadrant properties | ||||||
|---|---|---|---|---|---|---|---|
| Quadrant | DetID | PixID | Counts | Sigma | Mean | Median | Sigma |
| A | 12 | 96 | 12739 | 313.1 | 193 | 189 | 40.1 |
| A | 13 | 254 | 2032 | 45.98 | 193 | 189 | 40.1 |
| A | 0 | 226 | 1704 | 37.8 | 193 | 189 | 40.1 |
| B | 0 | 230 | 16056 | 414.35 | 196 | 192 | 38.3 |
| B | 0 | 197 | 4679 | 117.2 | 196 | 192 | 38.3 |
| B | 12 | 111 | 4259 | 106.23 | 196 | 192 | 38.3 |
| C | 14 | 238 | 29678 | 643.82 | 187 | 188 | 45.8 |
| C | 3 | 233 | 16105 | 347.5 | 187 | 188 | 45.8 |
| C | 13 | 61 | 1254 | 23.27 | 187 | 188 | 45.8 |
| D | 1 | 52 | 371430 | 8746.47 | 172 | 168 | 42.4 |
| D | 7 | 38 | 233041 | 5486.2 | 172 | 168 | 42.4 |
| D | 14 | 35 | 77971 | 1832.94 | 172 | 168 | 42.4 |
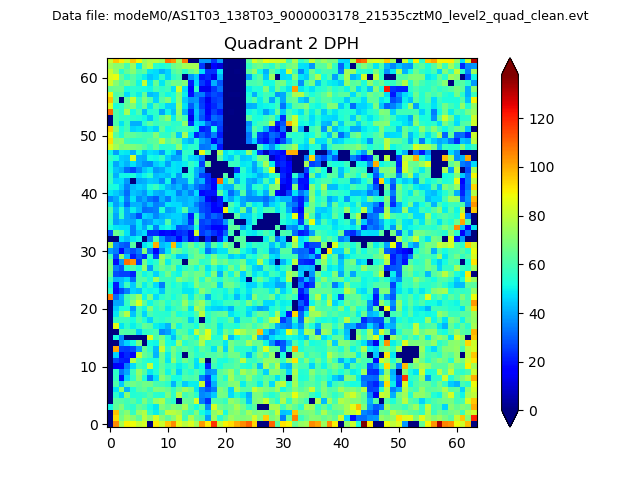
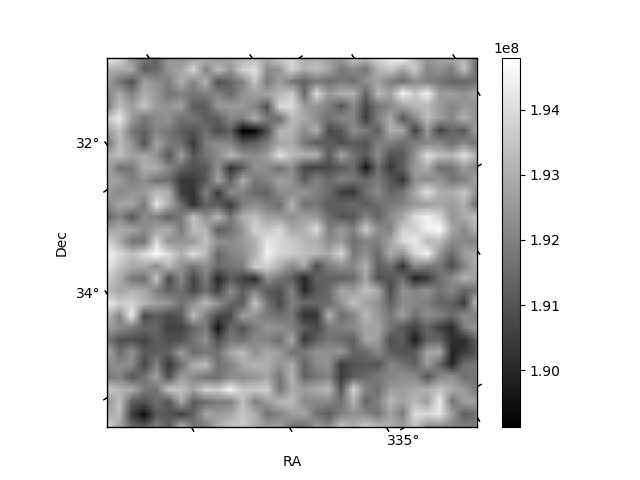
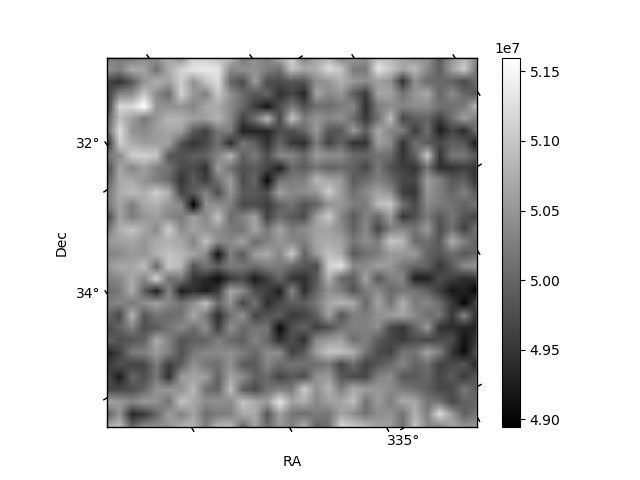
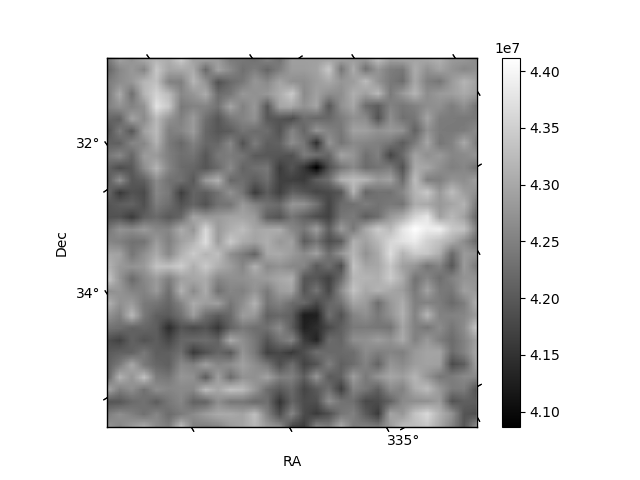
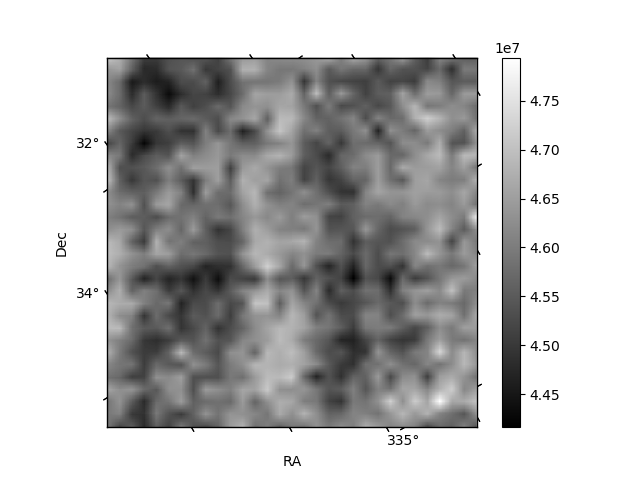
Histogram calculated using DETX and DETY for each event in the final _common_clean file
| Quadrant A | 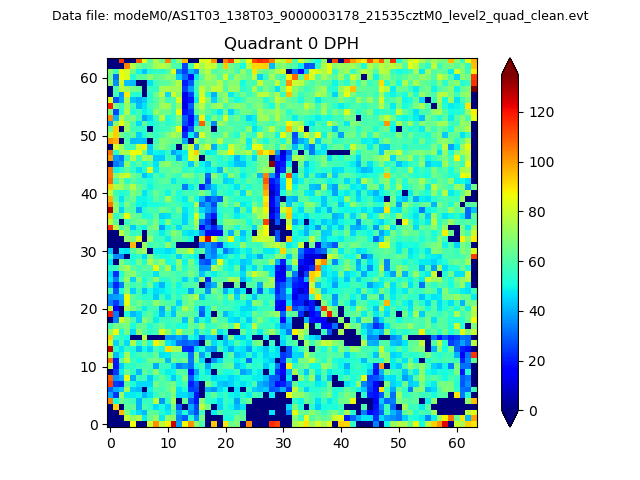 |
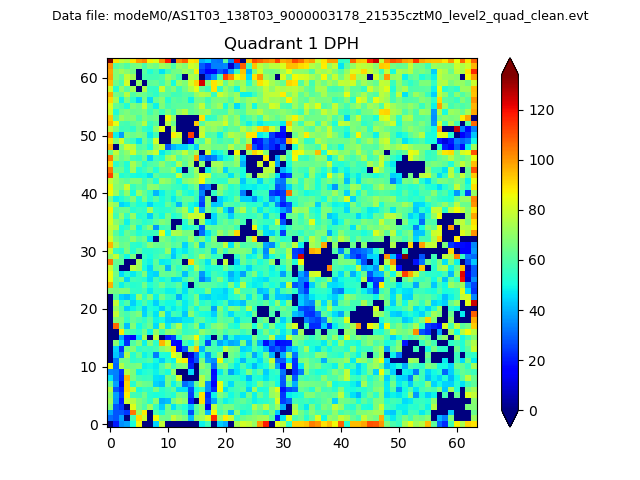 |
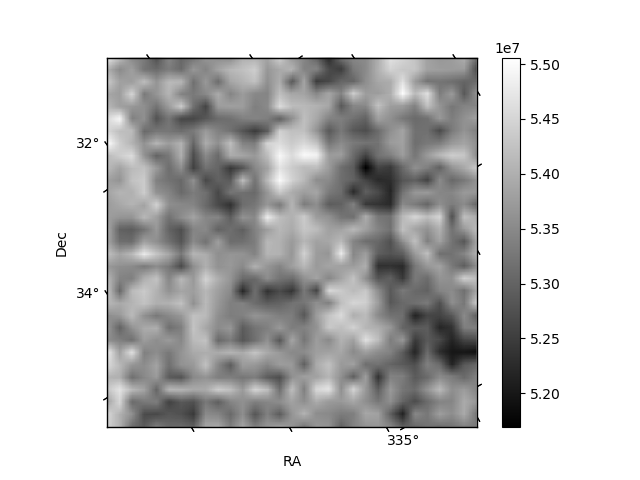
Quadrant B |
|---|---|---|---|
| Quadrant D | 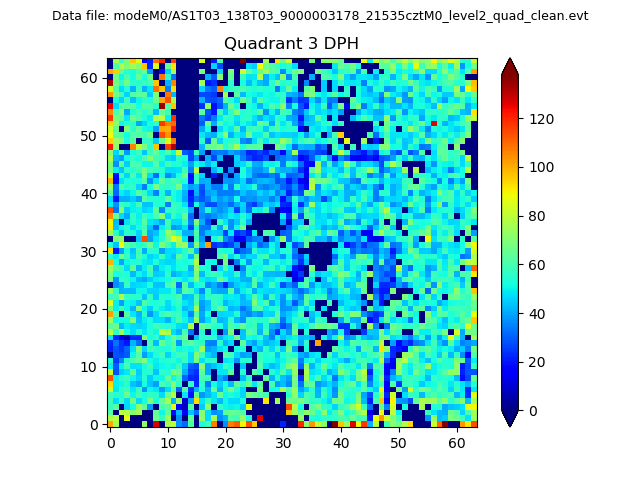 |
 |
Quadrant C |
| Plot type | Count rate plots | Images |
|---|---|---|
| Comparison with Poisson distribution Blue bars denote a histogram of data divided into 1 sec bins. Red curve is a Poisson curve with rate = median count rate of data. |
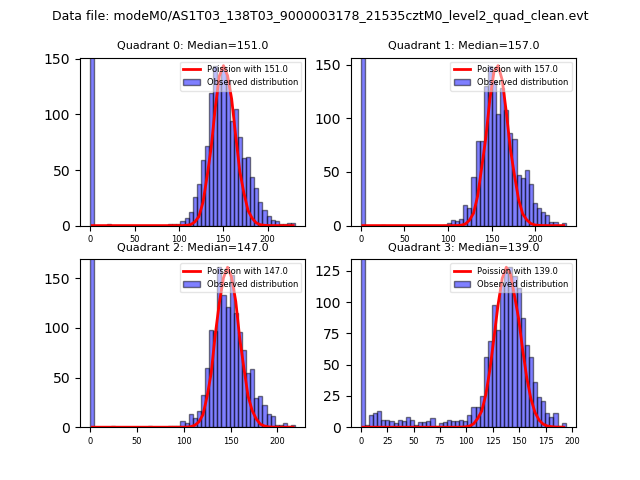 |
 |
| Quadrant-wise count rates Data is divided into 100 sec bins |
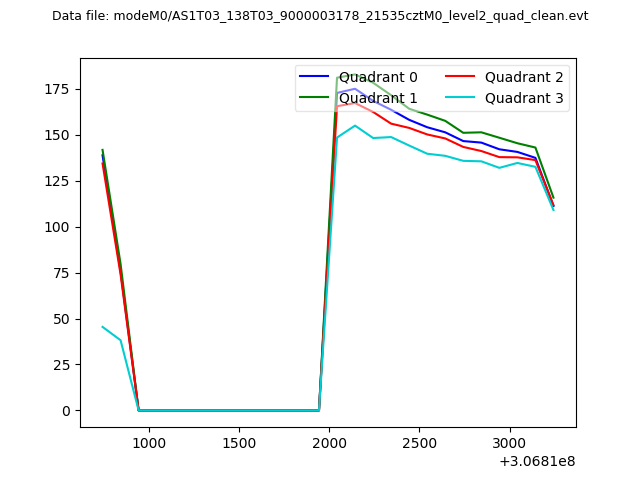 |
|
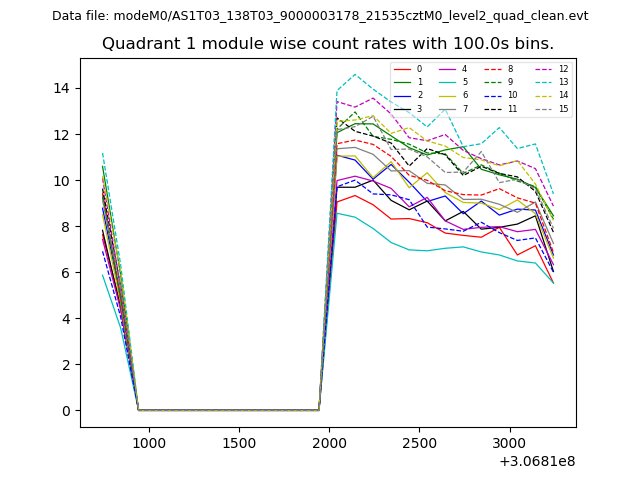
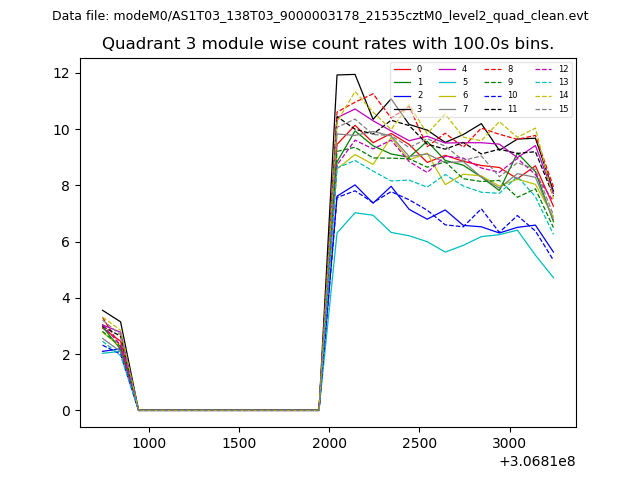
| Module-wise count rates for Quadrant A Data is divided into 100 sec bins |
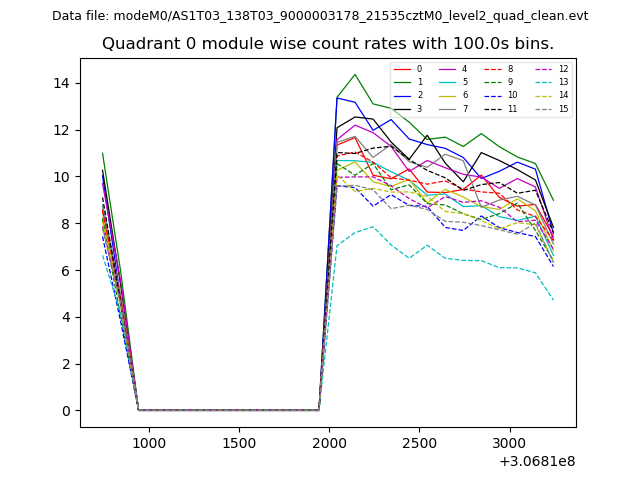 |
 |
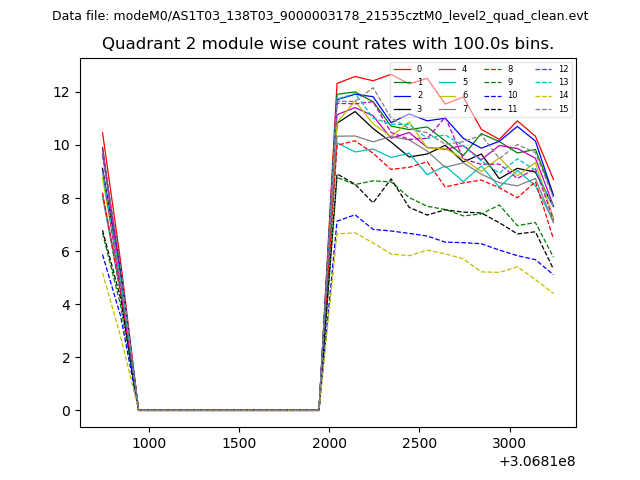
| Module-wise count rates for Quadrant B Data is divided into 100 sec bins |
 |
 |
| Module-wise count rates for Quadrant C Data is divided into 100 sec bins |
 |
 |
| Module-wise count rates for Quadrant D Data is divided into 100 sec bins |
 |
 |
| Parameter | Plot |
|---|---|
| CZT HV Monitor | 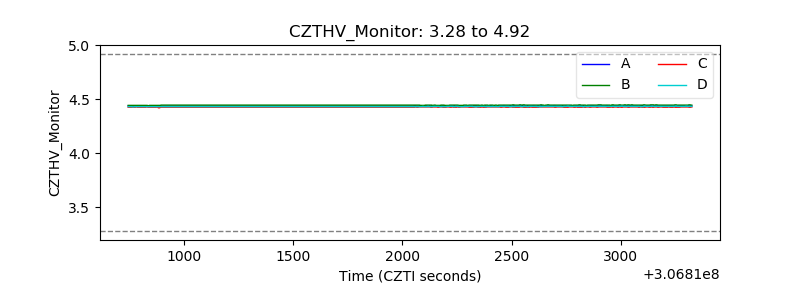 |
| D_VDD | 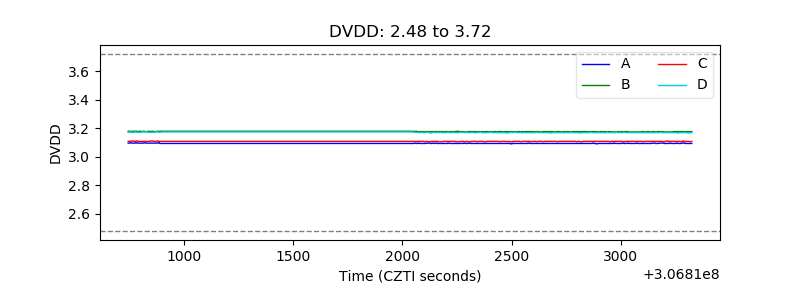 |
| Temperature 1 | 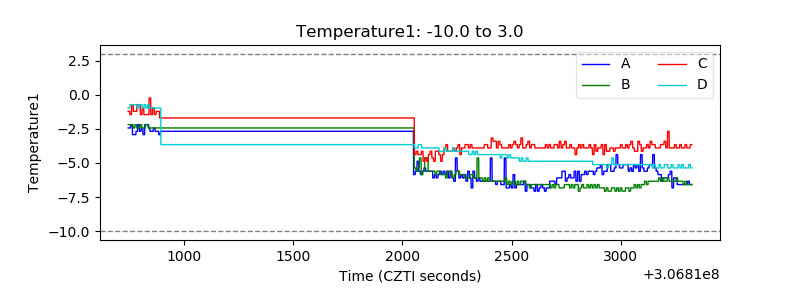 |
| Veto HV Monitor | 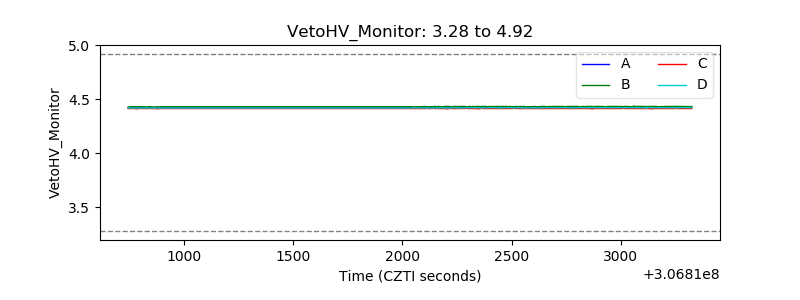 |
| Veto LLD | 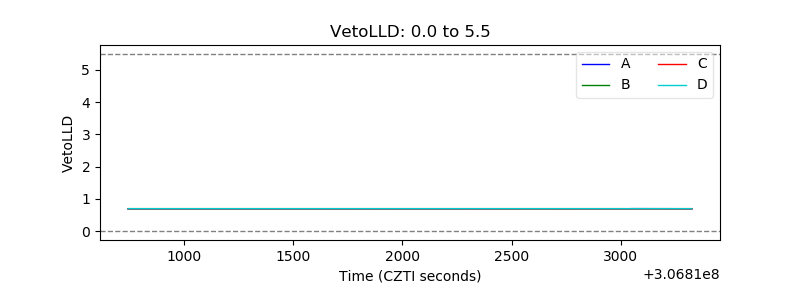 |
| Alpha Counter | 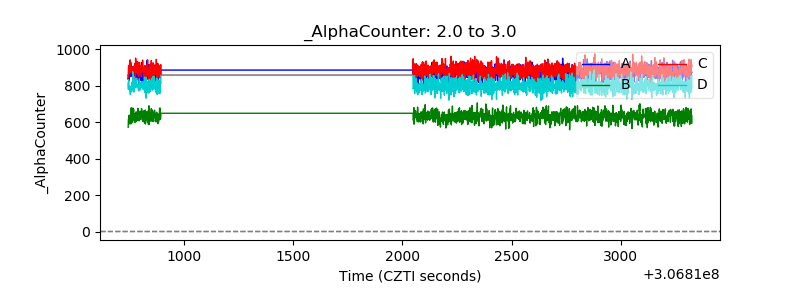 |
| _CPM_Rate | 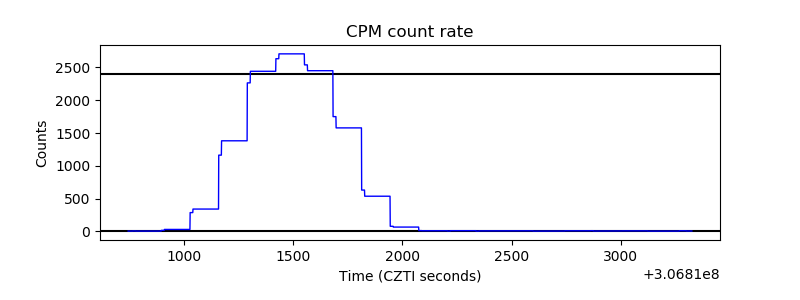 |
| CZT Counter | 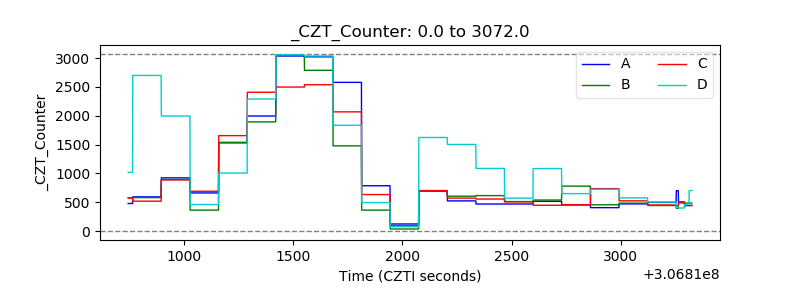 |
| +2.5 Volts monitor |  |
| +5 Volts monitor |  |
| _ROLL_ROT | 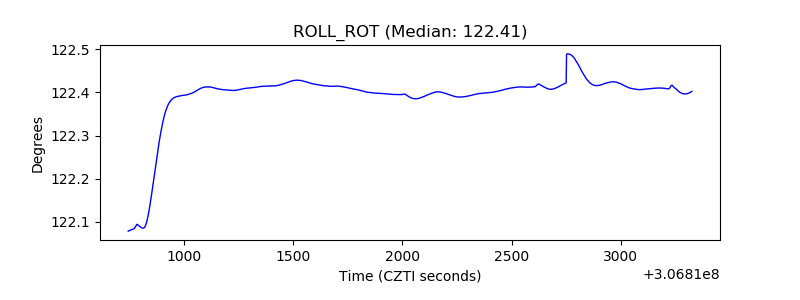 |
| _Roll_DEC |  |
| _Roll_RA | 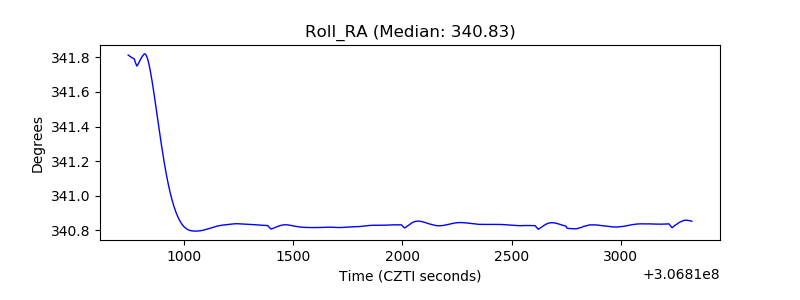 |
| Veto Counter | 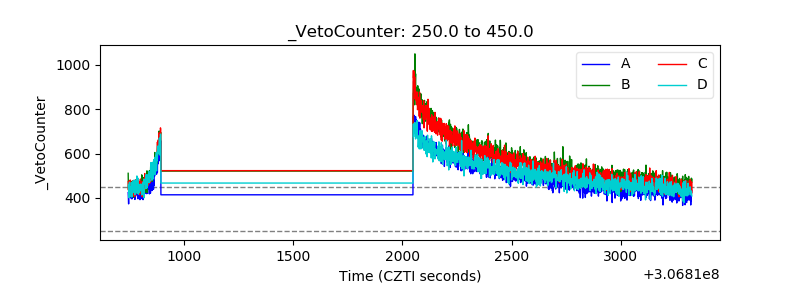 |