| Param | Original file | Final file |
|---|---|---|
| Filename | modeM0/AS1T03_138T03_9000003178_21537cztM0_level2.evt | modeM0/AS1T03_138T03_9000003178_21537cztM0_level2_quad_clean.evt |
| Size (bytes) | 459,754,560 | 81,820,800 |
| Size | 438.5 MB | 78.0 MB |
| Events in quadrant A | 3,293,159 | 525,849 |
| Events in quadrant B | 3,367,008 | 541,881 |
| Events in quadrant C | 3,276,217 | 500,345 |
| Events in quadrant D | 3,565,190 | 475,608 |
| Mode SS | |||
|---|---|---|---|
| Quadrant | BADHDUFLAG | Total packets | Discarded packets |
| A | 0 | 126 | 0 |
| B | 0 | 126 | 0 |
| C | 0 | 126 | 0 |
| D | 0 | 126 | 0 |
| Mode M9 | |||
|---|---|---|---|
| Quadrant | BADHDUFLAG | Total packets | Discarded packets |
| A | 0 | 19 | 0 |
| B | 0 | 20 | 0 |
| C | 0 | 20 | 0 |
| D | 0 | 20 | 0 |
| Mode M0 | |||
|---|---|---|---|
| Quadrant | BADHDUFLAG | Total packets | Discarded packets |
| A | 0 | 13398 | 2 |
| B | 0 | 13740 | 2 |
| C | 0 | 13360 | 2 |
| D | 0 | 14608 | 2 |
| Quadrant | Total seconds | Saturated seconds | Saturation percentage |
|---|---|---|---|
| A | 6218 | 28 | 0.450306% |
| B | 6218 | 32 | 0.514635% |
| C | 6218 | 52 | 0.836282% |
| D | 6218 | 111 | 1.785140% |
Noise dominated data is calculated using 1-second bins in cleaned event files. If a bin has >2000 counts, and if more than 50% of those come from <1% of pixels, then it is considered to be noise-dominated and hence unusable.
| Quadrant | # 1 sec bins | Bins with >0 counts | Bins with >2000 counts | High rate bins dominated by noise | Noise dominated (total time) | Noise dominated (detector-on time) | Marked lightcurve |
|---|---|---|---|---|---|---|---|
| A | 7563 | 6219 | 6 | 6 | 0.08% | 0.10% | 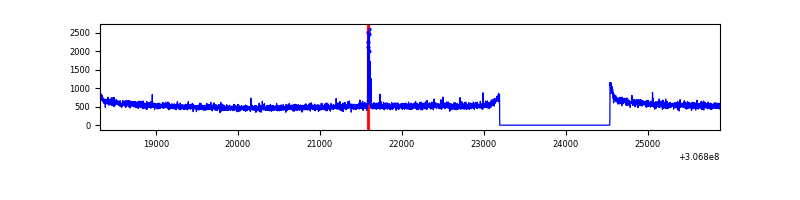 |
| B | 7563 | 6219 | 0 | 0 | 0.00% | 0.00% | 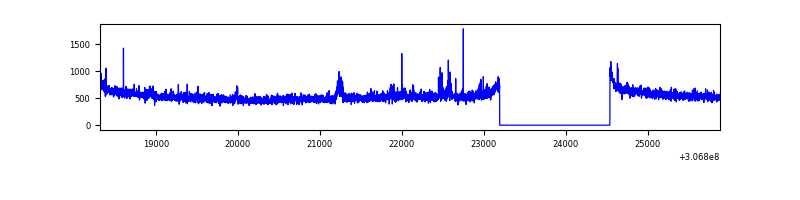 |
| C | 7563 | 6219 | 1 | 1 | 0.01% | 0.02% | 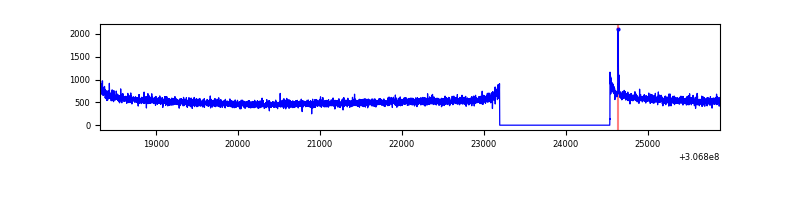 |
| D | 7563 | 6219 | 89 | 89 | 1.18% | 1.43% | 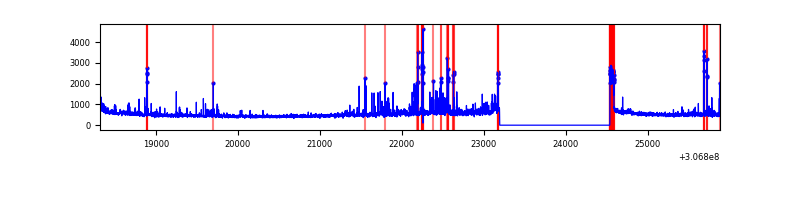 |
Top three noisy pixels from each quadrant. If the there are fewer than three noisy pixels in the level2.evt file, extra rows are filled as -1
| Pixel properties | Quadrant properties | ||||||
|---|---|---|---|---|---|---|---|
| Quadrant | DetID | PixID | Counts | Sigma | Mean | Median | Sigma |
| A | 12 | 96 | 37748 | 221.83 | 844 | 830 | 166.4 |
| A | 13 | 254 | 8823 | 48.03 | 844 | 830 | 166.4 |
| A | 0 | 226 | 7327 | 39.04 | 844 | 830 | 166.4 |
| B | 0 | 190 | 27681 | 171.96 | 845 | 827 | 156.2 |
| B | 0 | 230 | 26403 | 163.78 | 845 | 827 | 156.2 |
| B | 12 | 111 | 18540 | 113.43 | 845 | 827 | 156.2 |
| C | 14 | 238 | 129263 | 697.38 | 798 | 807 | 184.2 |
| C | 0 | 239 | 21705 | 113.45 | 798 | 807 | 184.2 |
| C | 3 | 233 | 8050 | 39.32 | 798 | 807 | 184.2 |
| D | 1 | 52 | 340458 | 1801.46 | 791 | 771 | 188.6 |
| D | 9 | 68 | 106634 | 561.42 | 791 | 771 | 188.6 |
| D | 14 | 35 | 95328 | 501.46 | 791 | 771 | 188.6 |
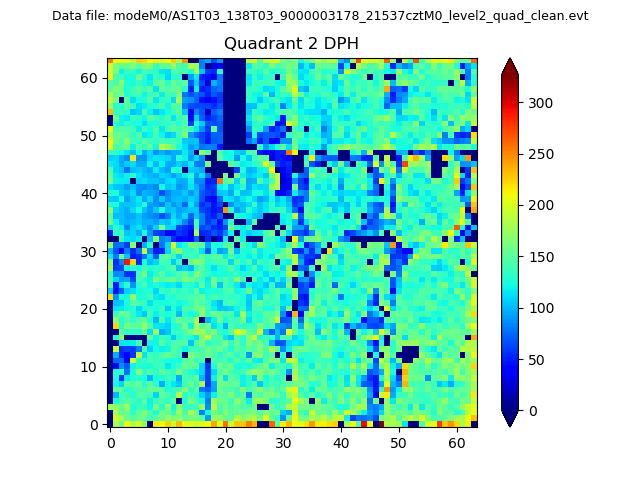
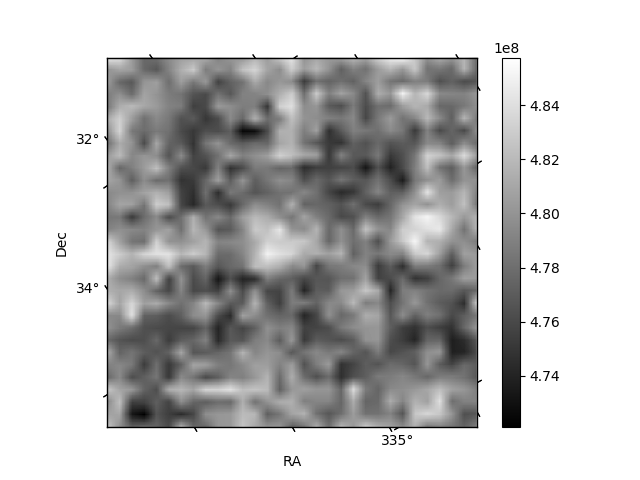
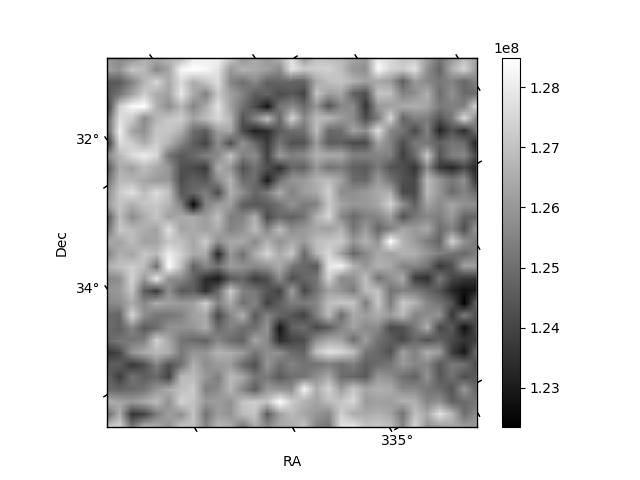
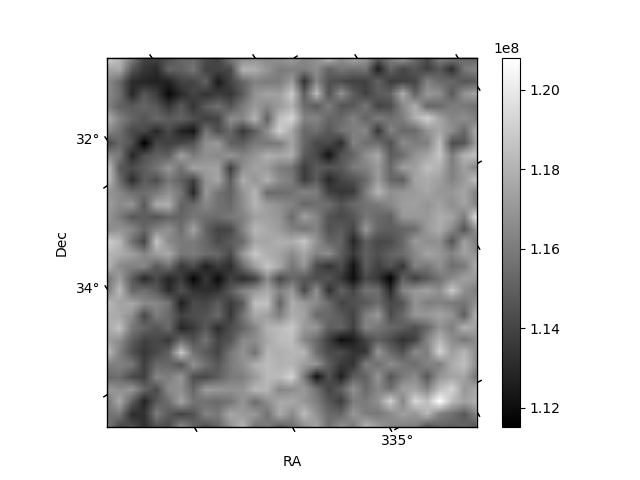
Histogram calculated using DETX and DETY for each event in the final _common_clean file
| Quadrant A | 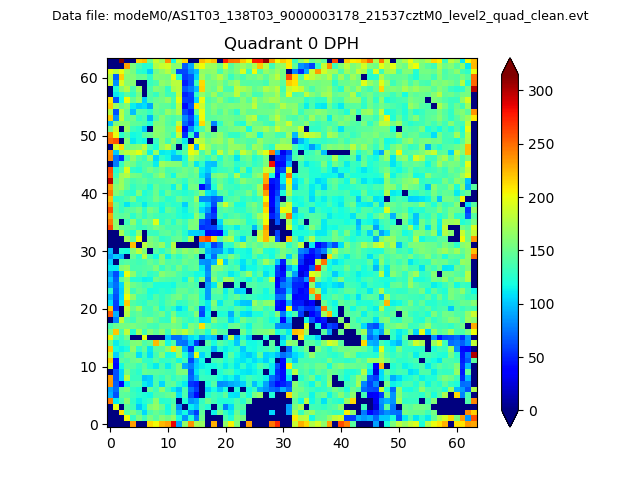 |
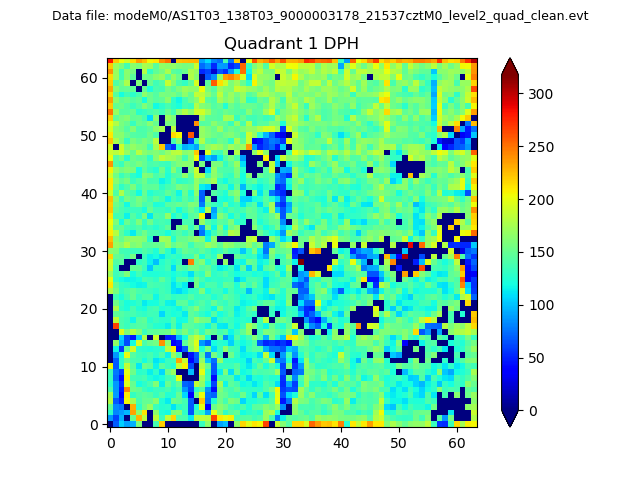 |
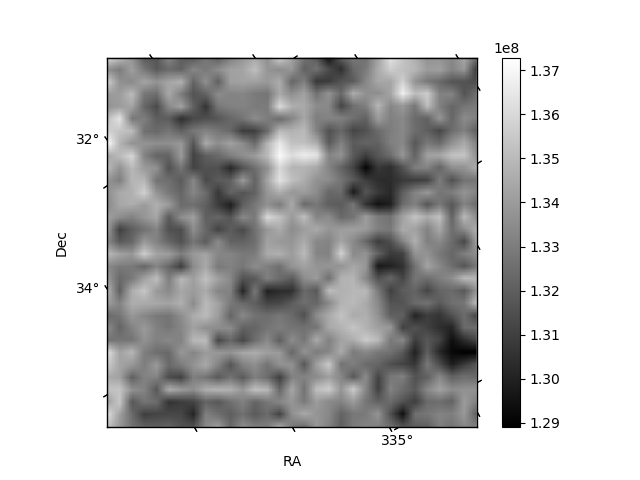
Quadrant B |
|---|---|---|---|
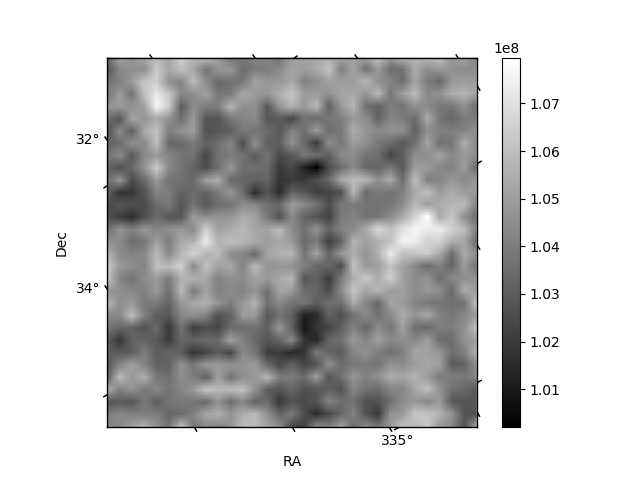
| Quadrant D | 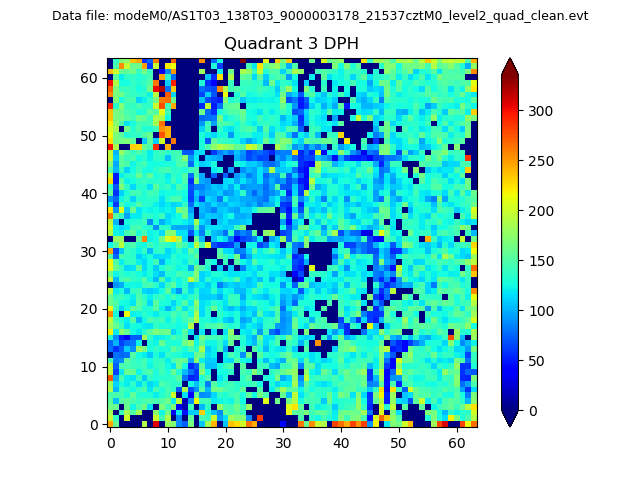 |
 |
Quadrant C |
| Plot type | Count rate plots | Images |
|---|---|---|
| Comparison with Poisson distribution Blue bars denote a histogram of data divided into 1 sec bins. Red curve is a Poisson curve with rate = median count rate of data. |
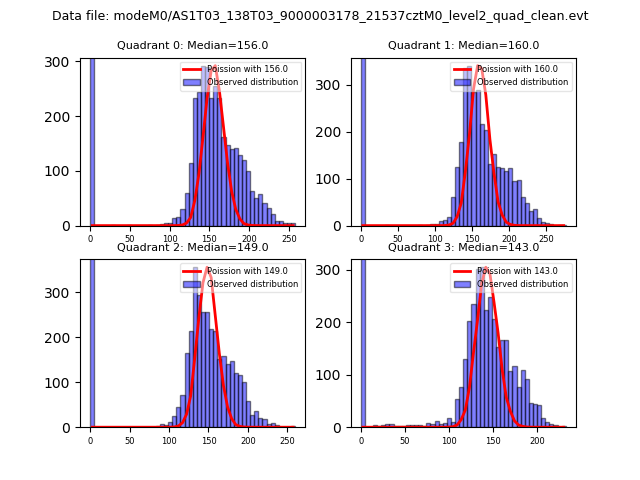 |
 |
| Quadrant-wise count rates Data is divided into 100 sec bins |
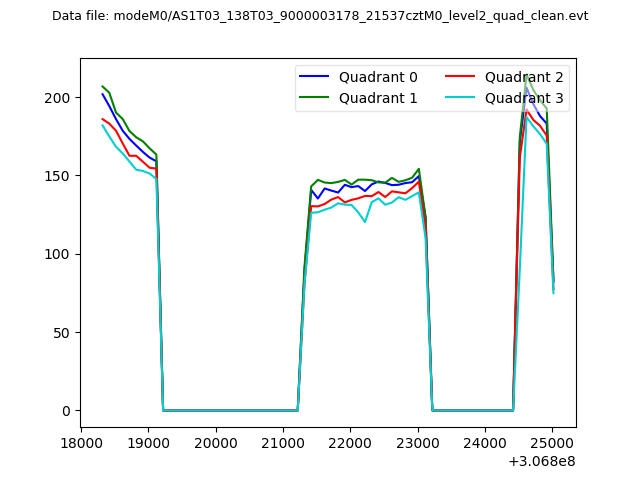 |
|
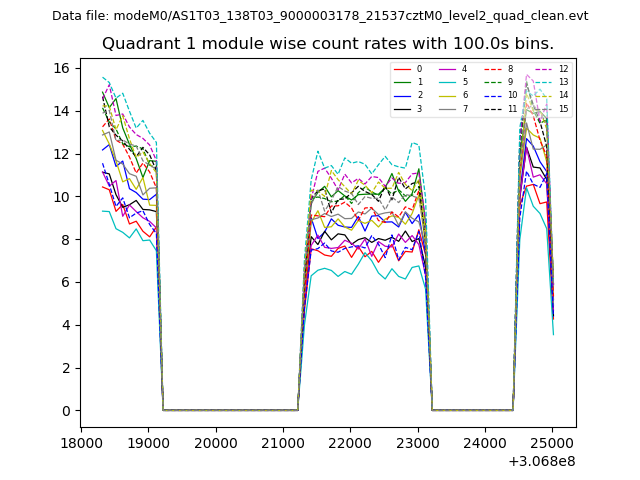
| Module-wise count rates for Quadrant A Data is divided into 100 sec bins |
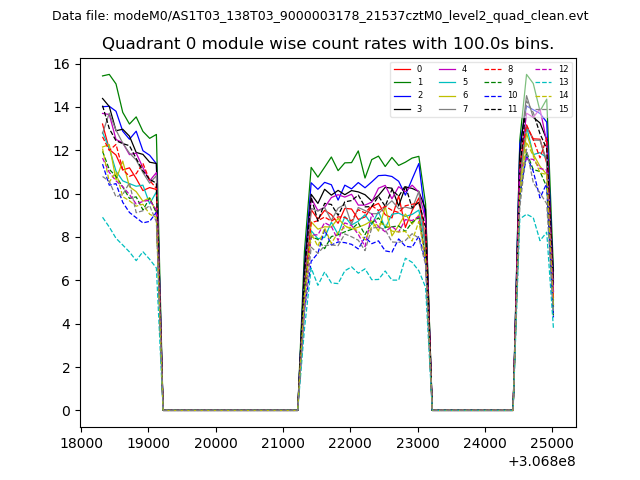 |
 |
| Module-wise count rates for Quadrant B Data is divided into 100 sec bins |
 |
 |
| Module-wise count rates for Quadrant C Data is divided into 100 sec bins |
 |
 |
| Module-wise count rates for Quadrant D Data is divided into 100 sec bins |
 |
 |
| Parameter | Plot |
|---|---|
| CZT HV Monitor | 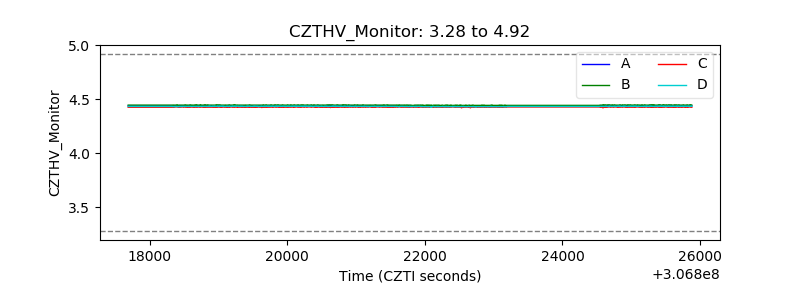 |
| D_VDD |  |
| Temperature 1 | 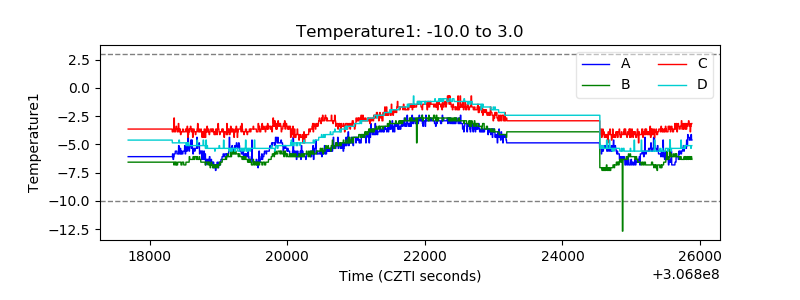 |
| Veto HV Monitor | 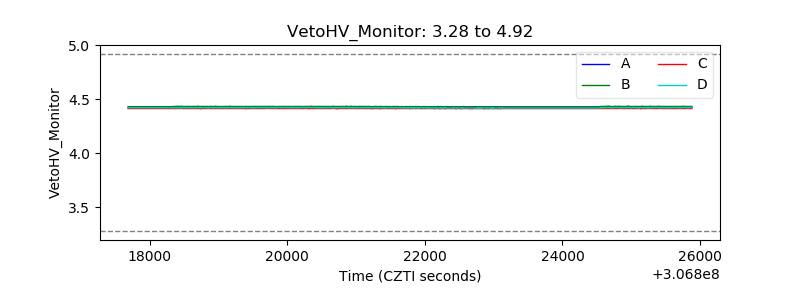 |
| Veto LLD |  |
| Alpha Counter | 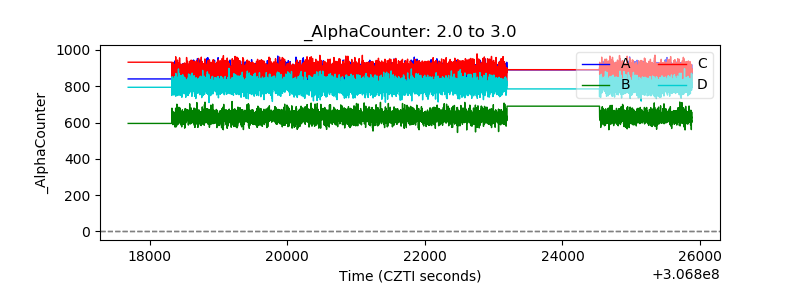 |
| _CPM_Rate | 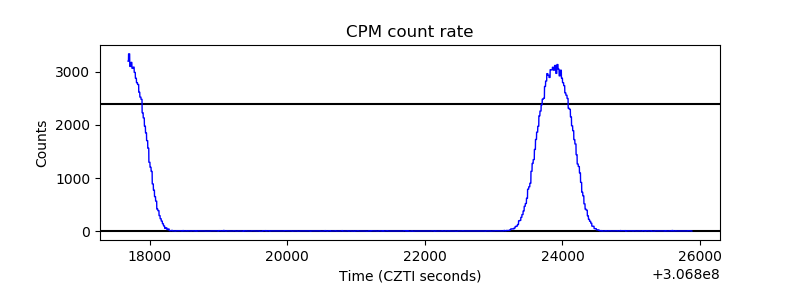 |
| CZT Counter | 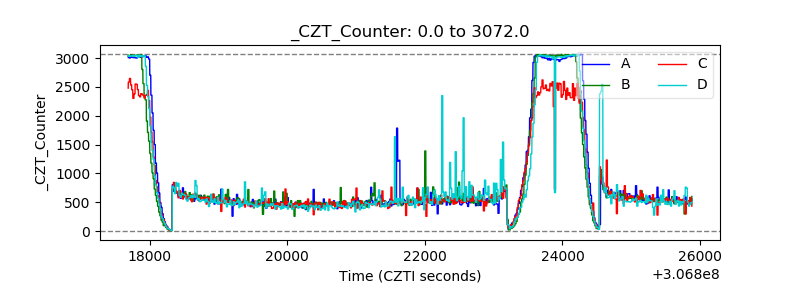 |
| +2.5 Volts monitor |  |
| +5 Volts monitor |  |
| _ROLL_ROT |  |
| _Roll_DEC | 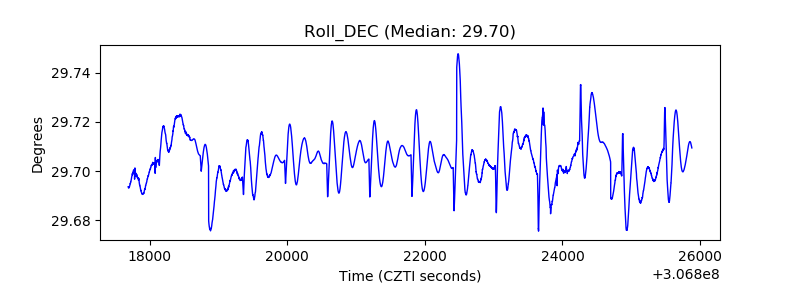 |
| _Roll_RA | 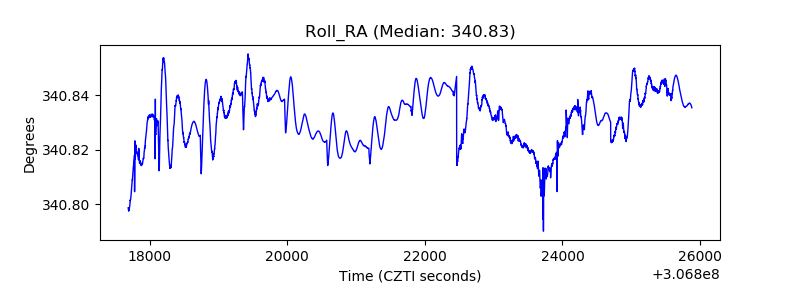 |
| Veto Counter |  |