| Param | Original file | Final file |
|---|---|---|
| Filename | modeM0/AS1T03_138T03_9000003178_21538cztM0_level2.evt | modeM0/AS1T03_138T03_9000003178_21538cztM0_level2_quad_clean.evt |
| Size (bytes) | 303,396,480 | 50,244,480 |
| Size | 289.3 MB | 47.9 MB |
| Events in quadrant A | 2,172,351 | 317,124 |
| Events in quadrant B | 2,231,428 | 327,297 |
| Events in quadrant C | 2,178,235 | 299,284 |
| Events in quadrant D | 2,324,293 | 285,822 |
| Mode SS | |||
|---|---|---|---|
| Quadrant | BADHDUFLAG | Total packets | Discarded packets |
| A | 0 | 82 | 0 |
| B | 0 | 82 | 0 |
| C | 0 | 82 | 0 |
| D | 0 | 82 | 0 |
| Mode M9 | |||
|---|---|---|---|
| Quadrant | BADHDUFLAG | Total packets | Discarded packets |
| A | 0 | 2 | 0 |
| B | 0 | 3 | 0 |
| C | 0 | 3 | 0 |
| D | 0 | 3 | 0 |
| Mode M0 | |||
|---|---|---|---|
| Quadrant | BADHDUFLAG | Total packets | Discarded packets |
| A | 0 | 8761 | 1 |
| B | 0 | 8980 | 1 |
| C | 0 | 8776 | 1 |
| D | 0 | 9456 | 1 |
| Quadrant | Total seconds | Saturated seconds | Saturation percentage |
|---|---|---|---|
| A | 4138 | 11 | 0.265829% |
| B | 4138 | 17 | 0.410826% |
| C | 4138 | 27 | 0.652489% |
| D | 4138 | 64 | 1.546641% |
Noise dominated data is calculated using 1-second bins in cleaned event files. If a bin has >2000 counts, and if more than 50% of those come from <1% of pixels, then it is considered to be noise-dominated and hence unusable.
| Quadrant | # 1 sec bins | Bins with >0 counts | Bins with >2000 counts | High rate bins dominated by noise | Noise dominated (total time) | Noise dominated (detector-on time) | Marked lightcurve |
|---|---|---|---|---|---|---|---|
| A | 4138 | 4138 | 0 | 0 | 0.00% | 0.00% | 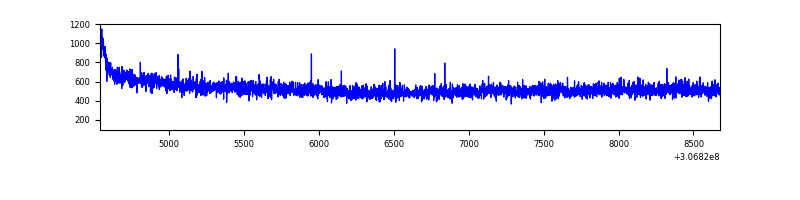 |
| B | 4138 | 4138 | 0 | 0 | 0.00% | 0.00% | 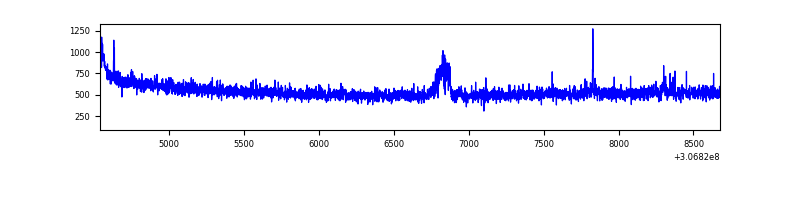 |
| C | 4138 | 4138 | 1 | 1 | 0.02% | 0.02% | 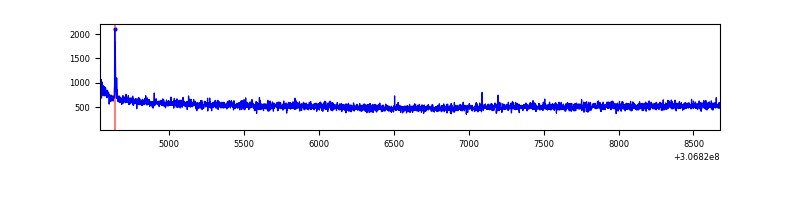 |
| D | 4138 | 4138 | 57 | 57 | 1.38% | 1.38% | 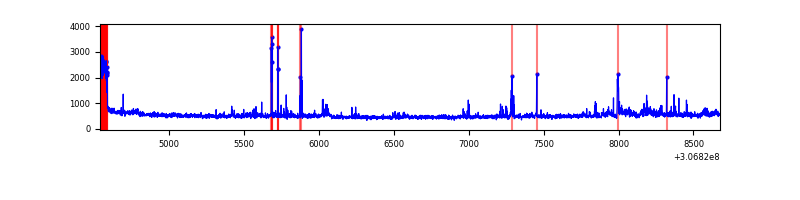 |
Top three noisy pixels from each quadrant. If the there are fewer than three noisy pixels in the level2.evt file, extra rows are filled as -1
| Pixel properties | Quadrant properties | ||||||
|---|---|---|---|---|---|---|---|
| Quadrant | DetID | PixID | Counts | Sigma | Mean | Median | Sigma |
| A | 13 | 254 | 5852 | 47.15 | 563 | 554 | 112.4 |
| A | 0 | 226 | 4819 | 37.96 | 563 | 554 | 112.4 |
| A | 3 | 137 | 4395 | 34.19 | 563 | 554 | 112.4 |
| B | 0 | 230 | 34694 | 326.82 | 559 | 547 | 104.5 |
| B | 12 | 111 | 12140 | 110.96 | 559 | 547 | 104.5 |
| B | 11 | 111 | 10498 | 95.24 | 559 | 547 | 104.5 |
| C | 14 | 238 | 85583 | 698.96 | 526 | 532 | 121.7 |
| C | 0 | 239 | 35800 | 289.84 | 526 | 532 | 121.7 |
| C | 3 | 233 | 3915 | 27.8 | 526 | 532 | 121.7 |
| D | 9 | 68 | 121303 | 959.31 | 525 | 511 | 125.9 |
| D | 1 | 52 | 108136 | 854.74 | 525 | 511 | 125.9 |
| D | 14 | 35 | 88639 | 699.9 | 525 | 511 | 125.9 |
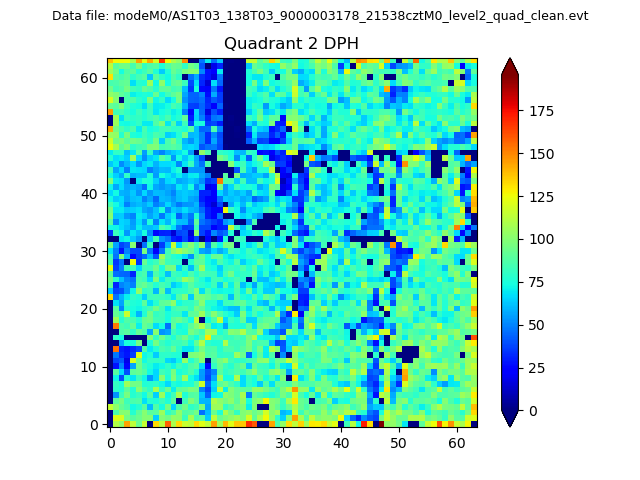
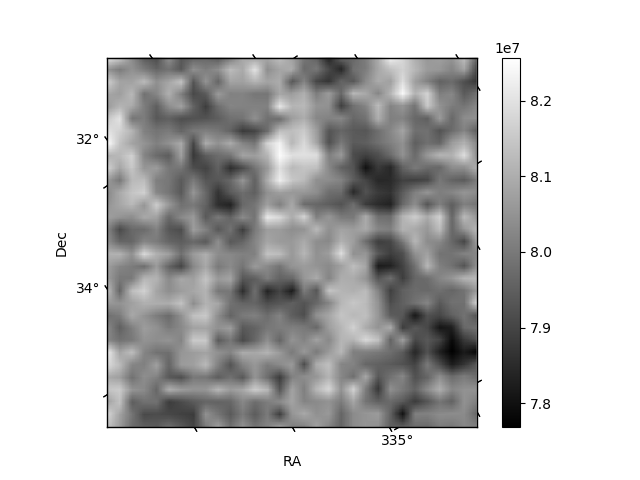
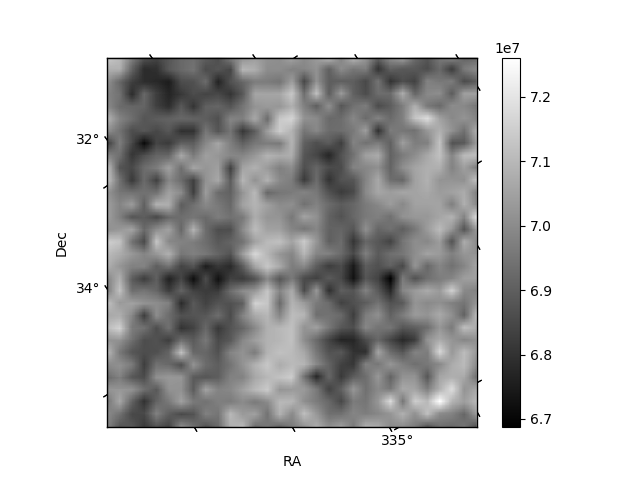
Histogram calculated using DETX and DETY for each event in the final _common_clean file
| Quadrant A | 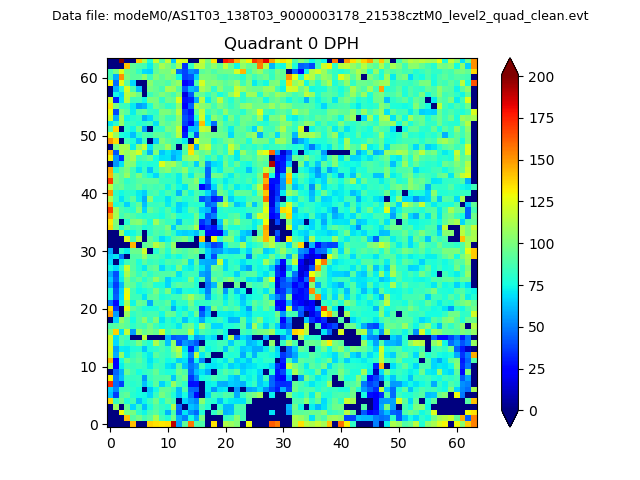 |
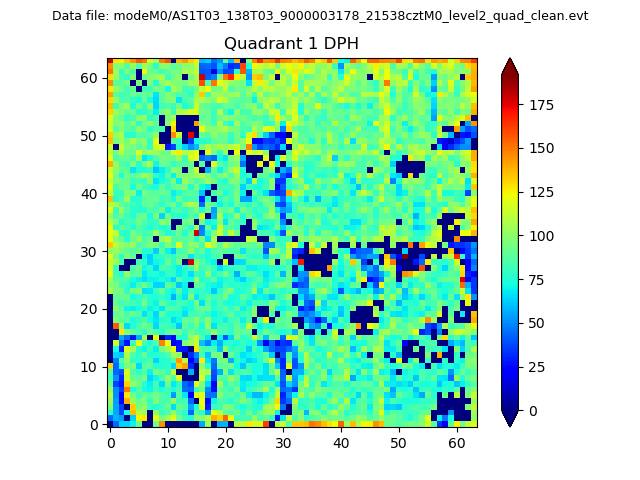 |
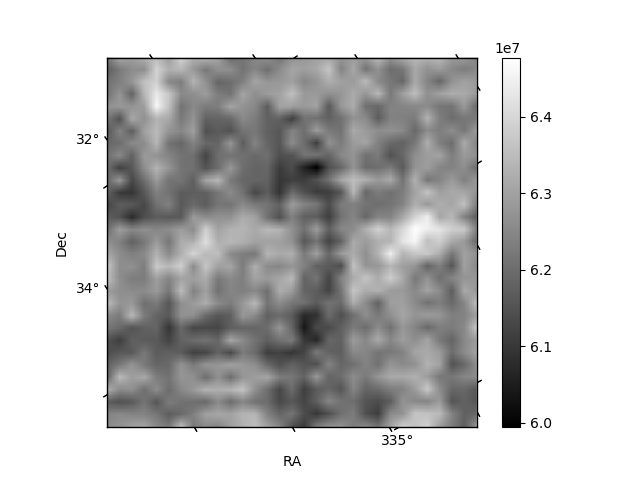
Quadrant B |
|---|---|---|---|
| Quadrant D | 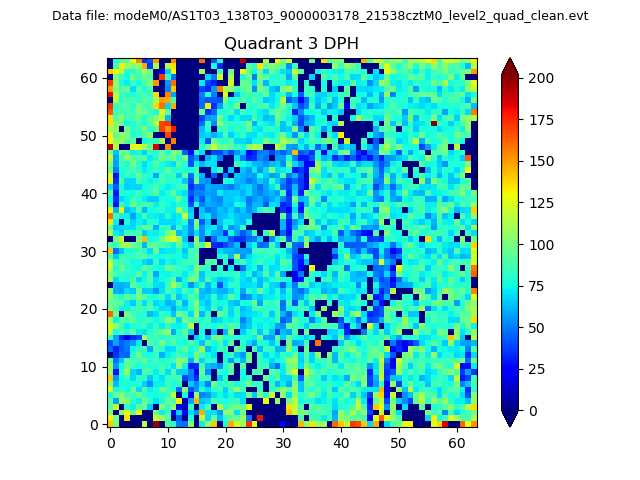 |
 |
Quadrant C |
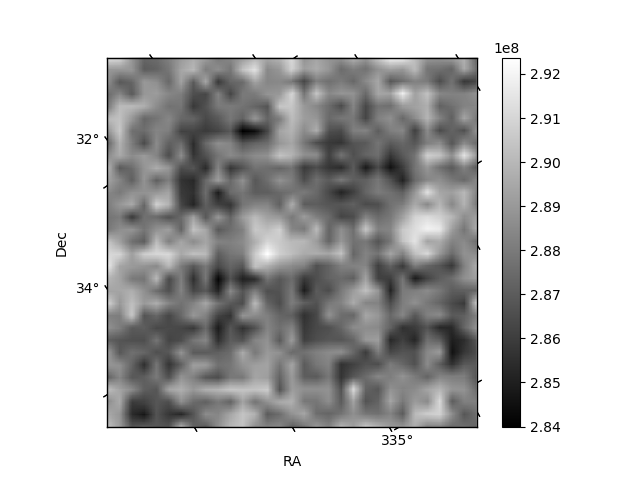
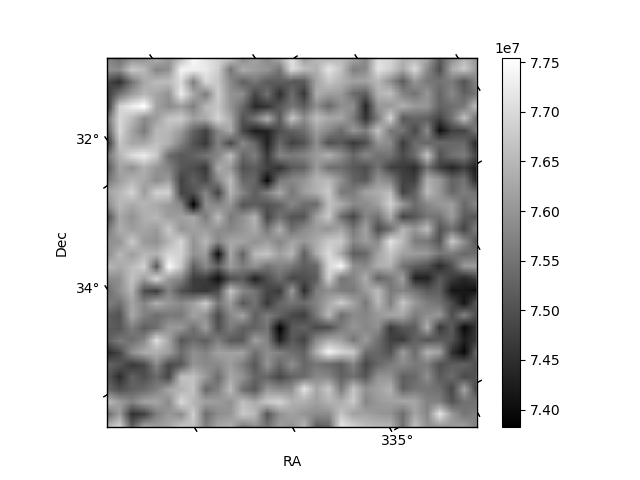
| Plot type | Count rate plots | Images |
|---|---|---|
| Comparison with Poisson distribution Blue bars denote a histogram of data divided into 1 sec bins. Red curve is a Poisson curve with rate = median count rate of data. |
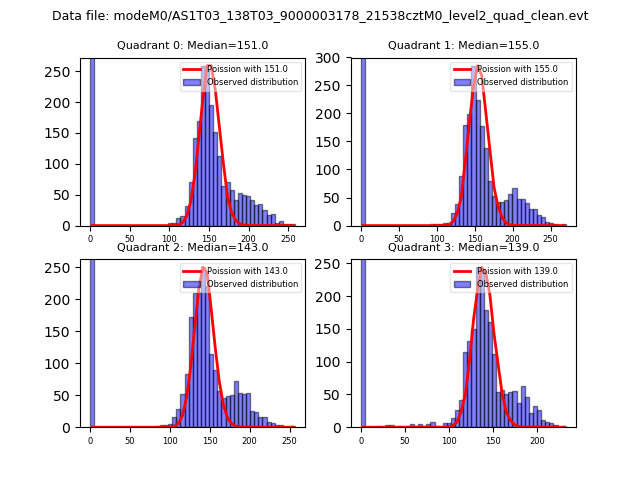 |
 |
| Quadrant-wise count rates Data is divided into 100 sec bins |
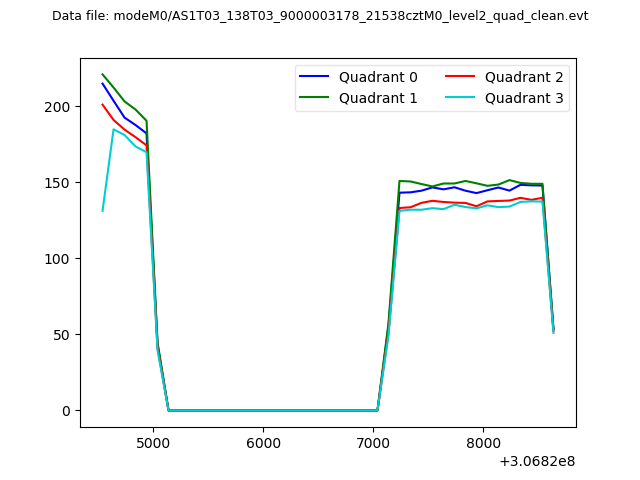 |
|
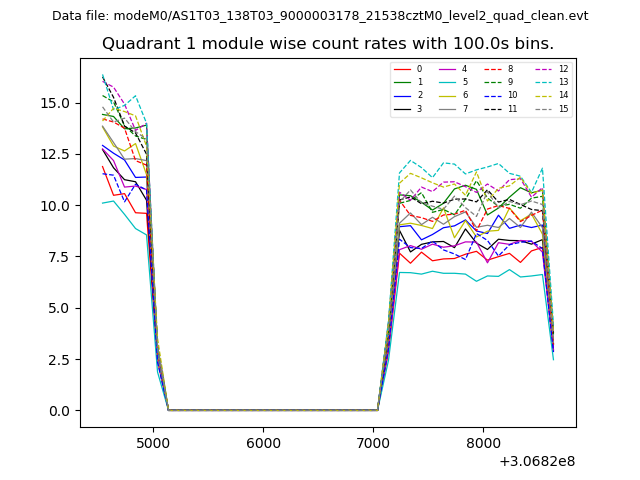
| Module-wise count rates for Quadrant A Data is divided into 100 sec bins |
 |
 |
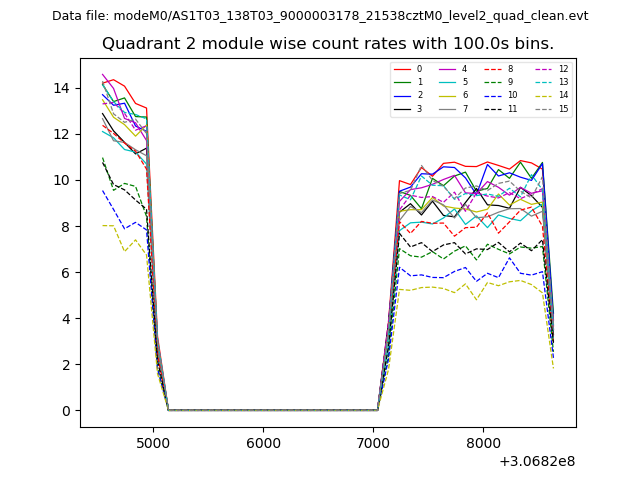
| Module-wise count rates for Quadrant B Data is divided into 100 sec bins |
 |
 |
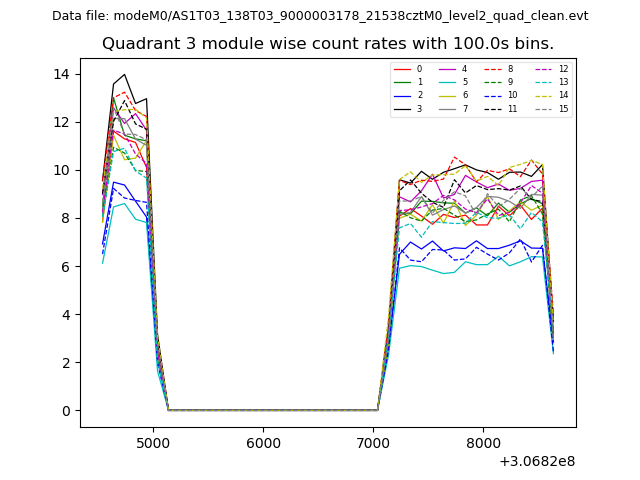
| Module-wise count rates for Quadrant C Data is divided into 100 sec bins |
 |
 |
| Module-wise count rates for Quadrant D Data is divided into 100 sec bins |
 |
 |
| Parameter | Plot |
|---|---|
| CZT HV Monitor | 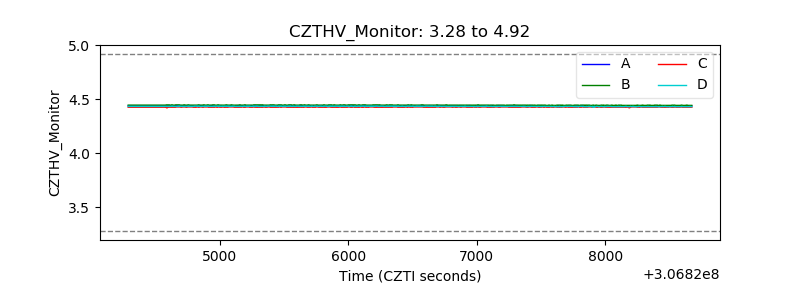 |
| D_VDD |  |
| Temperature 1 | 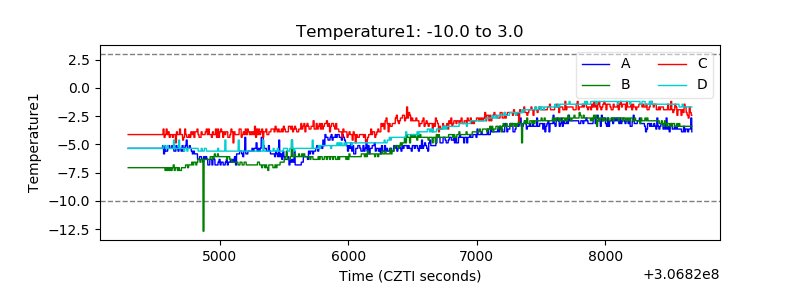 |
| Veto HV Monitor | 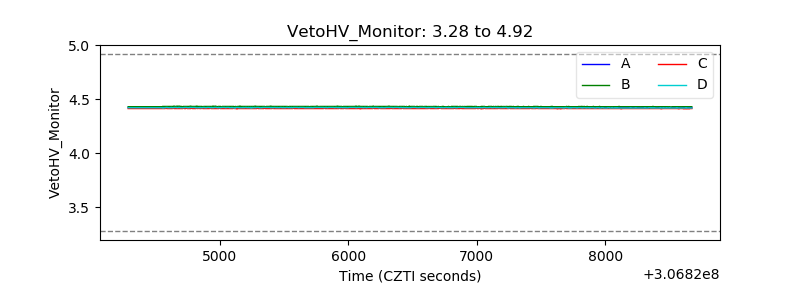 |
| Veto LLD |  |
| Alpha Counter | 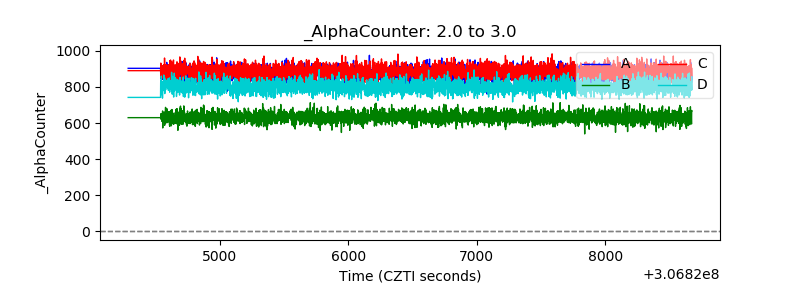 |
| _CPM_Rate | 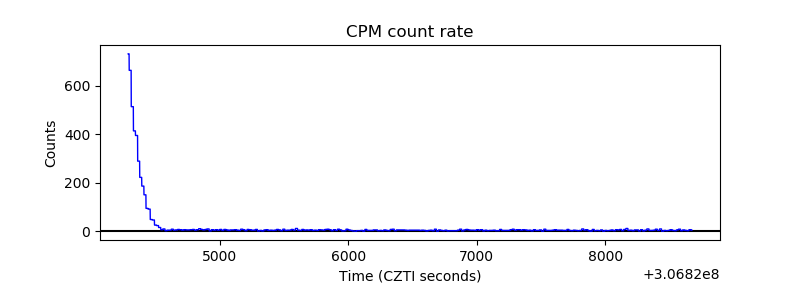 |
| CZT Counter | 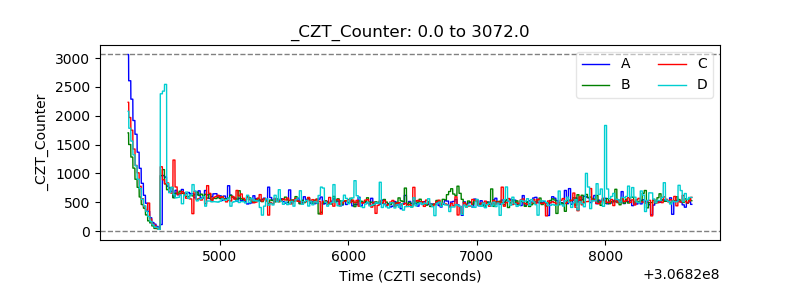 |
| +2.5 Volts monitor |  |
| +5 Volts monitor |  |
| _ROLL_ROT | 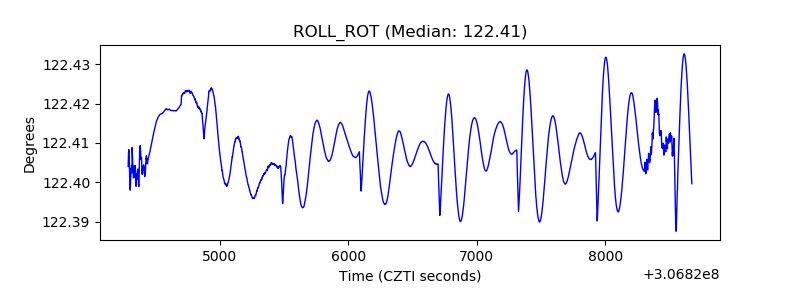 |
| _Roll_DEC | 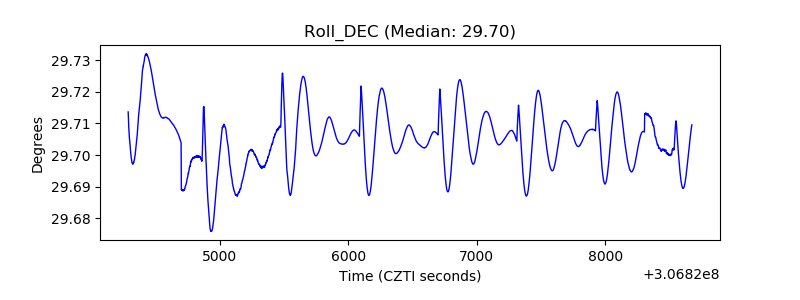 |
| _Roll_RA | 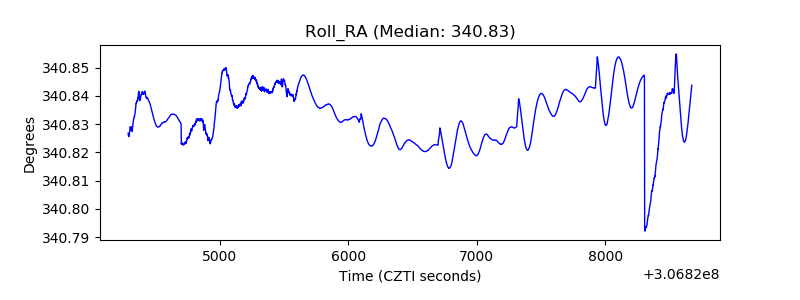 |
| Veto Counter | 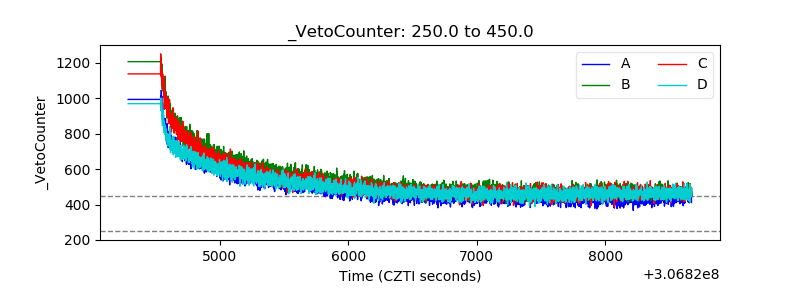 |